


Introduction
Alterations in the composition and function of organelles, particularly the degeneration of mitochondria, are among the major hallmarks of senescence [1, 2]. As senescence progresses, structural changes occur in our mitochondria, such as an increase in their size and mass, which ultimately leads to functional defects [3]. Defective mitochondria create reactive oxygen species (ROS) as byproducts through leaking electrons from the electron transport complex (ETC) [4]. Defective mitochondria serve as both a source of mitochondrial ROS generation and a target of mitochondrial ROS–induced oxidative stress [5]. Increased oxidative stress further damages mitochondria, subsequently increasing mitochondrial ROS generation [5]. Excessive level of ROS impairs the structure and function of other organelles, consequently leading to senescence [6]. Previous studies conducted on mice that are lacking in superoxide dismutase 1 (SOD1), an enzyme that destroys free radicals in the mitochondrial intermembrane space and matrix, have verified this causal relationship [7]. SOD1 deficiency leads to premature aging in skeletal muscle due to increased superoxide anions (O2●−) generation and subsequent oxidative damage [7]. Thus, methods to decrease mitochondrial oxidative stress could be advantageous as an anti–aging treatment [8, 9]. The usefulness of this approach is further supported by the finding that the mitochondrial–specific antioxidant, MitoQ, reduces mitochondrial ROS generation and reverses neurodegeneration [10]. Given the role of ROS-induced oxidative stress on senescence, better understanding the mechanisms that control it is an urgent priority.
The skin is composed of the epidermis, made of mainly epithelial tissue, and the dermis, made of mainly connective tissue [11]. Collagen, which accounts for 90% of the dermis layer, makes skin tissue elastic and maintains the shape and elasticity of the skin [11]. The most obvious phenomenon in skin aging is the decrease in collagen, which causes a reduction in skin elasticity and a formation of wrinkles [12]. In particular, ROS has been suggested as the main cause of skin aging by stimulating collagen oxidation and collagen–elastin chain cleavage [12]. Therefore, strategies using antioxidants that neutralize free radicals are used to inhibit skin aging [13]. For instance, vitamin C, a well–known antioxidant, mitigates the degradation of endogenous collagen in skin tissue by reducing the production of free radicals [14]. Additionally, the antioxidant niacinamide reduces skin damage by inhibiting collagen damage caused by free radicals [15]. Therefore, antioxidant–based techniques may be useful treatments for slowing or stopping skin aging.
Magnolia officinalis (M. officinalis) is an evergreen tree distributed in East Asia, mainly found in Korea, Japan, and China [16]. M. officinalis is a medicinal plant historically utilized in traditional medicine for its anti–inflammatory, antibacterial, and antioxidant properties [17]. Moreover, M. officinalis extract has been utilized as an efficacious cosmetic material to enhance skin whitening and diminish skin pigmentation [18]. However, the aging rejuvenation mechanism and core ingredient of the aging rejuvenation effect of M. officinalis extract have not yet been discovered. Consequently, comprehending the mechanism of the aging rejuvenation effect of M. officinalis extracts and identifying the core ingredients will further expand the application fields of M. officinalis extracts as aging rejuvenation agents and cosmetic materials.
Mitochondria are the main organelles that generate free radicals that cause cell damage [19]. Mitochondria consume over 90% of oxygen, and complexes I and III of the ETC convert 1% to 5% of oxygen into ROS [19]. The development of various mitochondrial-specific dyes has made it possible to measure mitochondrial ROS, among which dihydrorhodamine 123 (DHR123) and MitoSOX are extensively used. DHR123 is a reduction product of rhodamine 123, a dye that passively diffuses across cell membranes and selectively stains mitochondria [20]. Thus, DHR123 reacts with ROS present in mitochondria and is oxidized to cationic rhodamine 123, allowing for measurement of ROS levels present in mitochondria [21]. MitoSOX has positively charged triphenylphosphonium ion (TPP+), which accumulates in the negatively charged mitochondrial matrix [22]. Dehydroethidium bound to TPP+ reacts with superoxide in the mitochondrial matrix [22].
Here, we aimed to find substances that effectively reduce mitochondrial ROS generation using a library of natural products widely used as cosmetic materials. M. officinalis extract was found to reduce ROS levels by restoring mitochondrial function. Furthermore, we found out which components of M. officinalis extract were responsible for these effects. Here, in order to ameliorate senescence-associated phenotypes and reverse skin aging, we propose a unique ROS-reducing mechanism of M. officinalis extract.
Results
Mitochondrial ROS levels in senescent fibroblasts are significantly reduced by M. officinalis extract
Among the commonly used cosmetic materials, M. officinalis, Polygonatum odoratum (P. odoratum), Magnolia liliiflora (M. liliiflora), and Passiflora caerulea (P. caerulea) extracts were used to identify potential candidates that could significantly reduce mitochondrial ROS levels. M. officinalis extract is recognized as effective in skin hydration and soothing [17]. P. odoratum extract is effective for skin whitening and moisturizing [23]. M. liliiflora has been used since ancient times for its skin-relaxing properties [24]. P. caerulea extract is widely used as a cosmetic ingredient because it is rich in natural substances with antioxidant functions such as anthocyanins and polyphenols [25, 26]. Each extract was treated to senescent fibroblasts at a concentration of 10 μg/ml for a period of 12 days. Subsequently, we examined the impact of each extract on ROS levels by using DHR123 which can specifically detect ROS in mitochondria [20]. A strong antioxidant, resveratrol, served as a positive control [27]. Resveratrol significantly reduced ROS levels in senescent fibroblasts (Figure 1A). Young fibroblasts were also employed as a positive control. As expected, young fibroblasts had substantially lower ROS levels than senescent fibroblasts treated with DMSO [28] (Figure 1A). Among the four substances, M. officinalis extract significantly reduced ROS levels (Figure 1A).
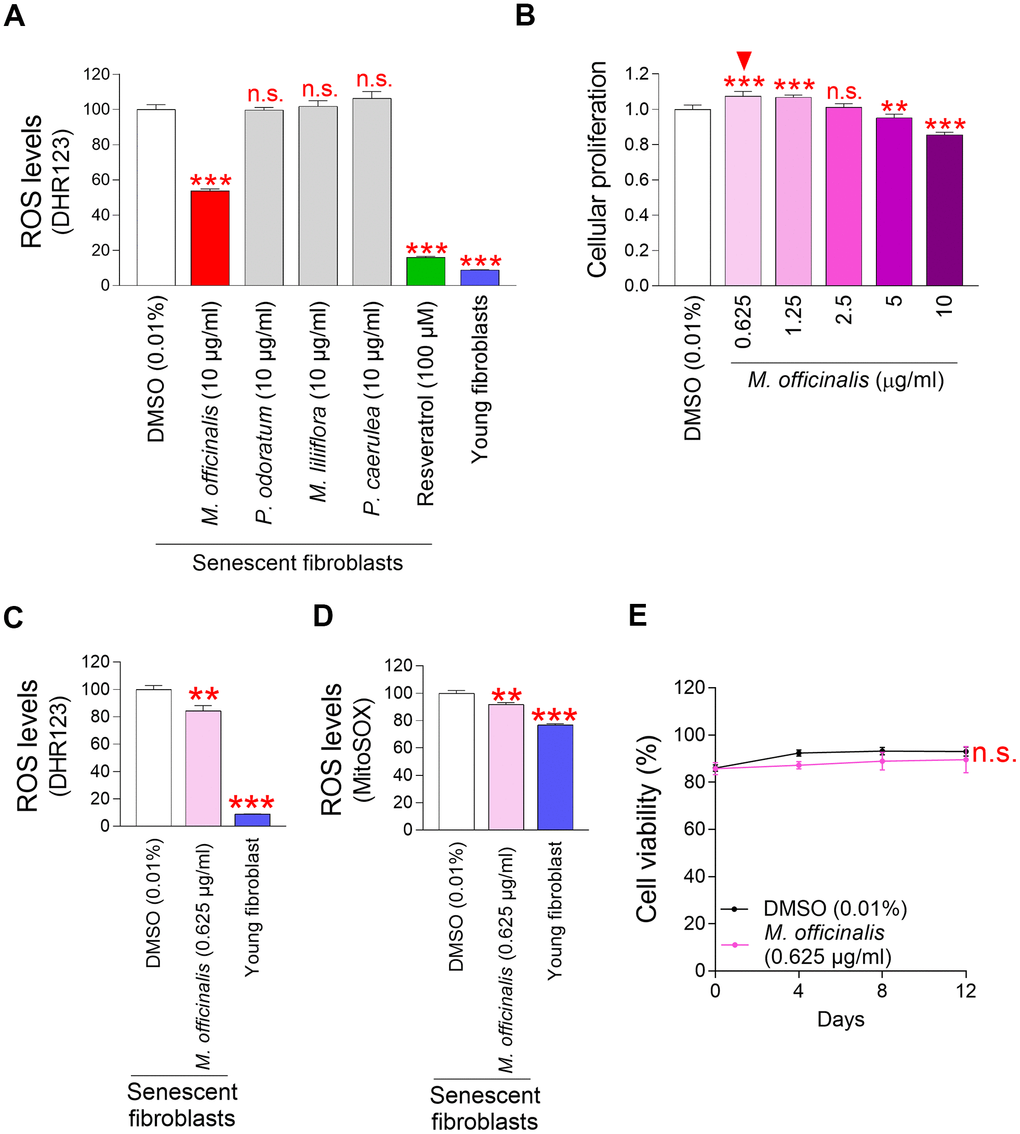
Figure 1. Mitochondrial ROS levels in senescent fibroblasts are significantly reduced by M. officinalis extract. (A) Senescent fibroblasts were treated with M. officinalis, P. odoratum, M. liliiflora and P. caerulea extract at a 10 μg/ml. On day 12, the impact on mitochondrial ROS levels was evaluated. DMSO was diluted in the medium to 0.01% to serve as DMSO control. Use of dihydrorhodamine 123 (DHR123) for flow cytometric analysis of mitochondrial ROS levels. Resveratrol (100 μM) and young fibroblasts were used as a positive control. n.s. (not significant), ***P < 0.001, Student's t–test. Mean ± S.D., N = 3. (B) On day 12 following treatment, cellular proliferation in senescent fibroblasts was assessed at varying doses of M. officinalis extract (0.625, 1.25, 2.5, 5, and 10 μg/ml). n.s. (not significant), **P < 0.01, ***P < 0.001, Student's t–test. Mean ± S.D., N = 3. Arrowhead shows the optimal concentration of M. officinalis extract for promoting cellular proliferation. (C) DMSO (0.01%) or M. officinalis extract (0.625 μg/ml) were administered to senescent fibroblasts for 12 days. Then, the flow cytometric analysis of ROS (DHR123) was conducted. Young fibroblasts were used as a positive control. **P < 0.01, ***P < 0.001, Student's t–test. Mean ± S.D., N = 3. (D) DMSO (0.01%) or M. officinalis extract (0.625 μg/ml) were administered to senescent fibroblasts for 12 days. Use of MitoSOX for flow cytometric analysis of mitochondrial ROS levels. Young fibroblasts were used as a positive control. **P < 0.01, ***P < 0.001, Student's t–test. Mean ± S.D., N = 3. (E) Senescent fibroblasts were treated with DMSO (0.01%) or M. officinalis extract (0.625 μg/ml). Measurement of cell viability after 0, 4, 8, and 12 days of treatment. n.s. (not significant), two–way ANOVA followed by Bonferroni’s post–hoc test. Mean ± S.D., N = 3.
However, P. odoratum extract, M. liliiflora extract, and P. caerulea extract, which are recognized for their efficacy in skin care, were not beneficial in lowering ROS levels (Figure 1A). These findings indicate that M. officinalis extract was the sole component to exhibit antioxidant activity among the four extracts that are recognized as useful in skin care.
The finding that M. officinalis extract was effective in reducing ROS led to experiments to determine the optimal concentration at which M. officinalis extract reduced senescence–associated phenotypes. Since cell cycle arrest is one of the major hallmarks of senescence [17], the anti-senescence effect of M. officinalis extract was investigated based on whether M. officinalis extract has a cell proliferation-inducing effect. To find the optimal concentration for inducing cell proliferation effects, senescent fibroblasts were treated with M. officinalis at concentrations of 0.625, 1.25, 2.5, 5, and 10 μg/ml. Among the various concentrations, the cell proliferation induction effect was found at 0.625 and 1.25 μg/ml (Figure 1B). However, there was no effect at 2.5 μg/ml, and a decrease in cell proliferation was observed at 5 and 10 μg/ml (Figure 1B). These differences may be due to drug toxicity when the drug concentration exceeds the availability of intracellular drug receptors [29], or the failure of the drug to produce the desired pharmacological response when the drug concentration does not reach the availability of receptors [30]. Therefore, 0.625 μg/ml was selected as the optimal concentration of M. officinalis extract since it was the lowest concentration that causes cell proliferation.
Because the optimal concentration of M. officinalis extract (0.625 μg/ml) was different from the concentration (10 μg/ml) used in the ROS–based screening (Figure 1A), we investigated whether the ROS–lowering effect was maintained even at the optimal concentration. In addition to DHR123, MitoSox, which can detect O2●− present in mitochondria, was used [31]. Senescent fibroblasts treated with DMSO had significantly higher mitochondrial ROS levels than young fibroblasts, whereas treatment with M. officinalis significantly reduced mitochondrial ROS levels in senescent fibroblasts (Figure 1C, 1D). These results suggest that the ROS–lowering effect of M. officinalis extract was reproducible even at 0.625 μg/ml.
Next, determining the optimal concentration of M. officinalis led us to investigate the toxicity of M. officinalis at the selected concentration. Cell proliferation measurement evaluates the rate at which cells divide in response to a drug [32], while cell viability measurement evaluates the percentage of living cells in response to a drug [33]. Therefore, cell viability was measured to assess whether M. officinalis extract was toxic to cells. The viability of M. officinalis extract-senescent fibroblasts was comparable to that of DMSO-treated senescent fibroblasts, indicating that M. officinalis at the selected concentration was not cell–toxic (Figure 1E).
M. officinalis extract reduces mitochondrial ROS generation through mitochondrial functional recovery
A major factor contributing to ROS generation in the mitochondrial ETC is inefficient electron transport [19]. Electron transport abnormalities cause ETC components to generate O2●− [19]. ROS-induced damage to mitochondria reduces the mitochondrial membrane potential (MMP) produced by the movement of protons from the mitochondrial matrix to the intermembrane space [34]. Thus, inefficient electron transport increases mitochondrial ROS generation and decreases MMP, whereas efficient electron transport decreases mitochondrial ROS generation and increases MMP [35]. As we observed a decrease in ROS levels by M. officinalis extract, we investigated the effect of M. officinalis extract on MMP. Senescent fibroblasts treated with DMSO had significantly lower MMP than young fibroblasts, confirming the senescence-associated decrease in MMP [36] (Figure 2A). However, as compared to senescent fibroblasts treated with DMSO, those treated with M. officinalis extract exhibited a significant rise in MMP (Figure 2A).
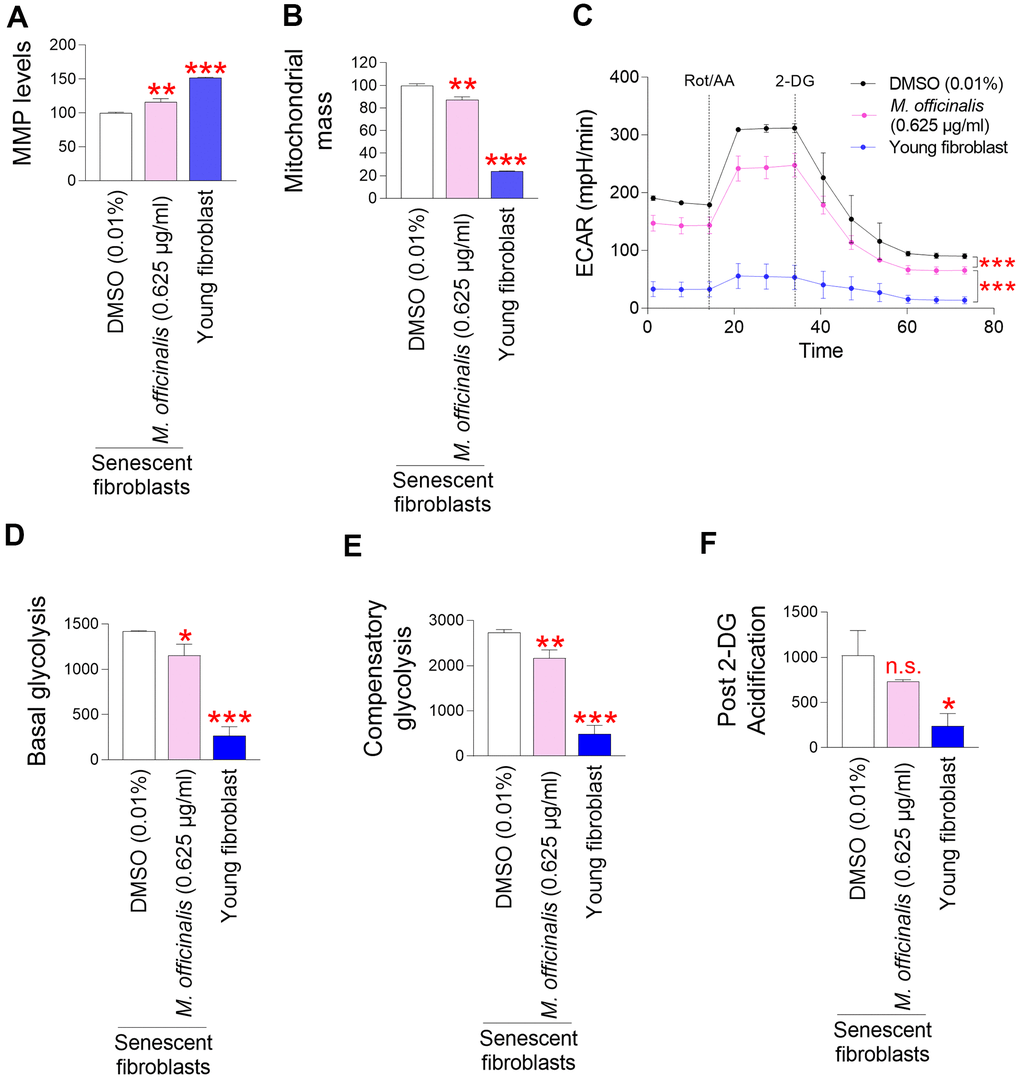
Figure 2. M. officinalis extract reduces mitochondrial ROS generation through mitochondrial functional recovery. (A) Use of JC–10 for flow cytometric measurement of mitochondrial membrane potential (MMP). Senescent fibroblasts were treated with DMSO (0.01%) or M. officinalis extract (0.625 μg/ml) for 12 days. Young fibroblasts were used as a positive control. **P < 0.01, ***P < 0.001, Student's t–test. Mean ± S.D., N = 3. (B) MitoTracker green was employed for a flow cytometric study of mitochondrial mass. Senescent fibroblasts were treated with DMSO (0.01%) or M. officinalis extract (0.625 μg/ml) for 12 days. Young fibroblasts were used as a positive control. **P < 0.01, ***P < 0.001, Student t–test. Mean ± S.D., N = 3. (C) Measurement of extracellular acidification rate (ECAR; mpH/min) after 12 days of treatment with DMSO (0.01%) or M. officinalis extract (0.625 μg/ml) (black line: DMSO–treated senescent fibroblasts, pink line: M. officinalis extract–treated senescent fibroblasts). Young fibroblasts were used as a positive control. ***P < 0.001, two–way ANOVA followed by Bonferroni’s post–hoc test. Means ± S.D., N = 3. (D) Basal glycolysis was measured after 12 days of treatment with DMSO (0.01%) or M. officinalis extract (0.625 μg/ml). Young fibroblasts were used as a positive control. *P < 0.05, ***P < 0.001, Student t–test. Mean ± S.D., N = 3. (E) Compensatory glycolysis was measured after 12 days of treatment with DMSO (0.01%) or M. officinalis extract (0.625 μg/ml). Young fibroblasts were used as a positive control. **P < 0.01, ***P < 0.001, Student's t–test. Mean ± S.D., N = 3. (F) Post–2–DG acidification was measured after 12 days of treatment with DMSO (0.01%) or M. officinalis extract (0.625 μg/ml). Young fibroblasts were used as a positive control. n.s. (not significant), *P < 0.05, Student's t–test. Mean ± S.D., N = 3.
Mitochondrial dysfunction results in a compensatory rise in mitochondrial volume [37]. Therefore, the increase in MMP by M. officinalis prompted us to measure mitochondrial mass. DMSO-treated senescent fibroblasts had significantly higher mitochondrial mass than young fibroblasts, consistent with previous findings [38, 39] (Figure 2B). However, senescent fibroblasts treated with M. officinalis extract showed a decrease in mitochondrial mass compared to the DMSO control, indicating restored mitochondrial function by M. officinalis extract (Figure 2B).
As mitochondrial function deteriorates in senescent cells, reliance on glycolysis as an energy source increases to meet energy requirements [40]. Thus, restoration of mitochondrial function reduces the dependence on glycolysis as a cellular energy source in senescent fibroblasts [41]. Therefore, the observation of restoration of mitochondrial function by M. officinalis prompted us to examine changes in glycolysis dependence. The extracellular acidification rate (ECAR) after sequential injections of rotenone/antimycin A (Rot/AA) and 2-deoxy-D-glucose (2-DG) was used to determine the glycolysis rate. Particularly, the basal glycolysis rate (before to Rot/AA injection), compensatory glycolysis (post-Rot/AA injection), and post-2-DG acidification (post-2-DG injection) were all estimated using the successively measured ECAR values. Senescent fibroblasts treated with DMSO had significantly higher ECAR values than young fibroblasts, consistent with senescence-associated increase in glycolysis rate [38, 39] (Figure 2C). However, senescent fibroblasts treated with M. officinalis extract had lower ECAR values than those treated with DMSO, suggesting that M. officinalis treatment lowed glycolysis rate (Figure 2C). Specifically, senescent fibroblasts treated with DMSO had significantly higher basal levels of glycolysis than young fibroblasts, whereas M. officinalis treatment significantly reduced basal levels of glycolysis, suggesting that the rate of conversion of glucose to lactate was reduced by treatment with M. officinalis [42] (Figure 2D). Addition of a mitochondrial inhibitor (Rot/AA), which inhibits oxidative phosphorylation and induces a compensatory shift toward using glycolysis, resulted in higher compensatory glycolysis in senescent fibroblasts treated with DMSO than young fibroblasts (Figure 2E). However, M. officinalis treatment significantly reduced compensatory glycolysis, suggesting that senescent fibroblasts treated with M. officinalis rely less on glycolysis to meet cellular energy demands (Figure 2E). Addition of 2–DG, which inhibits glycolysis, resulted in higher post 2–DG acidification in senescent fibroblasts treated with DMSO than young fibroblasts (Figure 2F). However, M. officinalis treatment significantly reduced post 2–DG acidification, indicating that M. officinalis-treated senescent fibroblasts have reduced residual glycolysis, which is not entirely suppressed by 2-DG [43] (Figure 2F). These results suggest that M. officinalis reduced the reliance on glycolysis as a cellular energy source, indicating restoration of mitochondrial function by M. officinalis.
In summary, our results indirectly imply the reduction in ROS levels by M. officinalis extract is a consequence of diminished mitochondrial ROS generation, which is facilitated by the restoration of mitochondrial function.
Senescence–associated phenotypes are ameliorated by M. officinalis extract
The restoration of mitochondrial function is one of the prerequisites for the amelioration of senescence [38, 40, 44–46]. The discovery of mitochondrial functional recovery by M. officinalis extract led to an investigation of the effect of M. officinalis on senescence-associated phenotypes. First, we investigated the effect of M. officinalis on senescence–associated beta–galactosidase (SA–β–gal), a characteristic trait of senescence [47]. DMSO-treated senescent fibroblasts had significantly higher percentage of SA–β–gal positive cells than young fibroblasts, whereas M. officinalis treatment significantly reduced the percentage of SA–β–gal positive cells (Figure 3A).
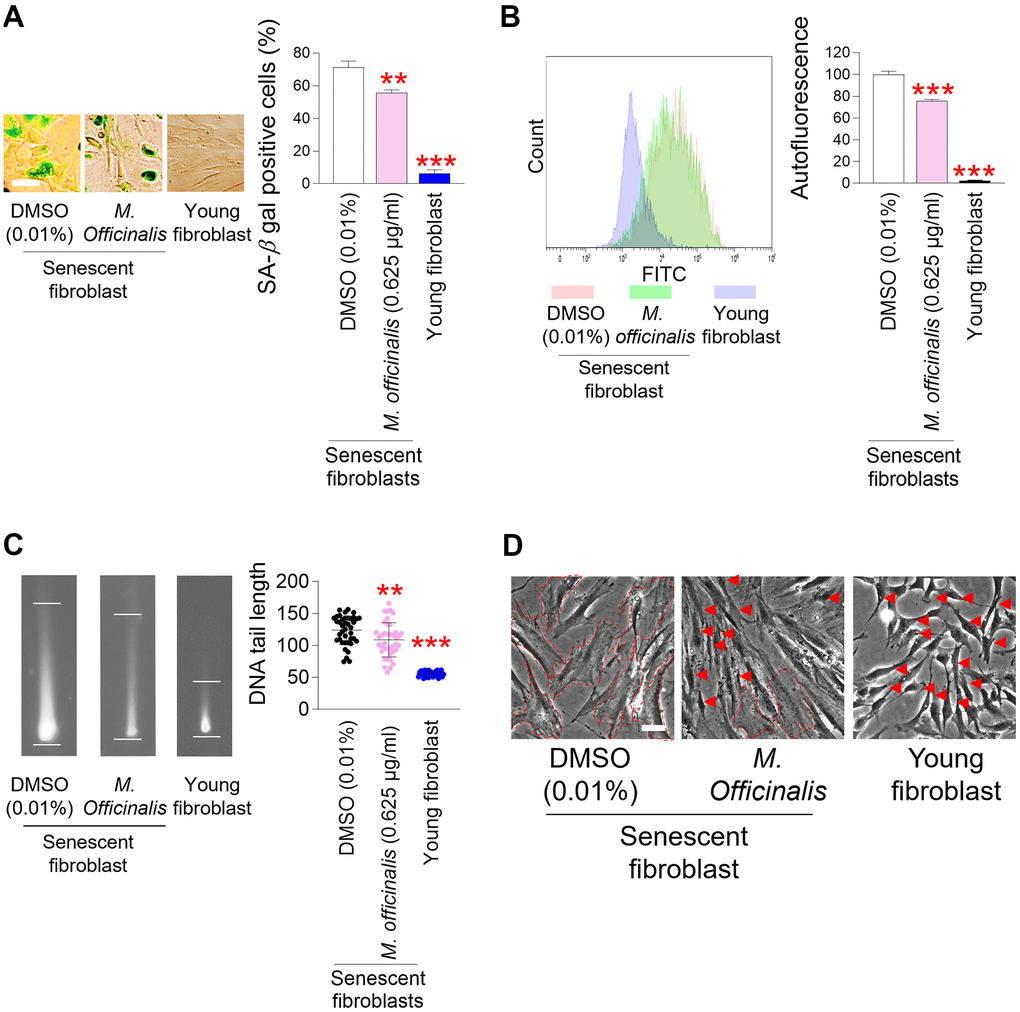
Figure 3. Senescence–associated phenotypes are ameliorated by M. officinalis extract. (A) Measurement of senescence–associated beta–galactosidase (SA–β–gal) positive cells (%). Senescent fibroblasts were treated with DMSO (0.01%) or M. officinalis extract (0.625 μg/ml) for 12 days. Young fibroblasts were used as a positive control. **P < 0.01, ***P < 0.001, Student’s t–test. Means ± S.D., N = 3. Scale bar 20 μm. (B) After 12 days of treatment with DMSO (0.01%) or M. officinalis extract (0.625 μg/ml), autofluorescence was assessed in senescent fibroblasts. Young fibroblasts were used as a positive control. **P < 0.01, ***P < 0.001, Student’s t–test. Means ± S.D., N = 3. (C) After 12 days of treatment with DMSO (0.01%) or M. officinalis extract (0.625 μg/ml), DNA tail length was assessed in senescent fibroblasts by image J. Each dot represents the length of a DNA tail. Young fibroblasts were used as a positive control. **P < 0.01, ***P < 0.001, Student's t–test. Mean ± S.D., N = 40. (D) Morphologies of senescence fibroblasts after 12 days of treatment with DMSO (0.01%) or M. officinalis extract (0.625 μg/ml). Senescent fibroblasts treated with M. officinalis extract exhibited thin and spindly morphology (red arrows), whereas those treated with DMSO exhibited a broad and flat morphology (dotted lines). The scale bar is 20 μm. Young fibroblasts were used as a positive control.
Then, the amount of accumulated intracellular lipofuscin, a characteristic of senescence–associated phenotypes, was evaluated by measuring intracellular autofluorescence levels [48]. Senescent fibroblasts treated with DMSO had significantly higher autofluorescence levels than young fibroblasts, consistent with senescence-associated increase in autofluorescence levels [39] (Figure 3B). However, the autofluorescence level was significantly reduced after M. officinalis treatment, suggesting that M. officinalis reduced intracellular lipofuscin levels (Figure 3B).
ROS cause DNA damage, which is known as a mediator of senescence, either directly affecting DNA or affecting proteins involved in DNA maintenance [49]. Since we observed M. officinalis extract–mediated ROS reduction, the effect of M. officinalis extract on DNA damage was evaluated. To identify the presence of DNA damage, DNA double–strand breaks (DSBs) was examined [50]. As expected, senescent fibroblasts treated with DMSO showed higher DNA DSBs than young fibroblasts [39, 51], whereas M. officinalis treated-senescent fibroblasts significantly diminished DNA DSBs in comparison to the DMSO control (Figure 3C).
An increase in cell surface area is a major characteristic associated with senescence [4]. Thus, morphological changes in senescent fibroblasts were analyzed after treatment with M. officinalis. DMSO–treated senescent fibroblasts exhibited a broad and flat morphology (dotted lines), while M. officinalis–treated senescent fibroblasts displayed a thin and spindly morphology (red arrows), a characteristic typically observed in young fibroblasts (Figure 3D). To objectively quantify the results in Figure 3D, we evaluated the forward scatter (FSC) levels of cells. Since FSC levels are proportional to cell diameter, they have been widely used to examine cell size [52]. Senescent fibroblasts treated with DMSO had significantly higher FSC levels than young fibroblasts, supporting the senescence-associated increase in cell surface area [4] (Supplementary Figure 1). In addition, senescent fibroblasts treated with M. officinalis had significantly decreased FSC levels compared to DMSO-treated senescent fibroblasts, confirming the results in Figure 3E that M. officinalis increased the proportion of thin and slender cell morphologies (Supplementary Figure 1).
M. officinalis extract enhances skin barrier function by increasing skin regeneration and suppressing skin inflammation
The skin is composed of the epidermis, the outer layer that mainly contains keratinocytes, and the dermis, the underlying layer that mainly contains connective tissue [53]. The skin is one of the areas where aging is most noticeable [54]. The finding that M. officinalis extract improves senescence–associated phenotypes prompted us to investigate whether M. officinalis extract might have any effect on skin protection.
Slit guidance ligand 2 (SLIT2) contributes to restoring skin tissue regeneration by regulating cell–cell interactions [55, 56]. Downregulation of SLIT2 expression impairs skin barrier function by reducing tissue regenerative capacity [55, 57]. To examine the role of M. officinalis extract on SLIT2 expression, M. officinalis extract was treated to senescent fibroblasts. Senescent fibroblasts treated with DMSO had significantly lower SLIT2 expression than young fibroblasts, but treatment with M. officinalis significantly increased SLIT2 expression in senescent fibroblasts, indicating that M. officinalis promotes skin regeneration (Figure 4A).
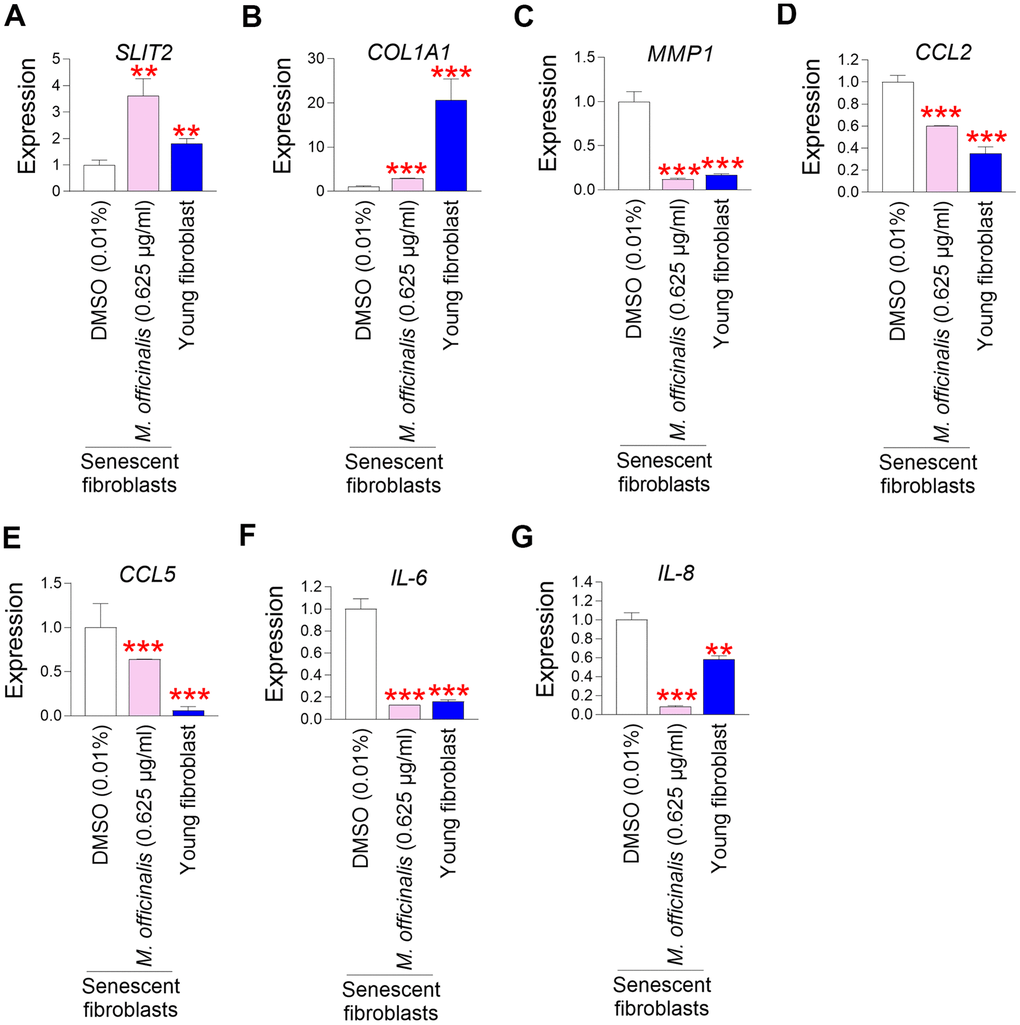
Figure 4. M. officinalis extract enhances skin barrier function by increasing skin regeneration and suppressing skin inflammation. (A) The expression levels of the SLIT2 in senescent fibroblasts were assessed after 12 days of treatment with DMSO (0.01%) or M. officinalis extract (0.625 μg/ml). Young fibroblasts were used as a positive control. **P < 0.01, Student’s t–test. Means ± S.D., N = 3. (B) The expression levels of the COL1A1 in senescent fibroblasts were assessed after 12 days of treatment with DMSO (0.01%) or M. officinalis extract (0.625 μg/ml). Young fibroblasts were used as a positive control. ***P < 0.001, Student’s t–test. Means ± S.D., N = 3. (C) The expression levels of the MMP1 in senescent fibroblasts were assessed after 12 days of treatment with DMSO (0.01%) or M. officinalis extract (0.625 μg/ml). Young fibroblasts were used as a positive control. ***P < 0.001, Student’s t–test. Means ± S.D., N = 3. (D) The expression levels of the CCL2 in senescent fibroblasts were assessed after 12 days of treatment with DMSO (0.01%) or M. officinalis extract (0.625 μg/ml). Young fibroblasts were used as a positive control. ***P < 0.001, Student’s t–test. Means ± S.D., N = 3. (E) The expression levels of the CCL5 in senescent fibroblasts were assessed after 12 days of treatment with DMSO (0.01%) or M. officinalis extract (0.625 μg/ml). Young fibroblasts were used as a positive control. ***P < 0.001, Student’s t–test. Means ± S.D., N = 3. (F) The expression levels of the IL–6 in senescent fibroblasts were assessed after 12 days of treatment with DMSO (0.01%) or M. officinalis extract (0.625 μg/ml). Young fibroblasts were used as a positive control. ***P < 0.001, Student’s t–test. Means ± S.D., N = 3. (G) The expression levels of the IL–8 in senescent fibroblasts were assessed after 12 days of treatment with DMSO (0.01%) or M. officinalis extract (0.625 μg/ml). **P < 0.01, Student’s t–test. Mean ± S.D., N = 3. Young fibroblasts were used as a positive control. **P < 0.01, ***P < 0.001, Student’s t–test. Means ± S.D., N = 3.
A distinguishing feature of skin aging is a decrease in collagen protein synthesis, which causes the skin to lose structural support and its barrier function to decline [58]. To determine the effect of M. officinalis extract on collagen production, the expression level of type I collagen alpha 1 (COL1A1) was analyzed. Senescent fibroblasts treated with DMSO had significantly lower COL1A1 expression than young fibroblasts, but treatment with M. officinalis significantly increased COL1A1 expression in senescent fibroblasts, indicating that M. officinalis enhances structural support (Figure 4B).
Skin barrier function is deteriorated by an increase in matrix metalloprotease 1 (MMP1) expression, which promotes collagen degradation [59]. The discovery that M. officinalis extract enhanced collagen production led us to examine its impact on MMP1 expression. Senescent fibroblasts treated with DMSO had significantly higher MMP1 expression than young fibroblasts, but treatment with M. officinalis significantly decreased MMP1 expression in senescent fibroblasts, indicating that M. officinalis prevents collagen degradation (Figure 4C).
Skin inflammation is a primary contributor to compromised skin barrier function, as it facilitates collagen degradation and diminishes regenerative capacity [60]. C–C motif chemokine ligands (CCL) induce skin inflammation by recruiting various leukocytes to the skin [61, 62]. The impact of M. officinalis extract on CCL expression was assessed by examining the expression of CCL2 and CCL5. Senescent fibroblasts treated with DMSO had significantly higher expression of CCL2 and CCL5 than young fibroblasts, but treatment with M. officinalis significantly reduced the expression of CCL2 and CCL5 in senescent fibroblasts, indicating that M. officinalis extract reduces skin inflammation (Figure 4D, 4E).
The skin, which acts as an immune organ, activates the activity of cytokines, including interleukin, in response to attacks by various pathogens. Interleukin–6 (IL–6) is synthesized in reaction to the infiltration of inflammatory cells in many skin areas, including fibroblasts, epidermal cells, and dermal endothelial cells [63]. IL–8 is an inflammatory mediator that significantly contributes to skin inflammation [64]. To determine the role of M. officinalis extract on interleukin expression, the expression of IL-6 and IL-8 was investigated. Senescent fibroblasts treated with DMSO had significantly higher expression of IL-6 and IL-8 than young fibroblasts (Figure 4F, 4G). However, treatment with M. officinalis significantly decreased the expression of IL-6 and IL-8 in senescent fibroblasts, suggesting that M. officinalis extract lowers the expression of inflammatory cytokines (Figure 4F, 4G).
M. officinalis extract reverses skin aging by suppressing skin pigmentation and maintaining skin moisture
Skin pigmentation is a hallmark of aging and results from the accumulation of melanosomes, organelles that contain melanin, the pigment responsible for skin color, within keratinocytes [65]. Protease–activated receptor–2 (PAR–2) has an important function in skin pigmentation by transporting melanosomes from melanocytes to keratinocytes [66]. Overactivation of PAR–2 can lead to increased melanosome transport, which can cause hyperpigmentation [66]. To examine the effect of M. officinalis extract on skin pigmentation, the mRNA and protein expression of PAR–2, were evaluated. HaCaT cells were irradiated with ultraviolet B (UVB), which stimulates melanosome production [67]. Niacinamide, recognized for its ability to reduce PAR–2 expression, served as a positive control [68]. Irradiation of HaCaT cells by UVB significantly upregulated the mRNA and protein expression of PAR–2 (Figure 5A, 5B). However, niacinamide treatment significantly decreased the mRNA and protein expression of PAR–2 (Figure 5A, 5B). Furthermore, the mRNA expression levels of PAR–2 were significantly downregulated by M. officinalis at 0.625, 1.25, and 2.5 μg/ml, and the protein expression levels of PAR–2 were significantly downregulated by M. officinalis at 1.25 and 2.5 μg/ml (Figure 5A, Figure 15B). These results suggest that downregulation of PAR–2 expression by M. officinalis may reduce skin pigmentation.
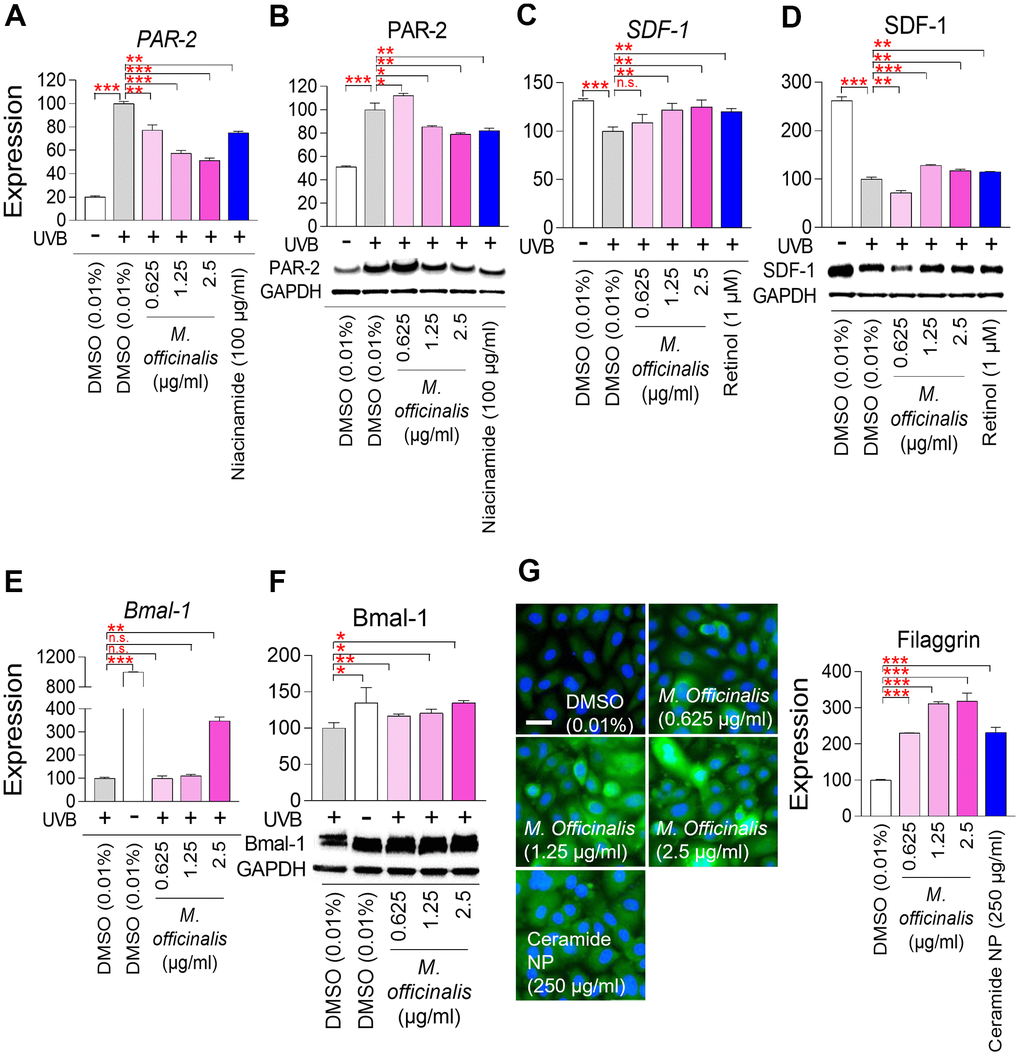
Figure 5. M. officinalis extract reverses skin aging by suppressing skin pigmentation, increasing skin turnover, and maintaining skin moisture. (A, B) Measurement of melanosome transport. To stimulate melanosome production, HaCaT cells were exposed to 30 mJ/cm2 ultraviolet B (UVB). Then, HaCaT cells were treated with DMSO (0.01%) or M. officinalis extract (0.625, 1.25, and 2.5 μg/ml) for 8 h. As a positive control, 100 μg/ml niacinamide was used. PAR–2 expression was analyzed by qPCR (A) and Western blot (B). *P < 0.05, **P < 0.01, ***P < 0.001, Student’s t–test. Mean ± S.D., N = 3. (C, D) Measurement of skin pigmentation. To induce skin pigmentation, HaCaT cells were exposed to 15 J/cm2 UVB. Then, HaCaT cells were treated with DMSO (0.01%) or M. officinalis extract (0.625, 1.25, and 2.5 μg/ml) for 24 h. As a positive control, 1 μM retinol (R7632; Sigma) was used. SDF–1 expression was analyzed by qPCR (C) and Western blot (D). n.s. (not significant), **P < 0.01, ***P < 0.001, Student’s t–test. Mean ± S.D., N = 3. (E, F) Measurement of skin turnover. To disrupt skin turnover, HaCaT cells were exposed to 30 mJ/cm2 UVB. Then, HaCaT cells were treated with DMSO (0.01%) or M. officinalis extract (0.625, 1.25, and 2.5 μg/ml) for 24 h. Bmal–1expression was analyzed by qPCR (E) and Western blot (F). n.s. (not significant), *P < 0.05, **P < 0.01, ***P < 0.001, Student’s t–test. Mean ± S.D., N = 3. (G) Measurement of skin moisture retention. Normal human epidermal keratinocytes, HEKn cells, were treated with DMSO (0.01%) or M. officinalis extract (0.625, 1.25, and 2.5 μg/ml) for 72 h. As a positive control, 250 μg/ml ceramide NP was used. Expression of filaggrin protein was examined using immunocytochemistry (blue: dapi, green: filaggrin). Image J analysis was performed to quantify the fluorescence intensity of filaggrin protein. ***P < 0.001, Student’s t–test. Mean ± S.D., N = 3. The scale bar is 100 μm.
Stromal cell–derived factor 1 (SDF–1) reduces skin pigmentation by inhibiting the cAMP signaling pathway in melanocytes [69]. To further investigate the role of M. officinalis extract on skin pigmentation, the mRNA and protein expression of SDF–1, were analyzed after UVB irradiation of HaCaT cells. Retinol, recognized for its ability to restore SDF–1 expression, served as a positive control [68]. Irradiation of HaCaT cells by UVB significantly increased the mRNA and protein expression of SDF–1 (Figure 5C, Figure 5D). However, retinol treatment significantly decreased the mRNA and protein expression of SDF–1 (Figure 5C, Figure 5D). Furthermore, the mRNA and protein expression levels of SDF–1 were significantly decreased by M. officinalis at 1.25 and 2.5 μg/ml (Figure 5C, Figure 5D). These results indicate that upregulation of SDF–1 expression by M. officinalis may reduce skin pigmentation.
Brain and muscle ARNT–like 1 (Bmal–1) are essential for sustaining youthful and healthy skin by regulating cell proliferation and differentiation, therefore enhancing skin turnover [70]. To examine the role of M. officinalis extract on skin turnover, the mRNA and protein expression of Bmal–1, were analyzed after UVB irradiation of HaCaT cells. Irradiation of HaCaT cells by UVB significantly decreased the mRNA and protein expression of Bmal–1 (Figure 5E, Figure 5F). However, the mRNA and protein expression levels of Bmal–1 were significantly increased by M. officinalis at 2.5 μg/ml (Figure 5E, Figure 5F). These results suggest that the activation of Bmal–1 expression by M. officinalis promote skin turnover.
Filaggrin is a protein synthesized in keratinocytes and serves as a key component of the outermost layer of the skin, playing an essential function in maintaining skin hydration [71]. Skin hydration indicates the water content of the stratum corneum of the epidermis, and can be indirectly measured by measuring filaggrin expression [72]. HEKn cells are human epidermal keratinocytes and are closer to the stratum corneum than HaCaT cells, which are keratinocytes [73]. Consequently, the study of skin hydration has made extensive use of HEKn cells [74, 75]. Therefore, to examine the function of M. officinalis extract on skin hydration, HEKn cells were treated with M. officinalis extract and the changes in filaggrin protein expression were examined using immunocytochemistry. Ceramide–NP, which is well known to increase filaggrin expression, was used as a positive control [76]. As anticipated, ceramide NP significantly increased the level of filaggrin expression (Figure 5G). In HEKn cells treated with M. officinalis, a significant increase in filaggrin expression was observed at all concentrations (0.625, 1.25, and 2.5 μg/ml) compared to the DMSO control. These results suggest that the activation of filaggrin expression by M. officinalis promote skin hydration.
Identification of honokiol as a core ingredient showing antioxidant effects
After discovering that M. officinalis extract is effective in protecting skin and reversing skin aging, we decided to investigate which components present in M. officinalis extract are responsible for these effects. Previous studies have found that the major components of M. officinalis are honokiol and magnolol [77]. Honokiol, classified as a lignan, contains natural phenolic cytotoxic compounds that serve as oxygen radical scavengers through redox reactions [78]. Magnolol, classified as a lignan, has antioxidant and antibacterial effects by interfering with NF–κB signaling [79]. To identify core ingredients that have antioxidant properties, senescent fibroblasts were subjected to treatment with varying concentrations of honokiol and magnolol. Subsequently, their impact on ROS levels was assessed using DHR123. The extract of M. officinalis extract served as a positive control. Not significantly reducing mitochondrial ROS levels was observed at a 0.1 μM honokiol, whereas significantly reducing ROS levels were observed at 1 and 10 μM (Figure 6A). Moreover, compared to M. officinalis extract, honokiol at 1 and 10 μM was more effective in lowering mitochondrial ROS levels (Figure 6A). However, magnolol at 0.1 μM significantly increased mitochondrial ROS levels compared to DMSO control (Figure 6B). Significant reducing mitochondrial ROS levels were observed at 1 and 10 μM magnolol, whereas magnolol at those concentrations was not more effective in lowering mitochondrial ROS levels than M. officinalis extract (Figure 6B). Based on these data, honokiol is the key substance exhibiting antioxidant properties among various components of M. officinalis extract. The least honokiol concentration that was more efficient than M. officinalis extract was chosen as the optimal concentration for the further studies, which was 1 μM.
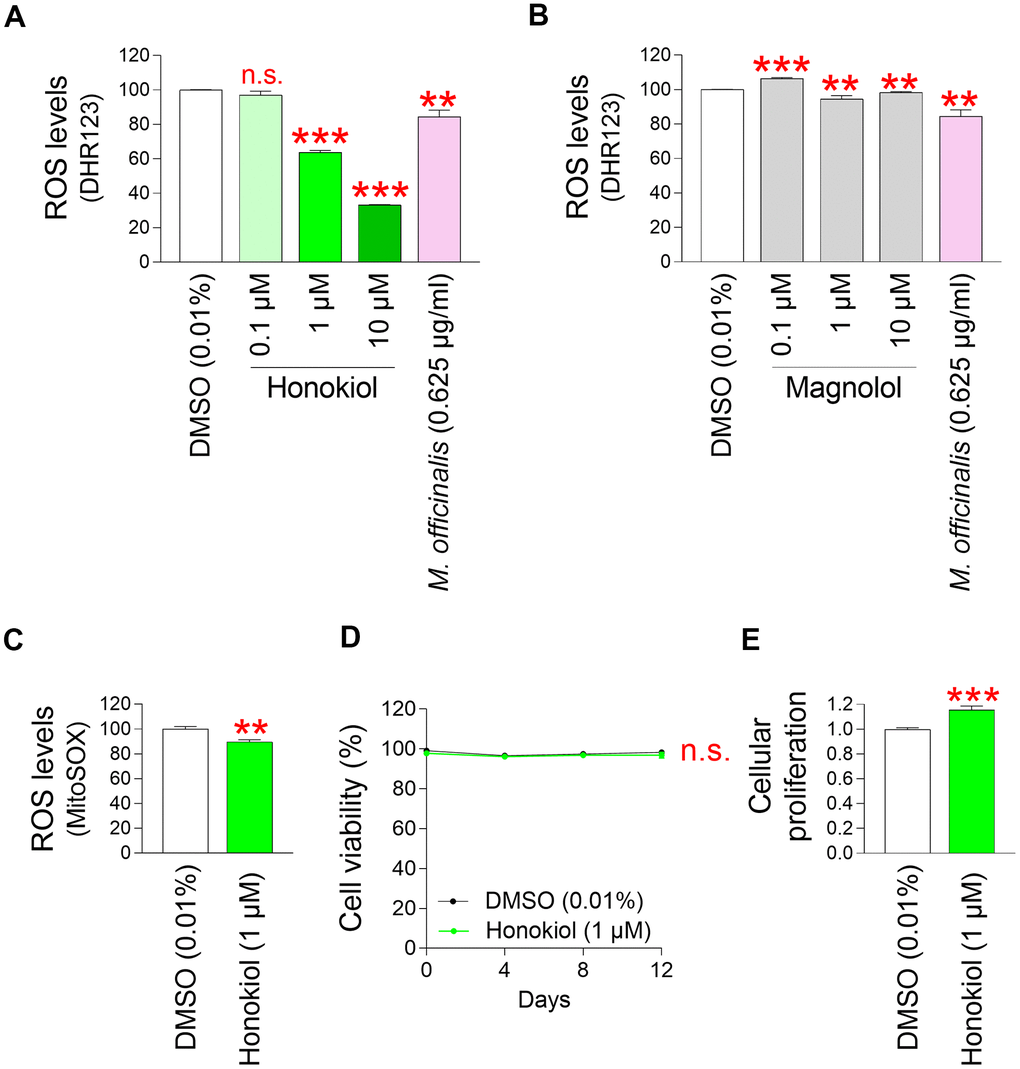
Figure 6. Identification of honokiol as a core ingredient showing antioxidant effects. (A) Senescent fibroblasts were treated with DMSO (0.01%) or honokiol (0.1, 1, and 10 μM) for 12 days. Use of DHR123 for flow cytometric analysis of mitochondrial ROS levels. The extract of M. officinalis extract (0.625 μg/ml) served as a positive control. Honokiol at 1 and 10 μM was more effective in reducing ROS levels than M. officinalis extract. n.s. (not significant), **P < 0.01, ***P < 0.001, Student’s t–test. Mean ± S.D., N = 3. (B) Senescent fibroblasts were treated with DMSO (0.01%) or magnolol (0.1, 1, and 10 μM) for 12 days. Use of DHR123 for flow cytometric analysis of mitochondrial ROS levels. The extract of M. officinalis extract (0.625 μg/ml) served as a positive control. Magnolol at 1 and 10 μM was not more effective in reducing ROS levels than M. officinalis extract. n.s. (not significant), ***P < 0.001, **P < 0.01, Student’s t–test. Mean ± S.D., N = 3. (C) Senescent fibroblasts were treated with DMSO (0.01%) or honokiol (1 μM). Measurement of cell viability after 0, 4, 8, and 12 days of treatment. n.s. (not significant), two–way ANOVA followed by Bonferroni’s post–hoc test. Mean ± S.D., N = 3. (D) Cellular proliferation was evaluated at DMSO (0.01%) or honokiol (1 μM) on day 12 after treatment in senescent fibroblasts. ***P < 0.001, Student’s t–test. Mean ± S.D., N = 3. (E) Senescent fibroblasts were treated with DMSO (0.01%) or honokiol (1 μM) for 12 days. Use of MitoSOX for flow cytometric analysis of mitochondrial ROS levels. **P < 0.01, Student's t–test. Mean ± S.D., N = 3.
Then, the ROS-reducing effect of honokiol was re-examined using MitoSox. Senescent fibroblasts treated with honokiol showed significantly lowered mitochondrial ROS levels compared to senescent fibroblasts treated with DMSO (Figure 6C).
Next, we investigated the toxicity of 1 μM honokiol by investigating cell viability. The cell viability of senescent fibroblasts treated with 1 μM honokiol was comparable to that of senescent fibroblasts treated with DMSO, suggesting that honokiol was non–toxic to the cells at selected concentration (Figure 6D).
Finally, we performed a cell proliferation assay to confirm the senescence ameliorating effect of honokiol. Senescent fibroblasts treated with honokiol exhibited a cell proliferation-induction effect similar to that of M. officinalis extract (Figure 6E).
Honokiol reduces mitochondrial ROS generation through mitochondrial functional recovery
We found that M. officinalis extract reduced mitochondrial ROS production by restoring mitochondrial function. Therefore, we investigated whether honokiol, the main component of this extract, also had the same effect.
The finding that honokiol reduces mitochondrial ROS levels in senescent fibroblasts conjectured us to investigate the effects of honokiol on MMP. Senescent fibroblasts treated with honokiol exhibited a significant rise in MMP relative to those treated with DMSO (Figure 7A). The rise in MMP by honokiol led to a measurement of mitochondrial mass. Honokiol-treated senescent fibroblasts exhibited a decrease in mitochondrial mass relative to the DMSO control (Figure 7B). These results support honokiol–mediated restoration of mitochondrial function.
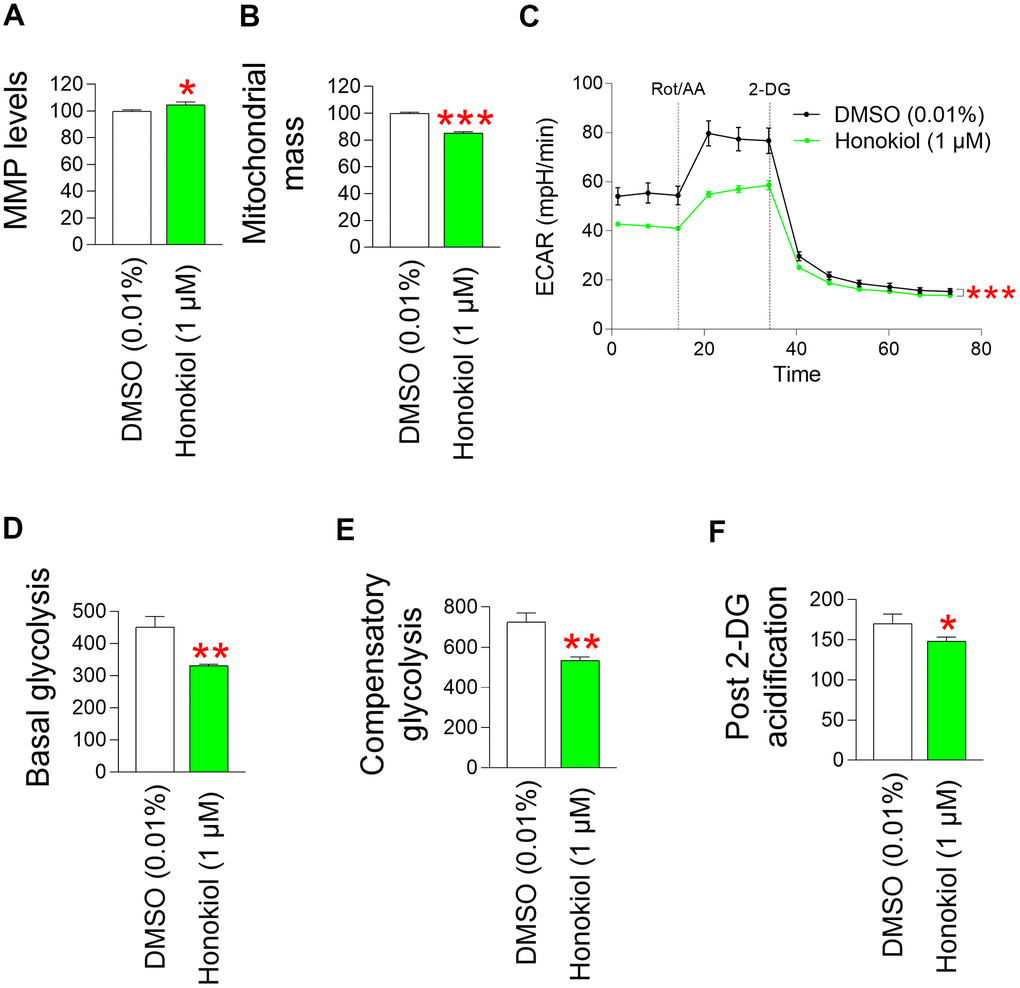
Figure 7. Honokiol reduces mitochondrial ROS generation through mitochondrial functional recovery. (A) Use of JC–10 for flow cytometric measurement of MMP. Senescent fibroblasts were treated with DMSO (0.01%) or honokiol (1 μM) for 12 days. *P < 0.05, Student's t–test. Mean ± S.D., N = 3. (B) MitoTracker green was employed for a flow cytometric study of mitochondrial mass. Senescent fibroblasts were treated with DMSO (0.01%) or honokiol (1 μM) for 12 days. ***P < 0.001, Student t–test. Mean ± S.D., N = 3. (C) Measurement of extracellular acidification rate (ECAR; mpH/min) after 12 days of treatment with DMSO (0.01%) or 1 μM honokiol. (black line: DMSO–treated senescent fibroblasts, pink line: honokiol–treated senescent fibroblasts). ***P < 0.001, two–way ANOVA followed by Bonferroni’s post–hoc test. Means ± S.D., N = 3. (D) Basal glycolysis was measured after 12 days of treatment with DMSO (0.01%) or honokiol (1 μM). **P < 0.01, student t–test. Mean ± S.D., N = 3. (E) The compensatory glycolysis was measured after 12 days of treatment with DMSO (0.01%) or honokiol (1 μM). **P < 0.01, Student t–test. Mean ± S.D., N = 3. (F) Post–2–DG acidification was measured after 12 days of treatment with DMSO (0.01%) or honokiol (1 μM). *P < 0.05, Student t–test. Mean ± S.D., N = 3.
Since M. officinalis extract reduced dependence on glycolysis as a cellular energy source, we investigated whether honokiol also reduced the dependence. Senescent fibroblasts treated with honokiol had lower ECAR values than DMSO–treated fibroblasts, suggesting a lower rate of glycolysis in honokiol–treated fibroblasts (Figure 7C). Specifically, senescent fibroblasts treated with honokiol had lower basal levels of glycolysis than DMSO controls, suggesting that honokiol reduced the rate at which glucose was converted to lactate (Figure 7D). Inhibition of oxidative phosphorylation and induction of a compensatory shift toward glycolysis resulted in lower compensatory glycolysis in honokiol–treated senescent fibroblasts compared to the DMSO control, suggesting that honokiol–treated senescent fibroblasts rely less on glycolysis to meet their energy requirements (Figure 7E). Addition of 2–DG reduced the post 2–DG acidification in honokiol–treated senescent fibroblasts compared to the DMSO control, suggesting that honokiol–treated senescent fibroblasts have lower residual glycolysis that is not completely blocked by 2–DG (Figure 7F). These results suggest that honokiol, similar to M. officinalis, reduced the dependence of glycolysis as an energy source, indicating restoration of mitochondrial function by honokiol.
In summary, our findings suggest that a reduction in ROS levels attributed to M. officinalis extract is a consequence of diminished mitochondrial ROS production, facilitated by honokiol–mediated mitochondrial functional recovery.
Honokiol ameliorates senescence–associated phenotypes and enhances skin barrier function
The confirmation of mitochondrial functional recovery by honokiol prompted us to investigate the effects of honokiol on senescence–associated phenotypes. Treatment of senescent fibroblasts with honokiol significantly reduced the SA–β–gal positive cells (%) in comparison to the DMSO control (Figure 8A). In addition, autofluorescence was significantly reduced after honokiol treatment, suggesting that honokiol reduced intracellular lipofuscin levels (Figure 8B).
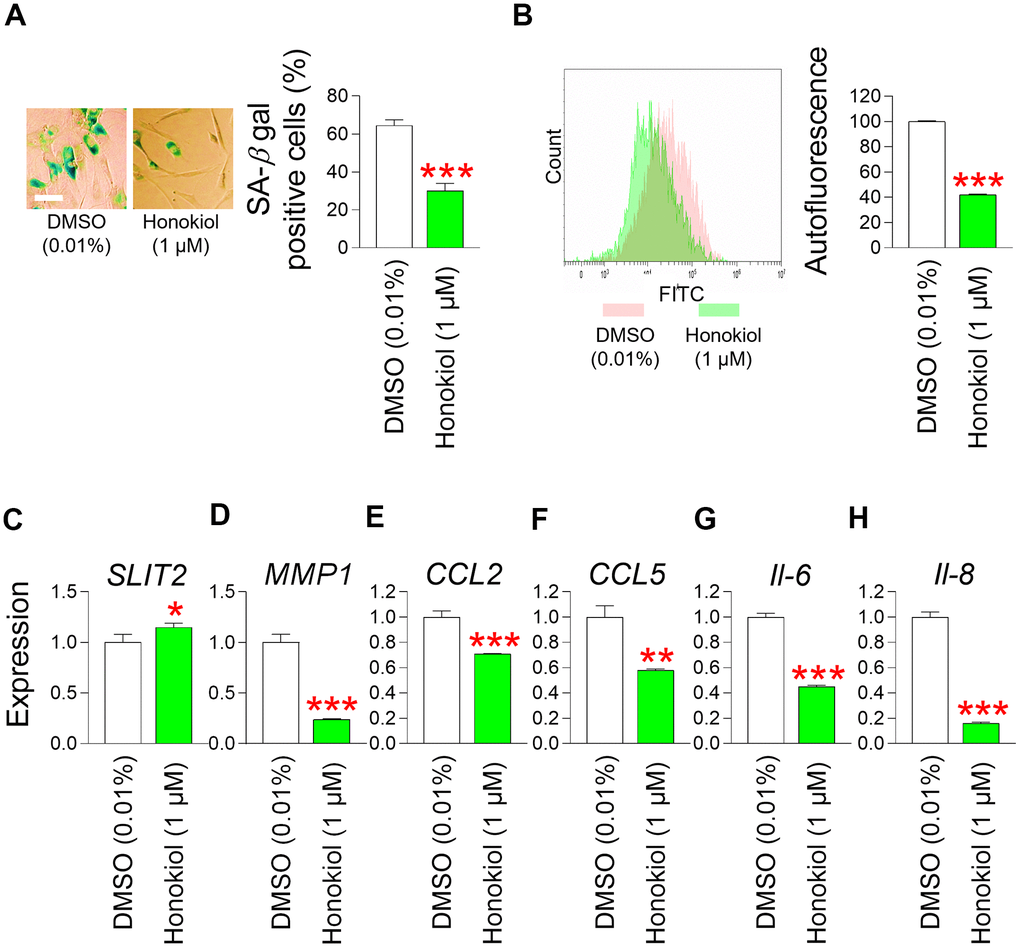
Figure 8. Honokiol ameliorates senescence–associated phenotypes and enhances skin barrier function. (A) Measurement of SA–β–gal positive cells (%). Senescent fibroblasts were treated with DMSO (0.01%) or honokiol (1 μM) for 12 days. ***P < 0.001, Student t–test. Mean ± S.D., N = 3. Scale bar 20 μm. (B) After 12 days of treatment with DMSO (0.01%) or honokiol (1 μM), autofluorescence was assessed in senescent fibroblasts by flow cytometry. The representative histogram of autofluorescence was shown. ***P < 0.001, Student t–test. Mean ± S.D., N = 3. (C) The expression levels of the SLIT2 in senescent fibroblasts were assessed after 12 days of treatment with DMSO (0.01%) or honokiol (1 μM). *P < 0.05, Student t–test. Mean ± S.D., N = 3. (D) The expression levels of the MMP1 in senescent fibroblasts were assessed after 12 days of treatment with DMSO (0.01%) or honokiol (1 μM). ***P < 0.001, Student t–test. Mean ± S.D., N = 3. (E) The expression levels of the CCL2 in senescent fibroblasts were assessed after 12 days of treatment with DMSO (0.01%) or honokiol (1 μM). ***P < 0.001, Student t–test. Mean ± S.D., N = 3. (F) The expression levels of the CCL5 in senescent fibroblasts were assessed after 12 days of treatment with DMSO (0.01%) or honokiol (1 μM). **P < 0.01, Student t–test. Mean ± S.D., N = 3. (G) The expression levels of the IL–6 in senescent fibroblasts were assessed after 12 days of treatment with DMSO (0.01%) or honokiol (1 μM). ***P < 0.001, Student t–test. Mean ± S.D., N = 3. (H) The expression levels of the IL–8 in senescent fibroblasts were assessed after 12 days of treatment with DMSO (0.01%) or honokiol (1 μM). ***P < 0.01, Student t–test. Mean ± S.D., N = 3.
These data indicate that honokiol improves senescence–associated phenotypes.
The discovery that honokiol enhances senescence–associated phenotypes prompted us to explore whether honokiol, similar to M. officinalis extract, could contribute to the restoration of skin barrier function. Initially, we examined the influence of honokiol on SLIT2 expression, which is crucial for restoring skin barrier function through the enhancement of skin regeneration. Honokiol significantly increased SLIT2 expression compared to the DMSO control, indicating honokiol–mediated enhancement of skin regeneration (Figure 8C). We then investigated the effect of honokiol on MMP1, which impairs skin barrier function. Honokiol significantly decreased MMP1 expression, indicating that honokiol maintains skin barrier function by inhibiting the expression of MMP1, which promotes collagen degradation (Figure 8D). Ultimately, we examined the impact of honokiol on skin inflammation, an important contributor to compromised skin barrier function. In senescent fibroblasts treated with honokiol, the expression of CCL2 and CCL5 was significantly decreased comparison to the DMSO control, indicating that honokiol reduced skin inflammation (Figure 8E, Figure 8F). Moreover, the expression levels of IL–6 and IL–8 were significantly lowered by honokiol in comparison to the DMSO control, suggesting that honokiol mitigates skin inflammation by reducing the expression of cytokines associated with inflammation (Figure 8G, Figure 8H).
Discussion
Damage to organelles induced by oxidative stress is closely related to the progression of senescence [80]. The major organelle generating ROS in cells is mitochondria [81]. The ETC complex in mitochondria converts 1%-5% of the oxygen consumed by mitochondria into O2●− [19]. Specifically, in the mitochondrial matrix, complexes I and III transform oxygen into O2●−. Complex III in the intermembrane space of the mitochondria also produces O2●−. The activities of complexes in the ETC are diminished as a result of mitochondrial dysfunction caused by senescence [82, 83]. In particular, the lower activity of complex I, prevents it from performing effective electron transport, which leads to an increase in electron leakage to oxygen. This, in turn, increases the formation of O2●− [84]. Enhanced ROS production in mitochondria exacerbates damage to the ETC, resulting in increased mitochondrial ROS generation [5]. The structure and function of organelles deteriorate as a consequence of this harmful cycle, which ultimately leads to senescence [85]. This causal linkage emphasizes that reducing mitochondrial ROS production is a crucial strategy to reverse senescence [5]. Here, we identified a unique mechanism by which M. officinalis reduces mitochondrial ROS generation through restoring mitochondrial function. Increased MMP by M. officinalis extract demonstrates increased proton transport, suggesting the active electron transport within the ETC [86]. Efficient electron transport reduces electron leak in the ETC, thereby reducing the production of by–product ROS [87]. Moreover, we observed that M. officinalis extract diminished dependence on glycolysis as an intracellular energy source, indirectly suggesting that M. officinalis extract recovers mitochondrial function as an energy generation. Furthermore, restoration of mitochondrial function via M. officinalis extract was accompanied by recovery of senescence-associated phenotypes [88, 89]. Here, we propose that reducing ROS generation in mitochondria using M. officinalis extract may be a first step toward a treatment for aging.
Oxidative stress induced by ROS is a primary contributor to skin aging [90]. ROS damages collagen that constitutes the dermis and destroys the structural stability of the subcutaneous tissue [91]. ROS also damage cell structure by modifying the phospholipids and proteins that make up cell membranes [92]. The adverse effects of ROS on skin aging can be aggravated by the property that ROS are unstable with unpaired electrons, which steals electrons from surrounding molecules and causes oxidative chain reactions in surrounding tissues. The adverse effects of ROS on skin aging can be exacerbated by the unstable nature of ROS, which has an unpaired electron [84]. This allows them to steal electrons from surrounding molecules, causing an oxidative chain reaction in surrounding tissues [84]. Thus, ROS damages large areas of the skin and further aggravates skin aging [80]. In this study, we elucidated the mechanism by which M. officinalis extract and its active ingredient, honokiol, reduce mitochondrial ROS generation. Specifically, we found that M. officinalis extract restores skin barrier formation by increasing skin regeneration and suppressing skin inflammation. Upregulation of genes involved in skin regeneration and downregulation of genes involved in collagen degradation indicated that M. officinalis extract restored the skin barrier function. Downregulation of genes involved in skin inflammation indicated that M. officinalis extract inhibit skin inflammation. M. officinalis extract also reversed skin aging by inhibiting skin pigmentation, increasing skin regeneration, and maintaining skin moisture. As far as we are aware, our research offers the first proof that M. officinalis and honokiol restore skin aging though reducing mitochondrial ROS generation. We propose that M. officinalis extract or honokiol alone may be effective in delaying or stopping skin aging, but further studies are needed to verify this suggestion.
Natural products are widely used in medicines, cosmetics, and health supplements because their side effects on the human body are minimized [93]. Since natural products are composed of various ingredients, it is important to identify the active ingredients. Finding active ingredients in natural products can help reduce the use of harmful or unnecessary additives [94]. Moreover, the composition of natural products may alter as a result of climate or farming area changes [95]. The effectiveness of products using natural products may also be affected by changes in the content [93, 96]. In this study, we investigated the components showing antioxidant activity among the known active ingredients of M. officinalis, honokiol and magnolol. Honokiol and magnolol are polyphenol compounds belonging to the lignan family [97]. Honokiol has a 5,5’-diallyl-2,2’-biphenol configuration and contains a biphenyl structure with two phenol rings connected by an allylic group attached to each ring [98]. Similarly, magnolol has an isomeric configuration featuring two phenol rings linked by a 5,5’-diallyl-2,2’-biphenol framework [99]. Phenolic compounds exhibit antioxidant properties through their hydroxyl groups [100, 101]. Specifically, the hydroxyl group of the phenol moiety exerts its antioxidant activity by acting as a singlet oxygen scavenger through redox reactions [102]. In this study, honokiol significantly reduced ROS levels in senescent fibroblasts at concentrations of 1 μM and 10 μM, and more than M. officinalis. However, magnolol reduced ROS levels at concentrations of 1 μM and 10 μM, but not more than M. officinalis. This difference is attributed to the structural differences between honokiol and magnolol [103]. The di-ortho-hydroxyl group of magnolol prevents the donation of hydrogen atoms to radicals by forming intramolecular hydrogen bonds [104]. In addition, magnolol has two hydroxyl groups at the -ortho position, whereas honokiol has an asymmetric structure with one hydroxyl group at the -ortho and -para positions, respectively [105]. This asymmetry of honokiol leads to an uneven electron distribution, making it prone to donating hydrogen atoms to ROS [106]. These structural characteristics support the conclusion that honokiol reduces ROS levels more efficiently in senescent fibroblasts. Furthermore, honokiol alone significantly reduced ROS levels in senescent fibroblasts compared to M. officinalis extract, indicating that honokiol is the most potent antioxidant among the components of M. officinalis extract.
In this study, magnolol was not selected as the main antioxidant component of M. officinalis extract because it was not as effective as honokiol in reducing mitochondrial ROS in senescent fibroblasts. However, another study reported the antioxidant effect of magnolol in nematodes [107]. Specifically, magnolol improved stress resistance to hydrogen peroxide, paraquat, and potassium mercury chloride in nematodes. The improved stress resistance led to a decrease in ROS in nematodes. The difference in the ROS-reducing effect of magnolol in senescent fibroblasts and nematodes may be due to the different levels of ROS depending on the level of aging. The ROS level of senescent fibroblasts was more than 10 times higher than that of young fibroblasts (Figure 1A). The ROS level of aged nematodes was also higher than that of juvenile nematodes [108]. This study used senescent fibroblasts with high ROS levels, whereas the nematodes used in the lifespan study were juvenile [107]. Therefore, the ROS-reducing effect of magnolol may have been more evident in young nematodes with relatively low ROS levels, but may not have been evident in senescent fibroblasts with high ROS levels. However, we acknowledge that further experiments are needed to verify this hypothesis.
Although there are previous studies on the antioxidant effects of M. officinalis extract, our study has some differences and advantages. First, other studies have demonstrated that M. officinalis reduces ROS levels using cells from colon adenocarcinoma, primary cells, squamous cell carcinoma, and normal gastric mucosa [109–112]. However, the effect of M. officinalis on reducing ROS levels in senescent fibroblasts has not been investigated. Our study is the first to confirm the effect of M. officinalis on reducing ROS in senescent fibroblasts. Second, our study made a novel finding that M. officinalis reduces mitochondrial ROS generation. To evaluate mitochondrial ROS levels, DHR123 and MitoSOX were used. Rhodamine 123, a dye that passively diffuses across cell membranes and selectively stains mitochondria, is reduced to form DHR123 [20]. Thus, DHR123 reacts with ROS in mitochondria and is oxidized to cationic rhodamine 123 [21]. Moreover, the lipophilic and positively charged TPP+ present in MitoSOX passes through the membrane and accumulates in the negatively charged mitochondrial matrix, where the dihydroethidium bound to TPP+ reacts with O2●− present in the mitochondrial matrix [22]. However, other studies have used 2′,7′-dichlorofluorescein diacetate (DCF-DA) [109, 112], expression of inducible nitric oxide synthase (iNOS) [110] or Seahorse metabolic analysis [111]. DCF-DA can detect hydrogen peroxide, a type of ROS in the cytoplasm, because they are oxidized by hydrogen peroxide present in the cytoplasm, but they cannot specifically detect mitochondrial ROS generation [113, 114]. Moreover, iNOS is considered a pro-inflammatory marker and is not a direct method to measure ROS levels [115]. Furthermore, seahorse metabolic analysis is not a direct method for measuring ROS levels, but rather measures oxygen consumption and extracellular acidification rates [116]. Therefore, our study is the first to identify the effect of M. officinalis on reducing mitochondrial ROS generation in senescent fibroblasts.
In conclusion, we discovered that M. officinalis extract reduced ROS levels through mitochondrial functional recovery. Reduction in ROS levels by M. officinalis extract improved senescence-associated phenotypes and skin aging. In addition, honokiol, one of the components of M. officinalis extract, was found to be an effective substance with antioxidant activity. Honokiol also restored mitochondrial function, reducing ROS levels and alleviating aging-related phenotypes. Our findings reveal a unique mechanism by which M. officinalis extract reverses senescence. If further research is conducted to apply the new mechanism discovered in this study to clinical or cosmetic applications, it will be a turning point in the development of anti-aging treatments and cosmetics.
Materials and Methods
Cell culture
All human cell line studies were reviewed and approved by the Animal Care and Use Committee of Incheon National University (protocol number: 20230115001). Immortalized human keratinocytes (HaCaT; 300493; Cytion, Eppelheim, Germany), human dermal fibroblasts (PCS–201–010; ATCC, Manassas, VA, USA), and normal human epidermal keratinocytes (HEKn; C0055C; Gibco, Grand Island, NY, USA) were employed. Each cell was cultured under specific media and culture conditions according to the procedures of previous studies [117]. Human dermal fibroblasts were classified into senescent and young fibroblasts based on their doubling time. Senescent fibroblasts were determined to have a doubling time of 14 days, while young fibroblasts were determined to have a doubling time of less than 2 days.
Preparation of extract powder
The bark of M. officinalis (Pure Mind, Yeongcheon, Republic of Korea) was mixed with 70% ethanol in a volume ratio of 1:8 and heated at 60° C for 3 h. The roots of Polygonum odoratum (Hadong Agricultural Cooperative, Hadong, Republic of Korea) were mixed with 30% ethanol in a volume ratio of 1:10 and heated at 25° C for 3 h. The roots of Magnolia Liliiflora (M. Liliiflora) (Herb Village Co., Ltd., Cheongju, Republic of Korea) were mixed with deionized water in a volume ratio of 1:25 and heated at 60° C for 6 h. The roots of Passiflora caerulea (P. caerulea) (Jeju Plant Resource Research Institute, Jeju, Republic of Korea) were mixed with 70% ethanol in a volume ratio of 1:10 and heated at 60° C for 3 h. The extract powder was prepared according to the method used in a previous study [117]. Each extract was diluted with dimethyl sulfoxide (DMSO, D8418; Sigma, St. Louis, MO, USA) to a concentration of 100 mg/ml. 1 μl of 100 mg/ml extract was combined with 10 ml of medium to create a concentration of 10 μg/ml extract. By diluting DMSO in the medium to a concentration of 0.01%, DMSO control was employed. In particular, for DMSO control, 10 ml of medium was mixed with 1 μl of DMSO.
Flow cytometric analysis of reactive oxygen species (ROS)
Senescent fibroblasts were treated with DMSO (0.01%), M. officinalis (10 μg/ml), P. odoratum (10 μg/ml), M. Liliiflora (10 μg/ml), or P. caerulea extract (10 μg/ml) for 12 days. As a positive control, 100 μM resveratrol (76511; Sigma) and young fibroblasts were used. Then, flow cytometric analysis of ROS was performed as in our previous study [117].
Cellular proliferation assay
In 96-well plates (353072; BD Biosciences, Franklin Lakes, NJ, USA), senescent fibroblasts were seeded at a density of 1 × 10³ cells per well. Senescent fibroblasts were then treated with DMSO (0.01%) or M. officinalis extract (0.625, 1.25, 2.5, 5, or 10 μg/ml) for 12 days. Cell proliferation was calculated using a DNA content assay following the procedure of the previous study [117].
Measurement of cell viability
Cell viability was measured once every 4 days for 12 days by the Cedex HiRes Analyzer (05650216001; Roche, Basel, Switzerland).
Flow cytometric analysis of mitochondrial membrane potential (MMP), mitochondrial mass and autofluorescence
For 12 days, DMSO (0.01%) or M. officinalis extract (0.625 μg/ml) were used to treat senescent fibroblasts. Then, to evaluate MMP, senescent fibroblasts were incubated for 30 min at 37° C in medium with 0.6 μg/ml JC–10 (ENZ–52305; Enzo Life Sciences, Farmingdale, NY, USA). To assess mitochondrial mass, senescent fibroblasts were incubated for 30 min at 37° C in medium containing 50 nM MitoTracker Deep Red (M22426; Thermo Fisher Scientific, Waltham, MA, USA). To evaluate autofluorescence, senescent fibroblasts were incubated in dye-free medium for 30 min at 37° C. Following the protocol of the earlier investigation, flow cytometry analysis was then carried out [44].
Measurement of extracellular acidification rate (ECAR)
The Seahorse XF Glycolytic Rate Assay Kit (103344–100; Agilent Technology, Santa Clara, CA, USA) was used to measure ECAR. The Seahorse XFe96 analyzer (Agilent Technology) was used in accordance with the manufacturer’s instructions.
Senescent associated–β–galactosidase (SA–β–gal) staining
The manufacturer’s instructions for SA–β–gal staining (9860; Cell Signaling Technology, Beverly, MA, USA) were followed.
Neutral comet assay
A CometAssay Single Cell Gel Electrophoresis Assay Kit (4250–050–K; R&D systems, Minneapolis, MN, USA) was used to measure the length of the DNA tail. The manufacturer’s procedure was followed.
Quantitative polymerase chain reaction (qPCR)
qPCR was carried out as previously mentioned [118]. qPCR was done using the following primer (Table 1).
Table 1. Details of primers used in qPCR.
| Target | Orientation | Sequence (5′–3′) | Size (bp) |
| 36B4 | forward | CAGCAAGTGGGAAGGTGTAATCC | 23 |
| reverse | CCCATTCTATCATCAACGGGTACAA | 25 | |
| GAPDH | forward | CAATGACCCCTTCATTGACC | 20 |
| reverse | AAATGAGCCCCAGCCTTCT | 19 | |
| β–actin | forward | GGCACCCAGCACAATGAAG | 19 |
| reverse | CCGATCCACACGGAGTACTTG | 21 | |
| SLIT2 | forward | CAGAGCTTCAGCAACATGACCC | 22 |
| reverse | GAAAGCACCTTCAGGCACAACAG | 23 | |
| COL1A1 | forward | AGCAAGAACCCCAAGGACAA | 20 |
| reverse | CGAACTGGAATCCATCGGTC | 20 | |
| MMP1 | forward | ATGAAGCAGCCCAGATGTGGAG | 22 |
| reverse | TGGTCCACATCTGCTCTTGGCA | 22 | |
| CCL2 | forward | AGAATCACCAGCAGCAAGTGTCC | 23 |
| reverse | TCCTGAACCCACTTCTGCTTGG | 22 | |
| CCL5 | forward | CCTGCTGCTTTGCCTACATTGC | 22 |
| reverse | ACACACTTGGCGGTTCTTTCGG | 22 | |
| IL–6 | forward | AGACAGCCACTCACCTCTTCAG | 22 |
| reverse | TTCTGCCAGTGCCTCTTTGCTG | 22 | |
| IL–8 | forward | GAGAGTGATTGAGAGTGGACCAC | 23 |
| reverse | CACAACCCTCTGCACCCAGTTT | 22 | |
| PAR–2 | forward | TGCTAGCAGCCTCTCTCTCC | 20 |
| reverse | CCAGTGAGGACAGATGCAGA | 20 | |
| SDF–1 | forward | TGCCAGAGCCAACGTCAAG | 19 |
| reverse | CAGCCGGGCTACAATCTGAA | 20 | |
| Bmal–1 | forward | TGTGGGCGCTCACTGTGT | 18 |
| reverse | TTCTGCCTGATCCTGTCATCTCT | 23 |
Measurement of melanosome transport
In order to promote the development of melanosomes, HaCaT cells were exposed to 30 mJ/cm2 UVB. Next, DMSO (0.01%) or M. officinalis extract (0.625, 1.25, and 2.5 μg/ml) were applied to HaCaT cells for 8 h. Niacinamide (N0636; Sigma) at a concentration of 100 μg/ml was employed as a positive control. Deionized water was used to dilute niacinamide to a concentration of 1 g/ml. To reach 100 μg/ml, 10 ml of medium was mixed with 1 μl of 1 g/ml niacinamide.
Measurement of skin pigmentation
In order to cause skin pigmentation, 15 J/cm2 UVB was applied to HaCaT cells. Next, DMSO (0.01%) or M. officinalis extract (0.625, 1.25, and 2.5 μg/ml) were applied to HaCaT cells for a duration of 24 h. 1 μM retinol (R7632; Sigma) was employed as a positive control. DMSO (D8418; Sigma) was used to dilute the retinol to a concentration of 10 μM. To reach a concentration of 1 μM, 10 ml of medium was mixed with 1 μl of 10 μM retinol.
Measurement of skin turnover
30 mJ/cm2 UVB was applied to HaCaT cells in order to interfere with the skin turnover cycle. Next, DMSO (0.01%) or M. officinalis extract (0.625, 1.25, and 2.5 μg/ml) were applied to HaCaT cells for a duration of 24 h.
Western blot analysis
The Western blot analysis procedure was carried out as previously mentioned [119]. This study employed the following antibodies: horseradish peroxidase (HRP)-conjugated secondary antibody (1706515; Bio-Rad, Hercules, CA, USA, 1:2,000 dilution in 5% skim milk), HRP-conjugated secondary antibody (1706516; Bio-Rad, 1:10,000 dilution in 5% skim milk), PAR–2 antibody (sc-13504; Santa Cruz biotechnology, Dallas, TX, USA, 1:500 dilution in 5% skim milk), GAPDH antibody (sc-32233; Santa Cruz biotechnology, 1:5,000 dilution in 5% skim milk), SDF–1 antibody (ab155090; Abcam, Cambridge, UK, 1:1,000 dilution in 5% skim milk), and Bmal–1 antibody (PA1-523; Invitrogen, Waltham, MA, USA, 1:1,000 dilution in 5% skim milk).
Measurement of skin moisture retention
HEKn cells, which are normal human epidermal keratinocytes, were exposed to DMSO (0.01%) or M. officinalis extract (0.625, 1.25, and 2.5 μg/ml) for a duration of 72 h. HEKn cells were treated with 250 μg/ml ceramide NP (100403-19-8; Evonik, Germany) as a positive control. DMSO (D8418; Sigma) was used to dilute ceramide NP to a concentration of 2.5 g/ml. 1 μl of 2.50 g/ml ceramide NP was added to 10 ml of medium to reach a concentration of 250 μg/ml. Alexa Fluor® 488 goat anti-rabbit IgG antibody (1:400 dilution; A28175; Invitrogen) was the secondary antibody utilized, whereas the primary antibody was anti-Filaggrin (1:200 dilution; PA5–83128; Invitrogen). To measure the fluorescence intensity of the filaggrin protein, Image J analysis (National Institutes of Health) was used.
Statistical analysis
A standard statistical software package (GraphPad Prism 9; San Diego, CA, USA) was used to perform the statistical analyses. To ascertain if differences were significant, the student’s t–test, two–way ANOVA, and Bonferroni’s post–hoc test were employed.
Data availability statement
The original contributions presented in the study are included in the article, further inquiries can be directed to the corresponding authors.
Supplementary Materials
Author Contributions
YHL, EYJ, YHK, YB, SSS and JTP conceived and designed the experiments. YHL, EYJ, YHK, JHP, JHY, YJL, SHL, YKN, SYC, JSP, SYK, and YB performed the experiments. JHP, JHY, YJL, SHL, YKN, SYC, JSP, SYK, and YB analyzed the data. YHL, EYJ, YHK, YB, SSS and JTP wrote and edited the manuscript.
Conflicts of Interest
The authors declare no conflicts of interest. The funders had no role in the collection, analyses, or interpretation of data; in the writing of the manuscript; or in the decision to publish the paper.
Ethical Statement and Consent
All authors hereby declare that all experiments have been examined and approved by Incheon National University. The application for human cell line research was approved by the Committee of Incheon National University (protocol number: 20230115001). Because this study did not involve human participants, informed consent was not required.
Funding
This research was supported by a grant of the Korea Health Technology R&D Project through the Korea Health Industry Development Institute (KHIDI), funded by the Ministry of Health & Welfare, Republic of Korea (HP23C0024).
References
- 1. Bolden JE and Lowe SW. 15 - Cellular Senescence. In: Mendelsohn J, Gray JW, Howley PM, Israel MA and Thompson CB, eds. The Molecular Basis of Cancer (Fourth Edition). (Philadelphia: Content Repository Only!).2015; pp. 229–38.e222.
- 2. Bouska M, Huang K, Kang P, Bai H. Organelle aging: Lessons from model organisms. J Genet Genomics. 2019; 46:171–85. https://doi.org/10.1016/j.jgg.2019.03.011 [PubMed]
- 3. Boffoli D, Scacco SC, Vergari R, Solarino G, Santacroce G, Papa S. Decline with age of the respiratory chain activity in human skeletal muscle. Biochim Biophys Acta. 1994; 1226:73–82. https://doi.org/10.1016/0925-4439(94)90061-2 [PubMed]
- 4. Hwang ES, Yoon G, Kang HT. A comparative analysis of the cell biology of senescence and aging. Cell Mol Life Sci. 2009; 66:2503–24. https://doi.org/10.1007/s00018-009-0034-2 [PubMed]
- 5. Lee YH, Kuk MU, So MK, Song ES, Lee H, Ahn SK, Kwon HW, Park JT, Park SC. Targeting Mitochondrial Oxidative Stress as a Strategy to Treat Aging and Age-Related Diseases. Antioxidants (Basel). 2023; 12:934. https://doi.org/10.3390/antiox12040934 [PubMed]
- 6. Giorgi C, Marchi S, Simoes IC, Ren Z, Morciano G, Perrone M, Patalas-Krawczyk P, Borchard S, Jędrak P, Pierzynowska K, Szymański J, Wang DQ, Portincasa P, et al. Mitochondria and Reactive Oxygen Species in Aging and Age-Related Diseases. Int Rev Cell Mol Biol. 2018; 340:209–344 https://doi.org/10.1016/bs.ircmb.2018.05.006 [PubMed]
- 7. Sakellariou GK, Pye D, Vasilaki A, Zibrik L, Palomero J, Kabayo T, McArdle F, Van Remmen H, Richardson A, Tidball JG, McArdle A, Jackson MJ. Role of superoxide-nitric oxide interactions in the accelerated age-related loss of muscle mass in mice lacking Cu,Zn superoxide dismutase. Aging Cell. 2011; 10:749–60. https://doi.org/10.1111/j.1474-9726.2011.00709.x [PubMed]
- 8. Zhavoronkov A, Smit-McBride Z, Guinan KJ, Litovchenko M, Moskalev A. Potential therapeutic approaches for modulating expression and accumulation of defective lamin A in laminopathies and age-related diseases. J Mol Med (Berl). 2012; 90:1361–89. https://doi.org/10.1007/s00109-012-0962-4 [PubMed]
- 9. Richards SA, Muter J, Ritchie P, Lattanzi G, Hutchison CJ. The accumulation of un-repairable DNA damage in laminopathy progeria fibroblasts is caused by ROS generation and is prevented by treatment with N-acetyl cysteine. Hum Mol Genet. 2011; 20:3997–4004. https://doi.org/10.1093/hmg/ddr327 [PubMed]
- 10. Wani WY, Gudup S, Sunkaria A, Bal A, Singh PP, Kandimalla RJ, Sharma DR, Gill KD. Protective efficacy of mitochondrial targeted antioxidant MitoQ against dichlorvos induced oxidative stress and cell death in rat brain. Neuropharmacology. 2011; 61:1193–201. https://doi.org/10.1016/j.neuropharm.2011.07.008 [PubMed]
- 11. Boismal F, Serror K, Dobos G, Zuelgaray E, Bensussan A, Michel L. Vieillissement cutané - Physiopathologie et thérapies innovantes [Skin aging: Pathophysiology and innovative therapies]. Med Sci (Paris). 2020; 36:1163–72. French. https://doi.org/10.1051/medsci/2020232 [PubMed]
- 12. Chaudhary M, Khan A, Gupta M. Skin Ageing: Pathophysiology and Current Market Treatment Approaches. Curr Aging Sci. 2020; 13:22–30. https://doi.org/10.2174/1567205016666190809161115 [PubMed]
- 13. Masaki H. Role of antioxidants in the skin: anti-aging effects. J Dermatol Sci. 2010; 58:85–90. https://doi.org/10.1016/j.jdermsci.2010.03.003 [PubMed]
- 14. Pullar JM, Carr AC, Vissers MC. The Roles of Vitamin C in Skin Health. Nutrients. 2017; 9:866. https://doi.org/10.3390/nu9080866 [PubMed]
- 15. Boo YC. Mechanistic Basis and Clinical Evidence for the Applications of Nicotinamide (Niacinamide) to Control Skin Aging and Pigmentation. Antioxidants (Basel). 2021; 10:1315. https://doi.org/10.3390/antiox10081315 [PubMed]
- 16. Yin Y, Peng F, Zhou L, Yin X, Chen J, Zhong H, Hou F, Xie X, Wang L, Shi X, Ren B, Pei J, Peng C, Gao J. The chromosome-scale genome of Magnolia officinalis provides insight into the evolutionary position of magnoliids. iScience. 2021; 24:102997. https://doi.org/10.1016/j.isci.2021.102997 [PubMed]
- 17. Poivre M, Duez P. Biological activity and toxicity of the Chinese herb Magnolia officinalis Rehder & E. Wilson (Houpo) and its constituents. J Zhejiang Univ Sci B. 2017; 18:194–214. https://doi.org/10.1631/jzus.B1600299 [PubMed]
- 18. Rathee P, Kumar S, Kumar D, Kumari B and Yadav SS. Skin hyperpigmentation and its treatment with herbs: an alternative method. Future Journal of Pharmaceutical Sciences. 2021; 7:132.
- 19. Turrens JF. Mitochondrial formation of reactive oxygen species. J Physiol. 2003; 552:335–44. https://doi.org/10.1113/jphysiol.2003.049478 [PubMed]
- 20. Henderson LM, Chappell JB. Dihydrorhodamine 123: a fluorescent probe for superoxide generation? Eur J Biochem. 1993; 217:973–80. https://doi.org/10.1111/j.1432-1033.1993.tb18328.x [PubMed]
- 21. Dickinson BC, Srikun D, Chang CJ. Mitochondrial-targeted fluorescent probes for reactive oxygen species. Curr Opin Chem Biol. 2010; 14:50–56. https://doi.org/10.1016/j.cbpa.2009.10.014 [PubMed]
- 22. Roelofs BA, Ge SX, Studlack PE, Polster BM. Low micromolar concentrations of the superoxide probe MitoSOX uncouple neural mitochondria and inhibit complex IV. Free Radic Biol Med. 2015; 86:250–8 https://doi.org/10.1016/j.freeradbiomed.2015.05.032 [PubMed]
- 23. Liao W, Huang JP and Huang WY. Chemical Composition Analysis and Biofunctionality of Polygonatum sibiricum and Polygonatum odoratum Extracts. BioResources. 2023; 18:3608–19.
- 24. Park CH, Park SY, Lee SY, Kim JK, Park SU. Analysis of Metabolites in White Flowers of Magnolia Denudata Desr. and Violet Flowers of Magnolia Liliiflora Desr. Molecules. 2018; 23:1558. https://doi.org/10.3390/molecules23071558 [PubMed]
- 25. Mani R, Natesan V. Chrysin: Sources, beneficial pharmacological activities, and molecular mechanism of action. Phytochemistry. 2018; 145:187–96. https://doi.org/10.1016/j.phytochem.2017.09.016 [PubMed]
- 26. Dos Reis LC, Facco EM, Salvador M, Flôres SH, de Oliveira Rios A. Antioxidant potential and physicochemical characterization of yellow, purple and orange passion fruit. J Food Sci Technol. 2018; 55:2679–91. https://doi.org/10.1007/s13197-018-3190-2 [PubMed]
- 27. Constantinescu T and Mihis AG. Resveratrol as a privileged molecule with antioxidant activity. Food Chemistry Advances. 2023; 3:100539.
- 28. Zhang J, Yu H, Man MQ, Hu L. Aging in the dermis: Fibroblast senescence and its significance. Aging Cell. 2024; 23:e14054. https://doi.org/10.1111/acel.14054 [PubMed]
- 29. Lista AD, Sirimaturos M. Pharmacokinetic and Pharmacodynamic Principles for Toxicology. Crit Care Clin. 2021; 37:475–86. https://doi.org/10.1016/j.ccc.2021.03.001 [PubMed]
- 30. Sweeney GD. Variability in the human drug response. Thromb Res Suppl. 1983; 4:3–15. https://doi.org/10.1016/0049-3848(83)90353-5 [PubMed]
- 31. Mukhopadhyay P, Rajesh M, Yoshihiro K, Haskó G, Pacher P. Simple quantitative detection of mitochondrial superoxide production in live cells. Biochem Biophys Res Commun. 2007; 358:203–08. https://doi.org/10.1016/j.bbrc.2007.04.106 [PubMed]
- 32. Romar GA, Kupper TS, Divito SJ. Research Techniques Made Simple: Techniques to Assess Cell Proliferation. J Invest Dermatol. 2016; 136:e1–e7. https://doi.org/10.1016/j.jid.2015.11.020 [PubMed]
- 33. Hansen J, Bross P. A cellular viability assay to monitor drug toxicity. Methods Mol Biol. 2010; 648:303–11. https://doi.org/10.1007/978-1-60761-756-3_21 [PubMed]
- 34. Sherratt HS. Mitochondria: structure and function. Rev Neurol (Paris). 1991; 147:417–30. [PubMed]
- 35. Miwa S, Kashyap S, Chini E, von Zglinicki T. Mitochondrial dysfunction in cell senescence and aging. J Clin Invest. 2022; 132:e158447. https://doi.org/10.1172/JCI158447 [PubMed]
- 36. Chapman J, Fielder E, Passos JF. Mitochondrial dysfunction and cell senescence: deciphering a complex relationship. FEBS Lett. 2019; 593:1566–79. https://doi.org/10.1002/1873-3468.13498 [PubMed]
- 37. Lee HC, Yin PH, Chi CW, Wei YH. Increase in mitochondrial mass in human fibroblasts under oxidative stress and during replicative cell senescence. J Biomed Sci. 2002; 9:517–26. https://doi.org/10.1007/BF02254978 [PubMed]
- 38. Park JY, Lee H, Song ES, Lee YH, Kuk MU, Ko G, Kwon HW, Byun Y, Park JT. Restoration of Lysosomal and Mitochondrial Function Through p38 Mitogen-Activated Protein Kinase Inhibition Ameliorates Senescence. Rejuvenation Res. 2022; 25:291–99. https://doi.org/10.1089/rej.2022.0043 [PubMed]
- 39. Kang HT, Park JT, Choi K, Kim Y, Choi HJ, Jung CW, Lee YS, Park SC. Chemical screening identifies ATM as a target for alleviating senescence. Nat Chem Biol. 2017; 13:616–23. https://doi.org/10.1038/nchembio.2342 [PubMed]
- 40. Lee YH, Park JY, Lee H, Song ES, Kuk MU, Joo J, Oh S, Kwon HW, Park JT, Park SC. Targeting Mitochondrial Metabolism as a Strategy to Treat Senescence. Cells. 2021; 10:3003. https://doi.org/10.3390/cells10113003 [PubMed]
- 41. Zong Y, Li H, Liao P, Chen L, Pan Y, Zheng Y, Zhang C, Liu D, Zheng M, Gao J. Mitochondrial dysfunction: mechanisms and advances in therapy. Signal Transduct Target Ther. 2024; 9:124. https://doi.org/10.1038/s41392-024-01839-8 [PubMed]
- 42. Rabinowitz JD, Enerbäck S. Lactate: the ugly duckling of energy metabolism. Nat Metab. 2020; 2:566–71. https://doi.org/10.1038/s42255-020-0243-4 [PubMed]
- 43. Sakamuri SS, Sure VN, Kolli L, Liu N, Evans WR, Sperling JA, Busija DW, Wang X, Lindsey SH, Murfee WL, Mostany R, Katakam PV. Glycolytic and Oxidative Phosphorylation Defects Precede the Development of Senescence in Primary Human Brain Microvascular Endothelial Cells. Geroscience. 2022; 44:1975–94. https://doi.org/10.1007/s11357-022-00550-2 [PubMed]
- 44. Lee YH, Choi D, Jang G, Park JY, Song ES, Lee H, Kuk MU, Joo J, Ahn SK, Byun Y, Park JT. Targeting regulation of ATP synthase 5 alpha/beta dimerization alleviates senescence. Aging (Albany NY). 2022; 14:678–707. https://doi.org/10.18632/aging.203858 [PubMed]
- 45. Kuk MU, Lee H, Song ES, Lee YH, Park JY, Jeong S, Kwon HW, Byun Y, Park SC, Park JT. Functional restoration of lysosomes and mitochondria through modulation of AKT activity ameliorates senescence. Exp Gerontol. 2023; 173:112091. https://doi.org/10.1016/j.exger.2023.112091 [PubMed]
- 46. Kim JW, Kuk MU, Choy HE, Park SC, Park JT. Mitochondrial metabolic reprograming via BRAF inhibition ameliorates senescence. Exp Gerontol. 2019; 126:110691. https://doi.org/10.1016/j.exger.2019.110691 [PubMed]
- 47. Kurz DJ, Decary S, Hong Y, Erusalimsky JD. Senescence-associated (beta)-galactosidase reflects an increase in lysosomal mass during replicative ageing of human endothelial cells. J Cell Sci. 2000; 113:3613–22. https://doi.org/10.1242/jcs.113.20.3613 [PubMed]
- 48. Ilie OD, Ciobica A, Riga S, Dhunna N, McKenna J, Mavroudis I, Doroftei B, Ciobanu AM, Riga D. Mini-Review on Lipofuscin and Aging: Focusing on The Molecular Interface, The Biological Recycling Mechanism, Oxidative Stress, and The Gut-Brain Axis Functionality. Medicina (Kaunas). 2020; 56:626. https://doi.org/10.3390/medicina56110626 [PubMed]
- 49. Checa J, Aran JM. Reactive Oxygen Species: Drivers of Physiological and Pathological Processes. J Inflamm Res. 2020; 13:1057–73. https://doi.org/10.2147/JIR.S275595 [PubMed]
- 50. Cordelli E, Bignami M, Pacchierotti F. Comet assay: a versatile but complex tool in genotoxicity testing. Toxicol Res (Camb). 2021; 10:68–78. https://doi.org/10.1093/toxres/tfaa093 [PubMed]
- 51. Nassour J, Martien S, Martin N, Deruy E, Tomellini E, Malaquin N, Bouali F, Sabatier L, Wernert N, Pinte S, Gilson E, Pourtier A, Pluquet O, Abbadie C. Defective DNA single-strand break repair is responsible for senescence and neoplastic escape of epithelial cells. Nat Commun. 2016; 7:10399. https://doi.org/10.1038/ncomms10399 [PubMed]
- 52. Stern AD, Rahman AH, Birtwistle MR. Cell size assays for mass cytometry. Cytometry A. 2017; 91:14–24. https://doi.org/10.1002/cyto.a.23000 [PubMed]
- 53. McLafferty E. The integumentary system: anatomy, physiology and function of skin. Nurs Stand. 2012; 27:35–42. https://doi.org/10.7748/ns.27.3.35.s52 [PubMed]
- 54. Farage MA, Miller KW, Elsner P, Maibach HI. Characteristics of the Aging Skin. Adv Wound Care (New Rochelle). 2013; 2:5–10. https://doi.org/10.1089/wound.2011.0356 [PubMed]
- 55. Kim YH, Lee YK, Park SS, Park SH, Eom SY, Lee YS, Lee WJ, Jang J, Seo D, Kang HY, Kim JC, Lim SB, Yoon G, et al. Mid-old cells are a potential target for anti-aging interventions in the elderly. Nat Commun. 2023; 14:7619. https://doi.org/10.1038/s41467-023-43491-w [PubMed]
- 56. Qi C, Lan H, Ye J, Li W, Wei P, Yang Y, Guo S, Lan T, Li J, Zhang Q, He X, Wang L. Slit2 promotes tumor growth and invasion in chemically induced skin carcinogenesis. Lab Invest. 2014; 94:766–76. https://doi.org/10.1038/labinvest.2014.70 [PubMed]
- 57. Wu MF, Liao CY, Wang LY, Chang JT. The role of Slit-Robo signaling in the regulation of tissue barriers. Tissue Barriers. 2017; 5:e1331155. https://doi.org/10.1080/21688370.2017.1331155 [PubMed]
- 58. Low E, Alimohammadiha G, Smith LA, Costello LF, Przyborski SA, von Zglinicki T, Miwa S. How good is the evidence that cellular senescence causes skin ageing? Ageing Res Rev. 2021; 71:101456. https://doi.org/10.1016/j.arr.2021.101456 [PubMed]
- 59. Pittayapruek P, Meephansan J, Prapapan O, Komine M, Ohtsuki M. Role of Matrix Metalloproteinases in Photoaging and Photocarcinogenesis. Int J Mol Sci. 2016; 17:868. https://doi.org/10.3390/ijms17060868 [PubMed]
- 60. He X, Gao X, Guo Y, Xie W. Research Progress on Bioactive Factors against Skin Aging. Int J Mol Sci. 2024; 25:3797; 25:3797. https://doi.org/10.3390/ijms25073797 [PubMed]
- 61. Pastore S, Mascia F, Mariotti F, Dattilo C, Girolomoni G. Chemokine networks in inflammatory skin diseases. Eur J Dermatol. 2004; 14:203–8 [PubMed]
- 62. Li L, Dai F, Wang L, Sun Y, Mei L, Ran Y, Ye F. CCL13 and human diseases. Front Immunol. 2023; 14:1176639. https://doi.org/10.3389/fimmu.2023.1176639 [PubMed]
- 63. Paquet P, Piérard GE. Interleukin-6 and the skin. Int Arch Allergy Immunol. 1996; 109:308–17. https://doi.org/10.1159/000237257 [PubMed]
- 64. Bickel M. The role of interleukin-8 in inflammation and mechanisms of regulation. J Periodontol. 1993; 64:456–60. [PubMed]
- 65. Lee AY. Skin Pigmentation Abnormalities and Their Possible Relationship with Skin Aging. Int J Mol Sci. 2021; 22:3727. https://doi.org/10.3390/ijms22073727 [PubMed]
- 66. Choi EJ, Kang YG, Kim J, Hwang JK. Macelignan inhibits melanosome transfer mediated by protease-activated receptor-2 in keratinocytes. Biol Pharm Bull. 2011; 34:748–54. https://doi.org/10.1248/bpb.34.748 [PubMed]
- 67. Bolognia J, Murray M, Pawelek J. UVB-induced melanogenesis may be mediated through the MSH-receptor system. J Invest Dermatol. 1989; 92:651–56. https://doi.org/10.1111/1523-1747.ep12696836 [PubMed]
- 68. Shao Y, He T, Fisher GJ, Voorhees JJ, Quan T. Molecular basis of retinol anti-ageing properties in naturally aged human skin in vivo. Int J Cosmet Sci. 2017; 39:56–65. https://doi.org/10.1111/ics.12348 [PubMed]
- 69. Yoon JE, Kim Y, Kwon S, Kim M, Kim YH, Kim JH, Park TJ, Kang HY. Senescent fibroblasts drive ageing pigmentation: A potential therapeutic target for senile lentigo. Theranostics. 2018; 8:4620–32. https://doi.org/10.7150/thno.26975 [PubMed]
- 70. Silveira EJ, Nascimento Filho CH, Yujra VQ, Webber LP, Castilho RM, Squarize CH. BMAL1 Modulates Epidermal Healing in a Process Involving the Antioxidative Defense Mechanism. Int J Mol Sci. 2020; 21:901. https://doi.org/10.3390/ijms21030901 [PubMed]
- 71. Levin J, Friedlander SF, Del Rosso JQ. Atopic dermatitis and the stratum corneum: part 1: the role of filaggrin in the stratum corneum barrier and atopic skin. J Clin Aesthet Dermatol. 2013; 6:16–22. [PubMed]
- 72. Sandilands A, Sutherland C, Irvine AD, McLean WH. Filaggrin in the frontline: role in skin barrier function and disease. J Cell Sci. 2009; 122:1285–94. https://doi.org/10.1242/jcs.033969 [PubMed]
- 73. Chen YY, Huang SM, Cheng YW, Hsu YL, Lan CE. High-glucose impact on UVB responses in human epidermal keratinocytes: Insights on diabetic skin’s resistance to photocarcinogenesis. Life Sci. 2024; 357:123083. https://doi.org/10.1016/j.lfs.2024.123083 [PubMed]
- 74. Trinh TT, Choi JH, Yang JE, Kim WH, Chien PN, Le LT, Ngan-Giang N, Nga PT, Nam SY, Heo CY. Effects on keratinocytes of the traditional combination of herb extract (Royal Oji Complex) implicated the improvement of young children’s skin moisture and barrier. Skin Res Technol. 2024; 30:e13682. https://doi.org/10.1111/srt.13682 [PubMed]
- 75. Ariffin NH, Hasham R, Hamzah MA, Park CS. Skin hydration modulatory activities of Ficus deltoidea extract. Fitoterapia. 2024; 172:105755. https://doi.org/10.1016/j.fitote.2023.105755 [PubMed]
- 76. McClanahan D, Wong A, Kezic S, Samrao A, Hajar T, Hill E, Simpson EL. A randomized controlled trial of an emollient with ceramide and filaggrin-associated amino acids for the primary prevention of atopic dermatitis in high-risk infants. J Eur Acad Dermatol Venereol. 2019; 33:2087–94. https://doi.org/10.1111/jdv.15786 [PubMed]
- 77. Usach I, Alaimo A, Fernández J, Ambrosini A, Mocini S, Ochiuz L, Peris JE. Magnolol and Honokiol: Two Natural Compounds with Similar Chemical Structure but Different Physicochemical and Stability Properties. Pharmaceutics. 2021; 13:224. https://doi.org/10.3390/pharmaceutics13020224 [PubMed]
- 78. Dikalov S, Losik T, Arbiser JL. Honokiol is a potent scavenger of superoxide and peroxyl radicals. Biochem Pharmacol. 2008; 76:589–96. https://doi.org/10.1016/j.bcp.2008.06.012 [PubMed]
- 79. Tse AK, Wan CK, Zhu GY, Shen XL, Cheung HY, Yang M, Fong WF. Magnolol suppresses NF-kappaB activation and NF-kappaB regulated gene expression through inhibition of IkappaB kinase activation. Mol Immunol. 2007; 44:2647–58. https://doi.org/10.1016/j.molimm.2006.12.004 [PubMed]
- 80. Papaccio F, D Arino A, Caputo S, Bellei B. Focus on the Contribution of Oxidative Stress in Skin Aging. Antioxidants (Basel). 2022; 11:1121. https://doi.org/10.3390/antiox11061121 [PubMed]
- 81. Murphy MP. How mitochondria produce reactive oxygen species. Biochem J. 2009; 417:1–13. https://doi.org/10.1042/BJ20081386 [PubMed]
- 82. Choksi KB, Nuss JE, Deford JH, Papaconstantinou J. Age-related alterations in oxidatively damaged proteins of mouse skeletal muscle mitochondrial electron transport chain complexes. Free Radic Biol Med. 2008; 45:826–38. https://doi.org/10.1016/j.freeradbiomed.2008.06.006 [PubMed]
- 83. Choksi KB, Boylston WH, Rabek JP, Widger WR, Papaconstantinou J. Oxidatively damaged proteins of heart mitochondrial electron transport complexes. Biochim Biophys Acta. 2004; 1688:95–101. https://doi.org/10.1016/j.bbadis.2003.11.007 [PubMed]
- 84. Nakai K, Tsuruta D. What Are Reactive Oxygen Species, Free Radicals, and Oxidative Stress in Skin Diseases? Int J Mol Sci. 2021; 22:10799. https://doi.org/10.3390/ijms221910799 [PubMed]
- 85. Stout R, Birch-Machin M. Mitochondria’s Role in Skin Ageing. Biology (Basel). 2019; 8:29. https://doi.org/10.3390/biology8020029 [PubMed]
- 86. Nolfi-Donegan D, Braganza A, Shiva S. Mitochondrial electron transport chain: Oxidative phosphorylation, oxidant production, and methods of measurement. Redox Biol. 2020; 37:101674. https://doi.org/10.1016/j.redox.2020.101674 [PubMed]
- 87. Zhao RZ, Jiang S, Zhang L, Yu ZB. Mitochondrial electron transport chain, ROS generation and uncoupling (Review). Int J Mol Med. 2019; 44:3–15. https://doi.org/10.3892/ijmm.2019.4188 [PubMed]
- 88. Phua QH, Ng SY, Soh BS. Mitochondria: A Potential Rejuvenation Tool against Aging. Aging Dis. 2024; 15:503–16. https://doi.org/10.14336/AD.2023.0712 [PubMed]
- 89. Choudhury D, Rong N, Senthil Kumar HV, Swedick S, Samuel RZ, Mehrotra P, Toftegaard J, Rajabian N, Thiyagarajan R, Podder AK, Wu Y, Shahini S, Seldeen KL, et al. Proline restores mitochondrial function and reverses aging hallmarks in senescent cells. Cell Rep. 2024; 43:113738. https://doi.org/10.1016/j.celrep.2024.113738 [PubMed]
- 90. Poljšak B, Dahmane R. Free radicals and extrinsic skin aging. Dermatol Res Pract. 2012; 2012:135206. https://doi.org/10.1155/2012/135206 [PubMed]
- 91. Silva SA, Michniak-Kohn B, Leonardi GR. An overview about oxidation in clinical practice of skin aging. An Bras Dermatol. 2017; 92:367–74. https://doi.org/10.1590/abd1806-4841.20175481 [PubMed]
- 92. Cordeiro RM. Reactive oxygen species at phospholipid bilayers: distribution, mobility and permeation. Biochim Biophys Acta. 2014; 1838:438–44. https://doi.org/10.1016/j.bbamem.2013.09.016 [PubMed]
- 93. Liu JK. Natural products in cosmetics. Nat Prod Bioprospect. 2022; 12:40. https://doi.org/10.1007/s13659-022-00363-y [PubMed]
- 94. He X, Wan F, Su W, Xie W. Research Progress on Skin Aging and Active Ingredients. Molecules. 2023; 28:5556. https://doi.org/10.3390/molecules28145556 [PubMed]
- 95. Brickel JA, Matulka RA and Burdock GA. The explosion in the use of natural substances and the need for new comprehensive risk assessments. Current Opinion in Food Science. 2018; 24:56–61.
- 96. Emerald M, AE, LE and Kumar V. Perspective of Natural Products in Skincare. Pharmacy & Pharmacology International Journal. 2016; Volume 4:1–3.
- 97. Mottaghi S, Abbaszadeh H. Natural Lignans Honokiol and Magnolol as Potential Anticarcinogenic and Anticancer Agents. A Comprehensive Mechanistic Review. Nutr Cancer. 2022; 74:761–78. https://doi.org/10.1080/01635581.2021.1931364 [PubMed]
- 98. Ma L, Chen J, Wang X, Liang X, Luo Y, Zhu W, Wang T, Peng M, Li S, Jie S, Peng A, Wei Y, Chen L. Structural modification of honokiol, a biphenyl occurring in Magnolia officinalis: the evaluation of honokiol analogues as inhibitors of angiogenesis and for their cytotoxicity and structure-activity relationship. J Med Chem. 2011; 54:6469–81. https://doi.org/10.1021/jm200830u [PubMed]
- 99. Lin Y, Li Y, Zeng Y, Tian B, Qu X, Yuan Q, Song Y. Pharmacology, Toxicity, Bioavailability, and Formulation of Magnolol: An Update. Front Pharmacol. 2021; 12:632767. https://doi.org/10.3389/fphar.2021.632767 [PubMed]
- 100. Kumar N, Goel N. Phenolic acids: Natural versatile molecules with promising therapeutic applications. Biotechnol Rep (Amst). 2019; 24:e00370. https://doi.org/10.1016/j.btre.2019.e00370 [PubMed]
- 101. Chen J, Yang J, Ma L, Li J, Shahzad N, Kim CK. Structure-antioxidant activity relationship of methoxy, phenolic hydroxyl, and carboxylic acid groups of phenolic acids. Sci Rep. 2020; 10:2611. https://doi.org/10.1038/s41598-020-59451-z [PubMed]
- 102. Charlton NC, Mastyugin M, Török B, Török M. Structural Features of Small Molecule Antioxidants and Strategic Modifications to Improve Potential Bioactivity. Molecules. 2023; 28:1057. https://doi.org/10.3390/molecules28031057 [PubMed]
- 103. Rauf A, Olatunde A, Imran M, Alhumaydhi FA, Aljohani AS, Khan SA, Uddin MS, Mitra S, Emran TB, Khayrullin M, Rebezov M, Kamal MA, Shariati MA. Honokiol: A review of its pharmacological potential and therapeutic insights. Phytomedicine. 2021; 90:153647. https://doi.org/10.1016/j.phymed.2021.153647 [PubMed]
- 104. Zhao C, Liu ZQ. Comparison of antioxidant abilities of magnolol and honokiol to scavenge radicals and to protect DNA. Biochimie. 2011; 93:1755–60. https://doi.org/10.1016/j.biochi.2011.06.012 [PubMed]
- 105. Ho JH, Hong CY. Cardiovascular protection of magnolol: cell-type specificity and dose-related effects. J Biomed Sci. 2012; 19:70. https://doi.org/10.1186/1423-0127-19-70 [PubMed]
- 106. Garg A, Rendina D, Bendale H, Akiyama T, Ojima I. Recent advances in catalytic asymmetric synthesis. Front Chem. 2024; 12:1398397. https://doi.org/10.3389/fchem.2024.1398397 [PubMed]
- 107. Yu J, Gao X, Zhang L, Shi H, Yan Y, Han Y, Wu C, Liu Y, Fang M, Huang C, Fan S. Magnolol extends lifespan and improves age-related neurodegeneration in Caenorhabditis elegans via increase of stress resistance. Sci Rep. 2024; 14:3158. https://doi.org/10.1038/s41598-024-53374-9 [PubMed]
- 108. Back P, Braeckman BP, Matthijssens F. ROS in aging Caenorhabditis elegans: damage or signaling? Oxid Med Cell Longev. 2012; 2012:608478. https://doi.org/10.1155/2012/608478 [PubMed]
- 109. Lee KI, Kim HJ, Kim H, Kim MS, Kim JI, Park KS. Magnolia officinalis Bark Extract Prevents Enterocyte Death in a Colitis Mouse Model by Inhibiting ROS-Mediated Necroptosis. Antioxidants (Basel). 2022; 11:2435. https://doi.org/10.3390/antiox11122435 [PubMed]
- 110. Borgonetti V, Galeotti N. Honokiol-Rich Magnolia officinalis Bark Extract Attenuates Trauma-Induced Neuropathic Pain. Antioxidants (Basel). 2023; 12:1518. https://doi.org/10.3390/antiox12081518 [PubMed]
- 111. Zhang Q, Cheng G, Pan J, Zielonka J, Xiong D, Myers CR, Feng L, Shin SS, Kim YH, Bui D, Hu M, Bennett B, Schmainda K, et al. Magnolia extract is effective for the chemoprevention of oral cancer through its ability to inhibit mitochondrial respiration at complex I. Cell Commun Signal. 2020; 18:58. https://doi.org/10.1186/s12964-020-0524-2 [PubMed]
- 112. Shen KP, Chang CD, Hsieh MH, Chaung HC. Efficiency and Mechanism Evaluation of Magnolia officinalis Water Extract in Preventing Gastric Ulcer. Evid Based Complement Alternat Med. 2023; 2023:7901734. https://doi.org/10.1155/2023/7901734 [PubMed]
- 113. Huang K, Chen Y, Zhang R, Wu Y, Ma Y, Fang X, Shen S. Honokiol induces apoptosis and autophagy via the ROS/ERK1/2 signaling pathway in human osteosarcoma cells in vitro and in vivo. Cell Death Dis. 2018; 9:157. https://doi.org/10.1038/s41419-017-0166-5 [PubMed]
- 114. Ortega-Villasante C, Burén S, Blázquez-Castro A, Barón-Sola Á, Hernández LE. Fluorescent in vivo imaging of reactive oxygen species and redox potential in plants. Free Radic Biol Med. 2018; 122:202–20. https://doi.org/10.1016/j.freeradbiomed.2018.04.005 [PubMed]
- 115. Hesse AK, Dörger M, Kupatt C, Krombach F. Proinflammatory role of inducible nitric oxide synthase in acute hyperoxic lung injury. Respir Res. 2004; 5:11. https://doi.org/10.1186/1465-9921-5-11 [PubMed]
- 116. Plitzko B, Loesgen S. Measurement of Oxygen Consumption Rate (OCR) and Extracellular Acidification Rate (ECAR) in Culture Cells for Assessment of the Energy Metabolism. Bio Protoc. 2018; 8:e2850. https://doi.org/10.21769/BioProtoc.2850 [PubMed]
- 117. Yoon JH, Kim YH, Jeong EY, Lee YH, Byun Y, Shin SS, Park JT. Senescence Rejuvenation through Reduction in Mitochondrial Reactive Oxygen Species Generation by Polygonum cuspidatum Extract: In Vitro Evidence. Antioxidants (Basel). 2024; 13:1110. https://doi.org/10.3390/antiox13091110 [PubMed]
- 118. Kuk MU, Park JY, Song ES, Lee H, Lee YH, Joo J, Kwon HW and Park JT. Bacterial Artificial Chromosome-based Protein Expression Platform Using the Tol2 Transposon System. Biotechnology and Bioprocess Engineering. 2022; 27:344–52.
- 119. Lee YH, Kim M, Park HJ, Park JY, Song ES, Lee H, Ko G, Ahn S, Kwon HW, Byun Y, Kim C, Choi J, Park JT. Chemical screening identifies the anticancer properties of Polyporous parvovarius. J Cancer. 2023; 14:50–60. https://doi.org/10.7150/jca.78302 [PubMed]