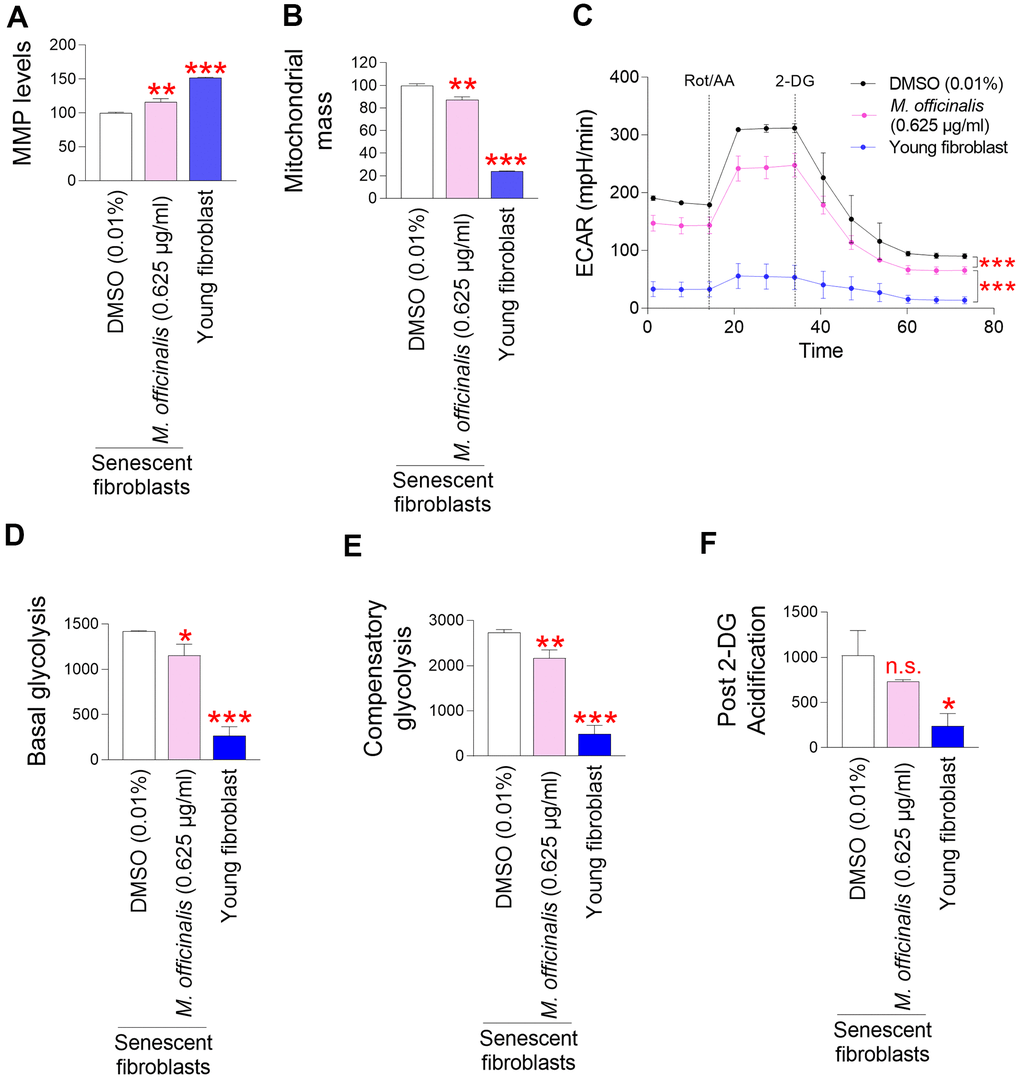
Figure 2.M. officinalis extract reduces mitochondrial ROS generation through mitochondrial functional recovery. (A) Use of JC–10 for flow cytometric measurement of mitochondrial membrane potential (MMP). Senescent fibroblasts were treated with DMSO (0.01%) or M. officinalis extract (0.625 μg/ml) for 12 days. Young fibroblasts were used as a positive control. **P < 0.01, ***P < 0.001, Student's t–test. Mean ± S.D., N = 3. (B) MitoTracker green was employed for a flow cytometric study of mitochondrial mass. Senescent fibroblasts were treated with DMSO (0.01%) or M. officinalis extract (0.625 μg/ml) for 12 days. Young fibroblasts were used as a positive control. **P < 0.01, ***P < 0.001, Student t–test. Mean ± S.D., N = 3. (C) Measurement of extracellular acidification rate (ECAR; mpH/min) after 12 days of treatment with DMSO (0.01%) or M. officinalis extract (0.625 μg/ml) (black line: DMSO–treated senescent fibroblasts, pink line: M. officinalis extract–treated senescent fibroblasts). Young fibroblasts were used as a positive control. ***P < 0.001, two–way ANOVA followed by Bonferroni’s post–hoc test. Means ± S.D., N = 3. (D) Basal glycolysis was measured after 12 days of treatment with DMSO (0.01%) or M. officinalis extract (0.625 μg/ml). Young fibroblasts were used as a positive control. *P < 0.05, ***P < 0.001, Student t–test. Mean ± S.D., N = 3. (E) Compensatory glycolysis was measured after 12 days of treatment with DMSO (0.01%) or M. officinalis extract (0.625 μg/ml). Young fibroblasts were used as a positive control. **P < 0.01, ***P < 0.001, Student's t–test. Mean ± S.D., N = 3. (F) Post–2–DG acidification was measured after 12 days of treatment with DMSO (0.01%) or M. officinalis extract (0.625 μg/ml). Young fibroblasts were used as a positive control. n.s. (not significant), *P < 0.05, Student's t–test. Mean ± S.D., N = 3.