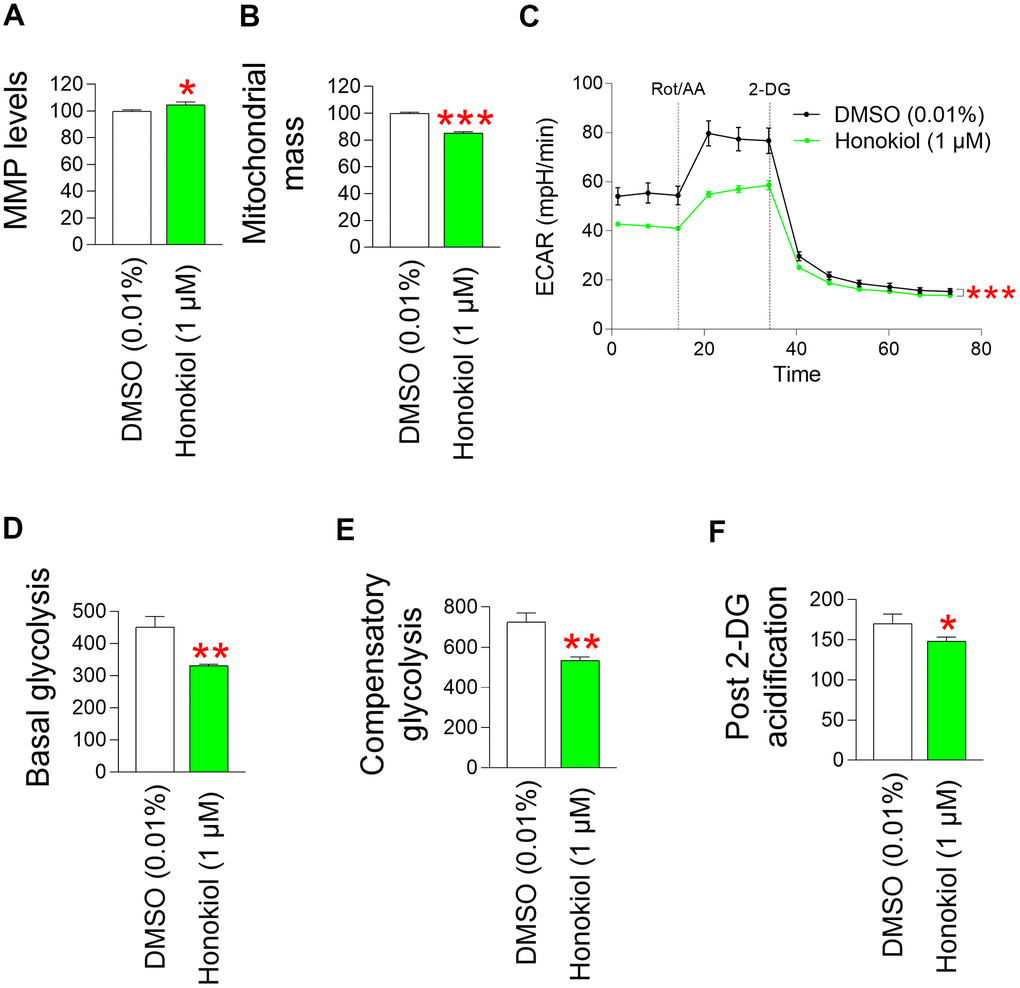
Figure 7.Honokiol reduces mitochondrial ROS generation through mitochondrial functional recovery. (A) Use of JC–10 for flow cytometric measurement of MMP. Senescent fibroblasts were treated with DMSO (0.01%) or honokiol (1 μM) for 12 days. *P < 0.05, Student's t–test. Mean ± S.D., N = 3. (B) MitoTracker green was employed for a flow cytometric study of mitochondrial mass. Senescent fibroblasts were treated with DMSO (0.01%) or honokiol (1 μM) for 12 days. ***P < 0.001, Student t–test. Mean ± S.D., N = 3. (C) Measurement of extracellular acidification rate (ECAR; mpH/min) after 12 days of treatment with DMSO (0.01%) or 1 μM honokiol. (black line: DMSO–treated senescent fibroblasts, pink line: honokiol–treated senescent fibroblasts). ***P < 0.001, two–way ANOVA followed by Bonferroni’s post–hoc test. Means ± S.D., N = 3. (D) Basal glycolysis was measured after 12 days of treatment with DMSO (0.01%) or honokiol (1 μM). **P < 0.01, student t–test. Mean ± S.D., N = 3. (E) The compensatory glycolysis was measured after 12 days of treatment with DMSO (0.01%) or honokiol (1 μM). **P < 0.01, Student t–test. Mean ± S.D., N = 3. (F) Post–2–DG acidification was measured after 12 days of treatment with DMSO (0.01%) or honokiol (1 μM). *P < 0.05, Student t–test. Mean ± S.D., N = 3.