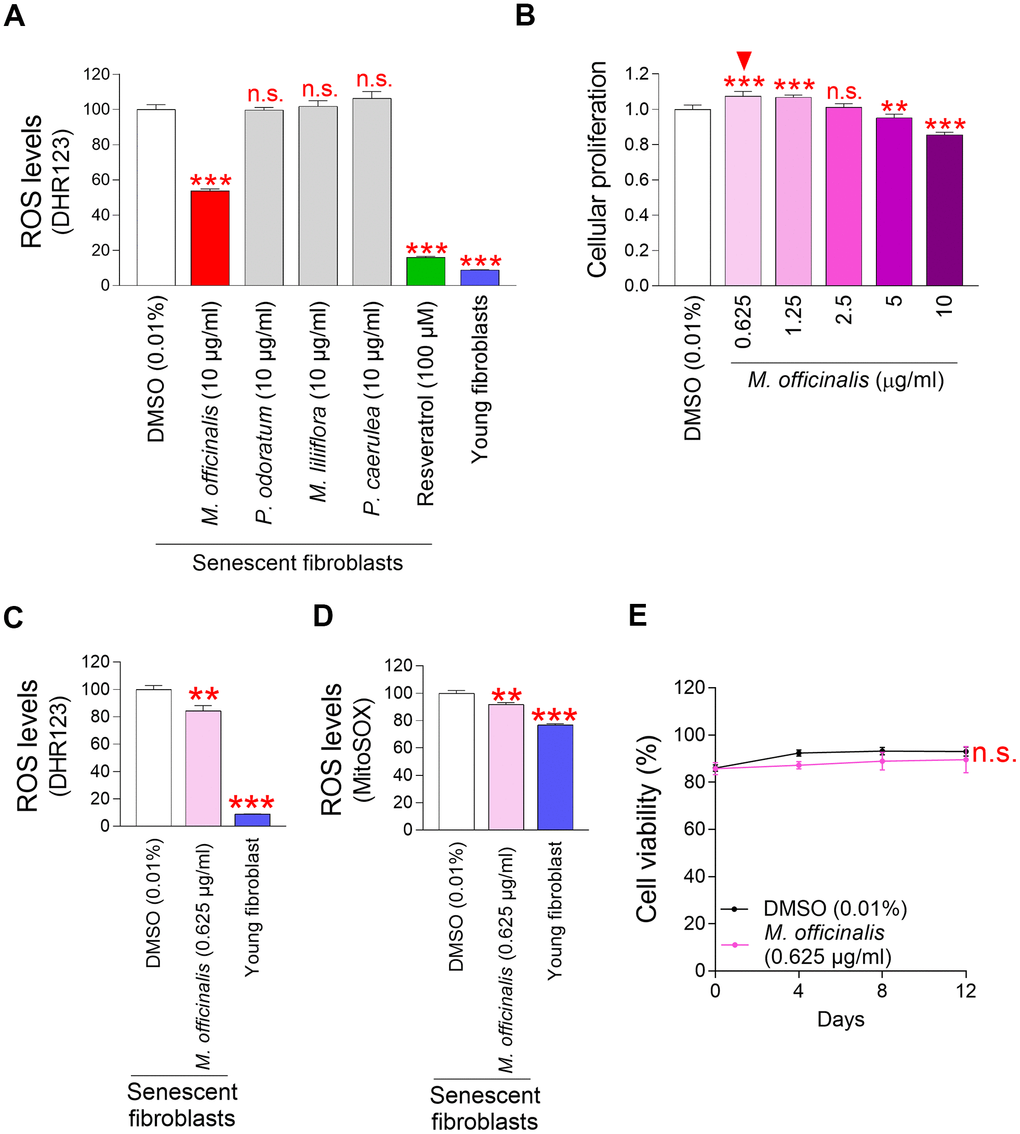
Figure 1.Mitochondrial ROS levels in senescent fibroblasts are significantly reduced by M. officinalis extract. (A) Senescent fibroblasts were treated with M. officinalis, P. odoratum, M. liliiflora and P. caerulea extract at a 10 μg/ml. On day 12, the impact on mitochondrial ROS levels was evaluated. DMSO was diluted in the medium to 0.01% to serve as DMSO control. Use of dihydrorhodamine 123 (DHR123) for flow cytometric analysis of mitochondrial ROS levels. Resveratrol (100 μM) and young fibroblasts were used as a positive control. n.s. (not significant), ***P < 0.001, Student's t–test. Mean ± S.D., N = 3. (B) On day 12 following treatment, cellular proliferation in senescent fibroblasts was assessed at varying doses of M. officinalis extract (0.625, 1.25, 2.5, 5, and 10 μg/ml). n.s. (not significant), **P < 0.01, ***P < 0.001, Student's t–test. Mean ± S.D., N = 3. Arrowhead shows the optimal concentration of M. officinalis extract for promoting cellular proliferation. (C) DMSO (0.01%) or M. officinalis extract (0.625 μg/ml) were administered to senescent fibroblasts for 12 days. Then, the flow cytometric analysis of ROS (DHR123) was conducted. Young fibroblasts were used as a positive control. **P < 0.01, ***P < 0.001, Student's t–test. Mean ± S.D., N = 3. (D) DMSO (0.01%) or M. officinalis extract (0.625 μg/ml) were administered to senescent fibroblasts for 12 days. Use of MitoSOX for flow cytometric analysis of mitochondrial ROS levels. Young fibroblasts were used as a positive control. **P < 0.01, ***P < 0.001, Student's t–test. Mean ± S.D., N = 3. (E) Senescent fibroblasts were treated with DMSO (0.01%) or M. officinalis extract (0.625 μg/ml). Measurement of cell viability after 0, 4, 8, and 12 days of treatment. n.s. (not significant), two–way ANOVA followed by Bonferroni’s post–hoc test. Mean ± S.D., N = 3.