


Introduction
Autosomal dominant polycystic kidney disease (ADPKD) is a hereditary kidney disease that is caused by mutation in polycystic kidney disease-1 (PKD1) gene or polycystic kidney disease-2 (PKD2) gene [1, 2]. Meanwhile, ADPKD is also a primary cause of end-stage renal disease (ESRD) [3]. ADPKD is characterized by the slow progressive cyst growth within two kidneys, resulting in destruction of the kidney parenchyma and impaired kidney function [4]. Tolvaptan, a Food and Drug Administration (FDA)-approved vasopressin receptor antagonist, has been used to treat ADPKD [5]. Tolvaptan effectively suppresses the kidney volume growth and improves kidney function in ADPKD patients [6]. However, tolvaptan can cause some side effects, such as liver injury, chest pain and headaches, limiting its clinical application [7]. Thus, uncovering novel therapeutic targets are important for improving ADPKD treatment.
Mitochondria, serving as the energy center of the cell, play crucial roles in mediating cell growth and metabolism [8, 9]. They are also involved in maintaining the balance of fluid in kidneys and electrolyte, as well as removing toxins from the blood in kidneys [10]. Mitochondrial dysfunction in kidneys is linked to the occurrence and progression of multiple kidney diseases, such as cystic kidney disease, tubularinterstitial disease and podocytopathy [11]. Meanwhile, mitochondrial dysfunction is also involved in the pathophysiology of ADPKD [12]. The dysfunctional mitochondria and aerobic glycolysis can be observed in cysts in ADPKD kidneys [12]. Recently, researchers have shown that enhancing mitochondrial function could alleviate kidney injury and improve kidney function in kidney diseases [13, 14]. Thus, mitochondria-targeted therapeutics may offer a promising approach to prevent the progression of kidney diseases (e.g. ADPKD) via maintaining mitochondria homeostasis [11, 15].
Acyl-CoA thioesterase 13 (ACOT13), also known as THEM2, is a mitochondria-associated acyl-CoA thioesterase (Acot) gene [16]. Our previous study found that ACOT13 level was obviously reduced in ADPKD patients [17]. However, the role of ACOT13 in ADPKD remains largely unstudied. In the current research, we found that ACOT13 overexpression could suppress WT9-12 cell proliferation and triggered mitochondrial-mediated cell apoptosis, suggesting that ACOT13 may play a protective role in ADPKD.
Materials and Methods
Data collection
The gene expression profiles of the GSE7869 dataset [including 3 normal renal cortical tissues (normal group) and 18 renal cystic tissues (ADPKD group, including 5 minimally cystic tissue, 5 small cysts, 5 medium cysts, 3 large cysts), processing on the Affymetrix Human Genome U133 Plus 2.0 Array] was acquired from the Gene Expression Omnibus (GEO, https://www.ncbi.nlm.nih.gov/geo/) database.
Screening of differential expressed genes (DEGs)
The limma R package (version 4.1.0) was applied for evaluating ACOT13 level between the control and ADPKD groups [18]. According to the median value of ACOT13 level, samples in the GSE7869 dataset were grouped into high ACOT13 level (H-ACOT13) and low ACOT13 level (L-ACOT13) groups. Next, DEGs between H- and L-ACOT13 groups were screened using the limma R package. |log2 FC| > 1 and p-value < 0.05 were set as the screening criteria.
Functional analyses
Gene Ontology (GO) and Kyoto Encyclopedia of Genes and Genomes (KEGG) enrichment analyses were performed on DEGs. GO analysis [including molecular function (MF), biological pathways (BP), and cellular components (CC)] and KEGG analysis were conducted with “clusterProfiler” (version 4.1.0) R package [19]. Moreover, gene set enrichment analysis (GSEA) was also conducted using the “clusterProfiler” R package. |NES|>1 and p-value < 0.05 were considered as the significantly enriched pathways.
Cell culture and transfection
HK-2 (CL-0109, Procell) and ADPKD cell line WT9-12 (CRL-2833, ATCC) cells were cultured in DMEM (PM150210, Procell) supplemented with 10% FBS (164210, Procell) and 100 units/mL of penicillin and streptomycin (PB180120, Procell) in 5% CO2 atmosphere at 37° C.
Lentivirus containing ACOT13 overexpressing plasmids (ACOT13 OE) and negative control plasmids (Control) were obtained from Tsingke Biotechnology Co. Ltd. (Beijing, China) WT9-12 cells were added with the lentivirus and 6 μg/ml polybrene and incubated for 24 h at 37° C. After removing the media containing the lentivirus, cells were then cultured in fresh DMEM containing 10% FBS for indicated times.
RT-qPCR assay
Total RNA was extracted from cells using the Trizol reagent (9108, Takara) and then retrotranscribed to cDNA using the PrimeScript™ RT reagent Kit with gDNA Eraser (RR047A, Takara). Next, amplification was done using the SYBR® Premix Ex Taq kit (RR820A, Takara) on a fluorescence quantitative PCR instrument (ABI-7500, Applied Biosystems). ACOT13: forward, 5’-TCTGCTATGCACGGAAAGGG-3’, reverse: 5’-TTTCCTGTGGCCTTGTTGGT-3’; GAPDH: forward, 5’-GAGTCAACGGATTTGGTCGT-3’, reverse, 5’-TTGATTTTGGAGGGATCTCG-3’. The relative RNA level was calculated using the 2-ΔΔCt method, and GAPDH was used as an internal control.
Western blot assay
The protein concentration was determined using a BCA protein detection kit (P0010, Beyotime). Next, equal amounts of protein were electrophoretically separated on 10% SDS-PAGE and then loaded onto PVDF membranes. After that, the membranes were probed with anti-ACOT13 (1:1000, ab228011, Abcam), anti-cleaved caspase 3 (1:1000, ab32042, Abcam), anti-Ki67 (1:1000, ab16667, Abcam), anti-PCNA (1:1000, ab92552, Abcam) and anti-β-actin (1:1000, ab8226, Abcam) primary antibodies overnight at 4° C, and then incubated with an HRP-conjugated secondary antibody. The immune blots were visualized by an ECL detection reagent (180-5001, Tanon). The gray value of the blots was analyzed by the Image J software.
Cell counting kit-8 (CCK-8) assay
WT9-12 cells were cultured in a 96-well plate overnight at 37° C. After incubation for indicated times, CCK-8 reagent (C0037, Beyotime) was added for a further 2 h at 4° C. Next, a microplate reader (Multiskan, Thermo Fisher Scientific, USA) was used for reading the absorbance value at 450 nm.
EdU staining assay
An EdU cell proliferation detection assay kit (CA1170, Solarbio) was applied for assessing cell proliferation. WT9-12 cells were loaded onto a 24-well plate overnight at 37° C, and then stained with 50 μM EdU for 2 h. After fixing with 4% paraformaldehyde (AR1069, Boster) for 30 min at room temperature, cells were stained with the Apollo solution. Cell nucleus was then stained with Hoechst 33342 reagent for 30 min in darkness. Finally, a fluorescence microscope (CKX31, Olympus) was used to observe the EdU positive cells. Meanwhile, the results were analyzed by the Image J software.
Flow cytometry assay
For cell cycle detection, WT9-12 cells were fixed with 75% pre-cooled ethanol overnight at 4° C. Next, cells were treated with RNAase A (20 μg/ml, EN0531, Thermo Fisher Scientific) for 30 min, and then stained with PI reagent (50 μg/ml, R37169, Invitrogen) for 30 min in darkness. After that, cell cycle distribution was analyzed by a flow cytometer (FACSVerse, BD, USA).
For cell apoptosis detection, an Annexin V-FITC/PI cell apoptosis detection kit (40302ES20, Yeasen) was used. WT9-12 cells were suspended in Annexin-binding buffer, and then stained with FITC-Annexin V (5 μl) and PI (10 μl) reagents for 15 min in darkness. After that, the apoptotic cells were tested by a flow cytometer (FACSVerse, BD, USA).
Measurement of ATP levels
According to the manufacturer’s protocols, ATP levels in WT9-12 cells were measured by the ATP Detection kit (S0026, Beyotime). Briefly, cells were lysed using the lysis buffer, and then centrifuged at 12000 g at 4° C for 5 min. The cell supernatant was collected. 100 μL of ATP reagent was added into a tube for 5 min at room temperature. Next, 20 μL of supernatant were then added into each tube. The results were detected by using a luminometer (Thermo Fisher Scientific, USA).
Detection of mitochondrial membrane potential (MMP)
The MMP of WT9-12 cells was evaluated by a MMP detection kit with JC-1 (M8650, Solarbio). WT9-12 cells were cultured in a 6-well plate overnight at 37° C, and then stained with JC-1 staining solution at 37° C for 20 min. A fluorescence microscope (CKX31, Olympus) was applied to capture the fluorescence signals of the JC-1 aggregates (red color) and monomers (green color). The MMP level of cells was considered as the ratio of red/green fluorescence intensity.
Statistical analysis
Each experiment was independently repeated at least three times. Data were expressed as mean ± standard deviation (SD). The differences between two groups were detected with an unpaired Student t-test. P < 0.05 indicates statistical significance.
Availability of data and materials
The dataset GSE7869 analyzed in this study was acquired from the Gene Expression Omnibus (GEO) database (https://www.ncbi.nlm.nih.gov/geo/).
Results
ACOT13 was reduced in renal cystic tissues
Based on the data in the GSE7869 dataset, we found that compared to normal renal cortical tissues, ACOT13 level was obviously reduced in renal cystic tissues (Figure 1A). Additionally, the GSE7869 dataset included four types of renal cystic tissues (minimally cystic tissue, small cysts, medium cysts, large cysts). As shown in Supplementary Figure 1, ACOT13 level was notably reduced in these four types of renal cystic tissues compared to normal renal cortical tissues. Among these, ACOT13 level was the lowest in small cysts (Supplementary Figure 1).
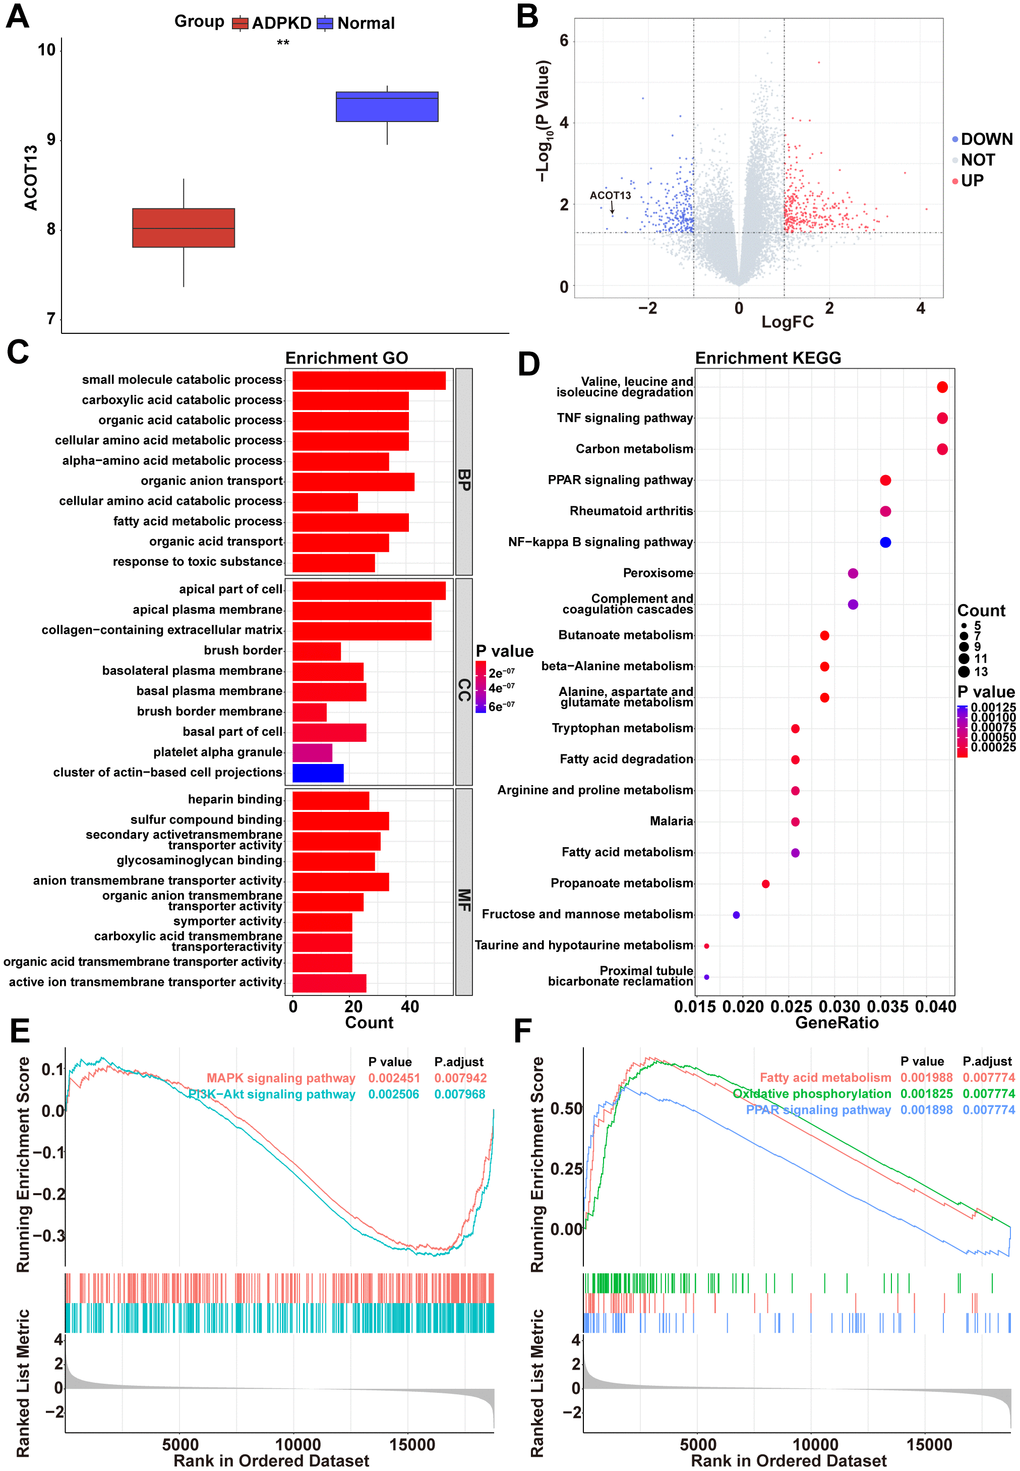
Figure 1. ACOT13 was reduced in renal cystic tissues. (A) The box plot showed the ACOT13 level in normal and ADPKD tissues in the GSE7869 dataset. (B) The volcano plot displayed DEGs between H- and L-ACOT13 groups. Blue color represents downregulated genes; red color indicates upregulated genes. (C) GO analysis including top 10 BP, top 10 CC and top 10 MF terms. (D) Top 20 KEGG pathways. (E) Enrichment of genes in the MAPK signaling pathway and PI3K-AKT signaling pathway by GSEA. (F) Enrichment of genes in the fatty acid metabolism, oxidative phosphorylation and PPAR signaling pathway by GSEA.
To analyze the possible pathways associated with ACOT13 in ADPKD, DEGs were screened between H- and L-ACOT13 groups. Compared to the L-ACOT13 group, a total of 632 DEGs were found in the H-ACOT13 group (Figure 1B). Next, different functional analyses were performed on these 632 DEGs. GO results showed that these genes were appeared in 1398 GO terms (e.g. small molecule catabolic process, apical part of cell and heparin binding) (Figure 1C and Supplementary Table 1). KEGG results showed that 58 KEGG pathways (e.g. PPAR signaling pathway, NF-kappa B signaling pathway, FoxO signaling pathway) were related to these genes (Figure 1D and Supplementary Table 1). Moreover, GSEA results showed that compared to the L-ACOT13 group, 177 pathways including PI3K-Akt signaling pathway and MAPK signaling pathway (two mitochondrial dependent apoptosis pathways) [20, 21], and PPAR signaling pathway (a pathway that could regulate mitochondrial function) [22], and fatty acid metabolism and oxidative phosphorylation (two processes that occurs in mitochondria) [23], were more enriched in the H-ACOT13 group (Figure 1E, 1F and Supplementary Table 2). The data in Figure 1E, 1F showed that compared to the L-ACOT13 group, PI3K-Akt and MAPK signaling pathways were inactivated in the H-ACOT13 group, and PPAR signaling pathway, fatty acid metabolism and oxidative phosphorylation were activated in the H-ACOT13 group. These results showed that ACOT13 may play a role in regulating mitochondrial function in ADPKD.
The relationship between ACOT13 and mitochondria-associated genes (Mito-RGs) in ADPKD
1140 Mito-RGs were acquired from the MitoCarta3.0 database (http://www.broadinstitute.org/mitocarta). To explore the relationship between ACOT13 and Mito-RGs in ADPKD, the venn diagram was used to screen the overlapping mitochondria-related DEGs. As shown in Figure 2A, 2B, there were 55 mitochondria-related genes between H- and L-ACOT13 groups. GO and KEGG analyses were then performed on these 55 genes. GO results showed that these genes were appeared in 329 GO terms (e.g. carboxylic acid catabolic process, mitochondrial matrix, fatty acid oxidation and lipid oxidation) (Figure 2C and Supplementary Table 3). KEGG results showed that 25 KEGG pathways (e.g. Fatty acid metabolism and PPAR signaling pathway) were related to these genes (Figure 2D and Supplementary Table 3).
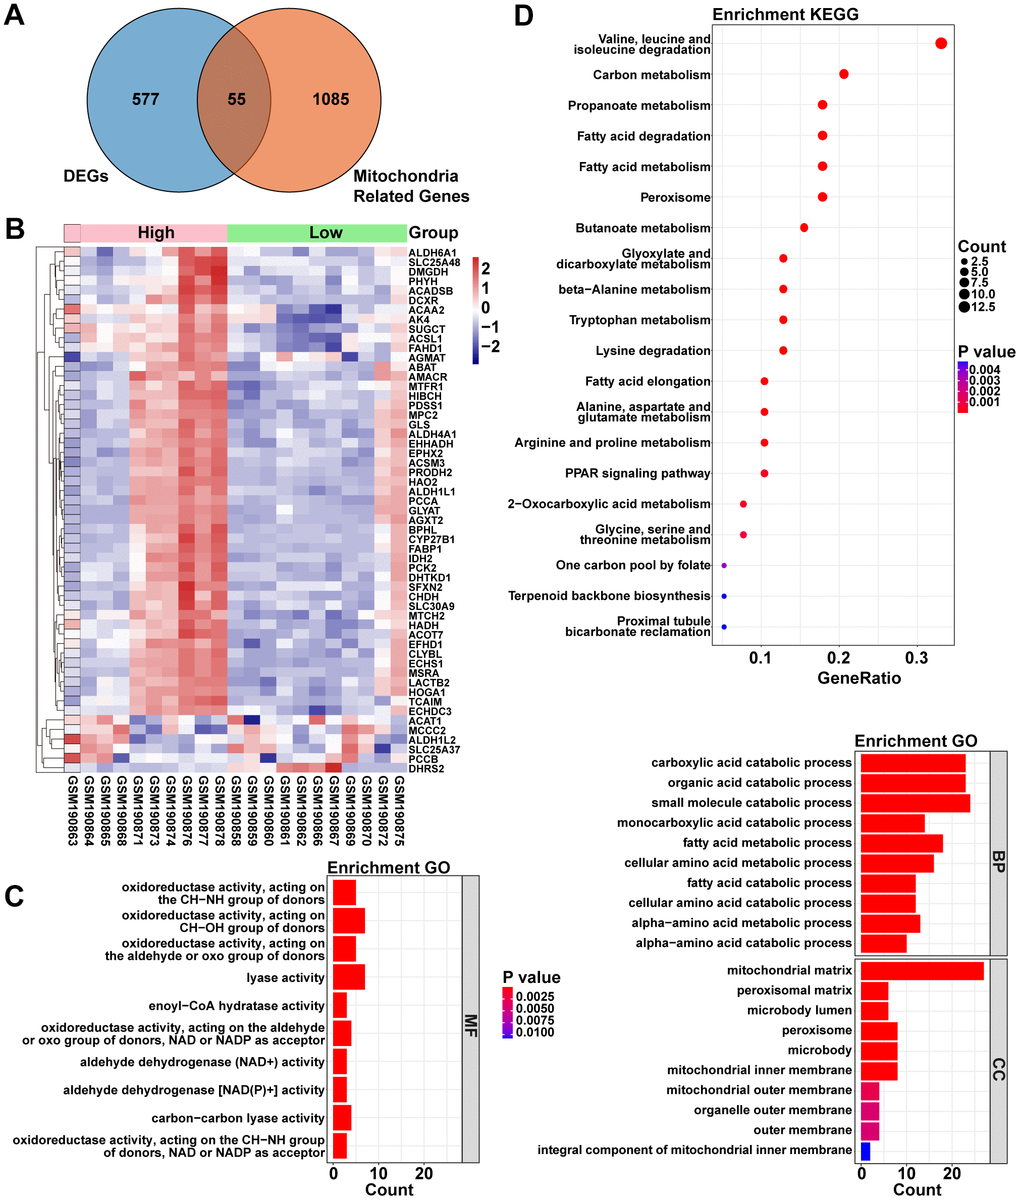
Figure 2. The relationship between ACOT13 and mitochondria-associated genes (Mito-RGs) in ADPKD. (A) The common genes (mitochondria-related DEGs) between DEGs and mitochondria-associated genes were screened by Venn. (B) Heatmap showed the mitochondria-related DEGs between H- and L-ACOT13 groups. Blue color represents downregulated genes; red color indicates upregulated genes. (C) GO analysis including top 10 BP, top 10 CC and top 10 MF terms. (D) Top 20 KEGG pathways.
ACOT13 was downregulated in an ADPKD cell line (WT9-12)
To explore the role of ACOT13 in ADPKD in vitro, ACOT13 level was evaluated in WT9-12 cells first. The data showed that the mRNA and protein level of ACOT13 was obviously reduced in WT9-12 cells compared to HK-2 cells (Figure 3A, 3B). Meanwhile, compared to the control group, the mRNA and protein level of ACOT13 was remarkably elevated in WT9-12 cells transfected with ACOT13 OE plasmids (Figure 3C, 3D).
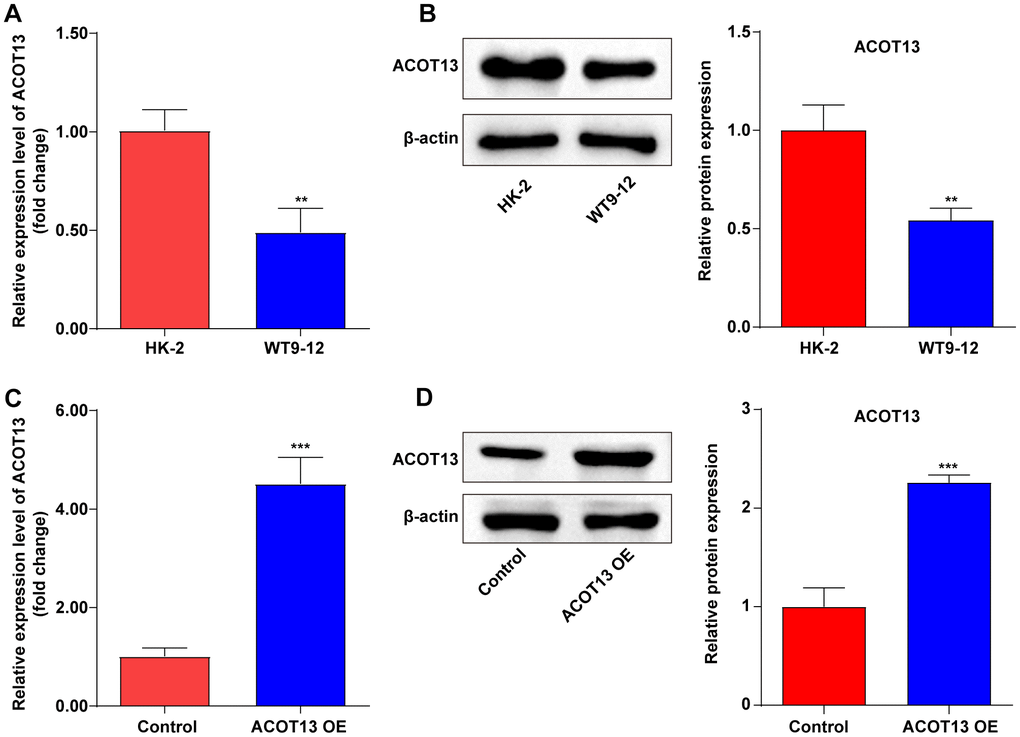
Figure 3. ACOT13 was downregulated in WT9-12 cells. (A) RT-qPCR was used to determine ACOT13 mRNA level in HK-2 and WT9-12 cells. **P<0.01 vs. HK-2 group. (B) Western blot assays were applied to assess ACOT13 protein level in HK-2 and WT9-12 cells. **P<0.01 vs. HK-2 group. (C) RT-qPCR was used to determine ACOT13 mRNA level in WT9-12 cells transfected with ACOT13 OE plasmids. ***P<0.001 vs. control group. (D) Western blot assays were applied to assess ACOT13 protein level in WT9-12 cells transfected with ACOT13 OE plasmids. ***P<0.001 vs. control group.
ACOT13 overexpression suppressed WT9-12 cell viability and proliferation
Next, the functional roles of ACOT13 in WT9-12 cells were then investigated by CCK-8 and EdU staining assays. ACOT13 overexpression induced about 9% growth inhibition in WT9-12 cells at 24 h, induced about 22% growth inhibition in WT9-12 cells at 48 h and induced about 32% growth inhibition in WT9-12 cells at 72 h (Figure 4A), suggesting that ACOT13 overexpression could decline WT9-12 cell viability. Additionally, ACOT13 overexpression obviously decreased the percentage of EdU positive cells (~61%) compared with control group (~92%), indicating that ACOT13 overexpression could suppress WT9-12 cell proliferation (Figure 4B, 4C). Collectively, ACOT13 overexpression was able to suppress WT9-12 cell viability and proliferation.
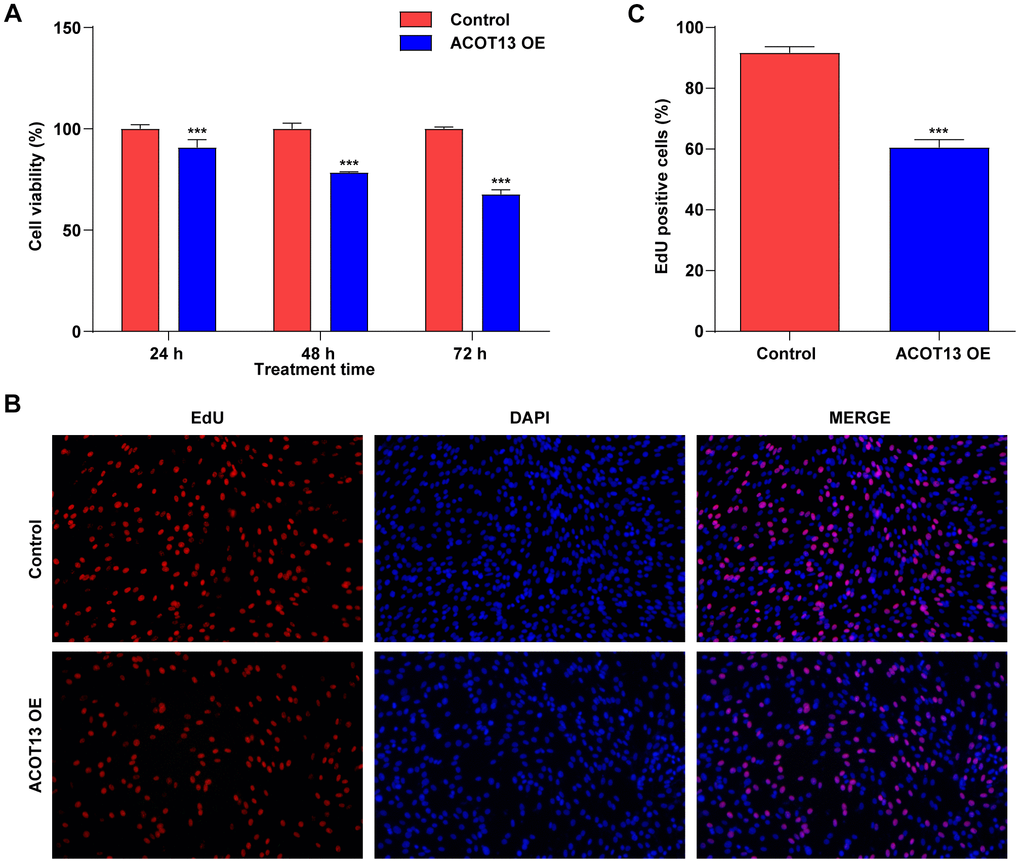
Figure 4. ACOT13 overexpression suppressed WT9-12 cell viability and proliferation. WT9-12 cells were transfected with ACOT13 OE plasmids. Cell viability and proliferation were determined using the (A) CCK-8 and (B, C) EdU staining (magnification, 200×) assays, respectively. ***P<0.001 vs. control group.
ACOT13 overexpression triggered WT9-12 cell cycle arrest and apoptosis
We further explored the effects of ACOT13 on the cell cycle and apoptosis in WT9-12 cells. As revealed in Figure 5A, 5B, compared with control group (~55%), the percentage of WT9-12 cells in the G0/G1 phase increased to ~ 63% after transfection with ACOT13 OE. Meanwhile, the percentage of ACOT13 OE-transfected WT9-12 cells in the S phase declined to ~ 17% compared with control group (~29%) (Figure 5A, 5B). Collectively, ACOT13 overexpression could lead to an increase in the G0/G1 phase population, but a reduction in the S phase population in WT9-12 cells, suggesting that ACOT13 overexpression could induce cell cycle arrest at G0/G1 phase. Additionally, ACOT13 overexpression obviously elevated the percentage of apoptotic cells (~32%) compared with control group (~10%), indicating that ACOT13 could trigger WT9-12 cell apoptosis (Figure 5C, 5D). To sum up, ACOT13 could induce WT9-12 cell cycle arrest and apoptosis.
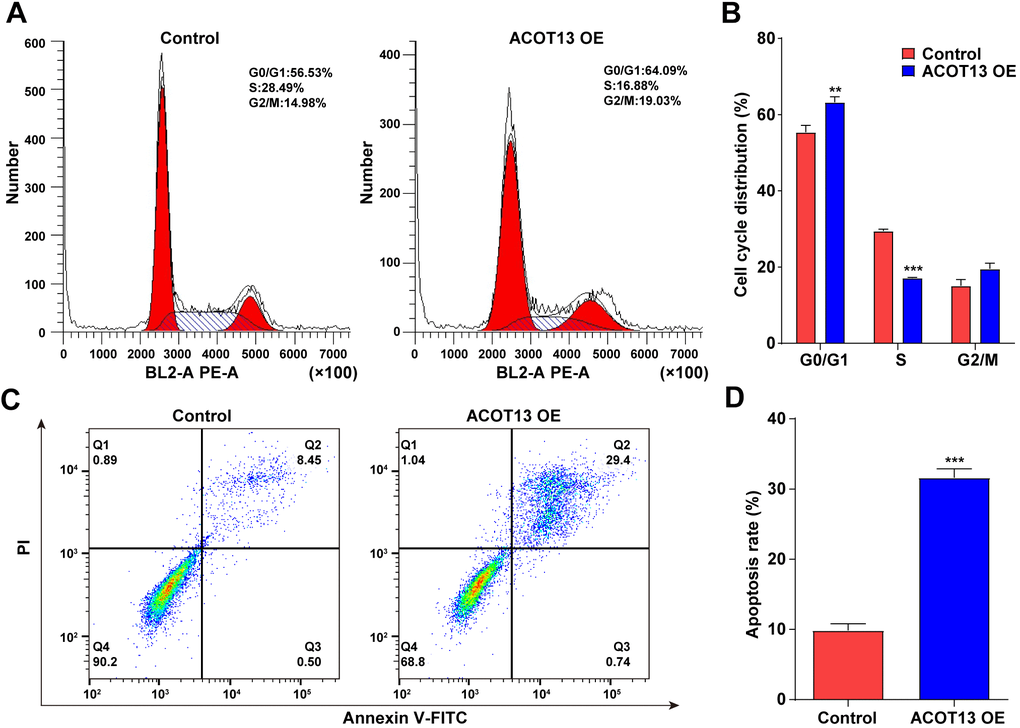
Figure 5. ACOT13 overexpression triggered WT9-12 cell cycle arrest and apoptosis. WT9-12 cells were transfected with ACOT13 OE plasmids. (A, B) Cell cycle distribution and (C, D) cell apoptosis were analyzed by the flow cytometry analysis. **P<0.01, ***P<0.001 vs. control group.
ACOT13 overexpression induced mitochondria damage in WT9-12 cells
Mitochondria could provide cellular energy for cell growth through the generation of ATP [24, 25]. When mitochondria are damaged, a decreased ATP production and a loss of MMP were observed in damaged cells [26]. Thus, we explored the effect of ACOT13 on mitochondria function in WT9-12 cells. As indicated in Figure 6A, compared with control group, the ATP level was reduced by 70% in ACOT13 OE-transfected WT9-12 cells, indicating that overexpression of ACOT13 could decline the ATP level in WT9-12 cells. Additionally, upregulation of ACOT13 obviously reduced the MMP level in WT9-12 cells compared to control group (Figure 6B). These results illustrated that forced expression of ACOT13 could induce mitochondria damage in WT9-12 cells.
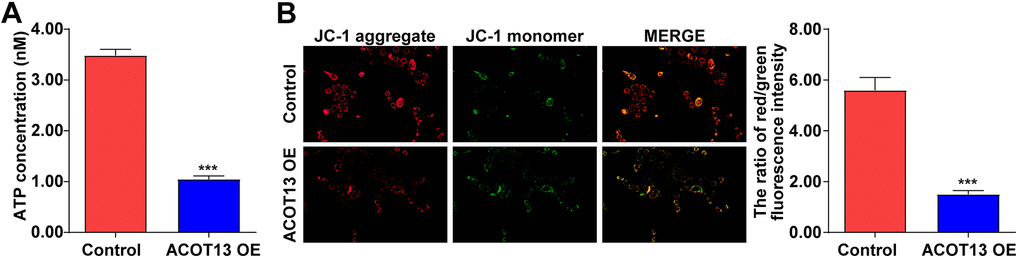
Figure 6. ACOT13 overexpression induced mitochondria damage in WT9-12 cells. WT9-12 cells were transfected with ACOT13 OE plasmids. (A) The ATP concentration in cells were detected using an ELISA kit. (B) JC-1 staining was performed to evaluate the MMP level (the ratio of red/green fluorescence intensity) in WT9-12 cells (magnification, 200×). ***P<0.001 vs. control group.
ACOT13 overexpression affected proliferation- and apoptosis-related proteins in WT9-12 cells
Next, Western blot was performed to evaluate proliferation- (PCNA and ki67) and apoptosis-related (cleaved caspase 3) proteins in WT9-12 cells. As shown in Figure 7A, 7B, overexpression of ACOT13 notably declined PCNA and ki67 levels and increased cleaved caspase 3 levels in WT9-12 cells compared with control group. These results showed that ACOT13 overexpression could affect WT9-12 cell proliferation and apoptosis via modulating PCNA, ki67 and cleaved caspase 3 levels.
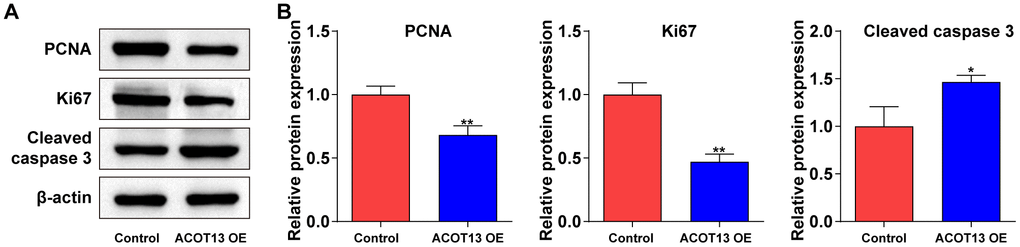
Figure 7. ACOT13 overexpression affected proliferation- and apoptosis-related proteins in WT9-12 cells. WT9-12 cells were transfected with ACOT13 OE plasmids. (A, B) Western blot assay was used to measure PCNA, Ki67 and cleaved caspase 3 expression levels in WT9-12 cells. *P<0.05, **P<0.01 vs. control group.
Discussion
It has been shown that many fluid-filled cysts can be observed in the kidneys of ADPKD patients [27]. With the cyst size increase, cysts can cause stress on normal kidney tissues and may lead to a gradual decline in kidney function, eventually leading to ESRD [27]. Promoting the enlargement of renal cysts could accelerate ADPKD progression [28]. Conversely, inhibiting cyst enlargement and proliferation could prevent the development of ADPKD [29]. For example, Shen et al. found that sorting nexin 9 (SNX9) level was notably reduced in ADPKD patients, and SNX9 overexpression was able to suppress WT9-12 cell proliferation and prevent renal cyst formation [30].
Elliott et al. indicated that the phosphorylation level of c-Src was strongly elevated in ADPKD epithelial cells, inactivation of c-Src could suppress ADPKD cell proliferation and extracellular matrix-attachment in vitro, as well as reduce cyst formation in ADPKD mice in vivo [31]. Li et al. reported that DJ-1 upregulation was capable of improving renal dysfunction and reducing cyst growth in kidney tissues of ADPKD mice [32]. Xu et al. showed that inhibition of COX-2 was able to suppress ADPKD epithelial cell proliferation and trigger cell apoptosis [33]. These findings demonstrated that a number of genes were dysexpressed in ADPKD, and play important roles in ADPKD development. In the current research, we confirmed that the mRNA and protein level of ACOT13 were greatly declined in ADPKD tissues as well as in ADPKD cell line (WT9-12). ACOT13 overexpression could notably suppress WT9-12 cell proliferation and cell cycle progression and trigger cell apoptosis. Consistent with the previous studies, we found that ACOT13 could attenuate ADPKD progression via inhibiting cell proliferation and inducing cell apoptosis [30, 33]. For the first time, we demonstrated that ACOT13 plays important roles in ADPKD development.
ACOT13 (Them2) is a mitochondria-associated Acot gene, which could regulate fatty acids, lipid and glucose metabolism [34–36]. It has been shown that mitochondrial dysfunction and dysregulation of cell metabolism is closely related to the pathogenesis of ADPKD [37, 38]. Fatty acid metabolism is a kind of energy metabolism including fatty acid oxidation and synthesis, which plays crucial roles in maintaining normal physiological function of the body [39]. Fatty acid β-oxidation occurs primarily in mitochondria and it has been found to be impaired in ADPKD [23, 40]. Regaining fatty acid β-oxidation may be a promising approach to attenuate renal injury in mice with chronic kidney disease [41]. Kawano et al. indicated that ACOT13 could enhance mitochondrial oxidation of fatty acids in liver [35], revealing an association between ACOT13 and fatty acid oxidation in mitochondria. Meanwhile, in this study, we found that ACOT13 overexpression could reduce WT9-12 cell proliferation, demonstrating that ACOT13 exerted a protective role in ADPKD. Additionally, to further explore the functional role of ACOT13 in ADPKD, DEGs were screened between H- and L-ACOT13 groups in the GSE7869 dataset and these DEGs may be participated in the protective role of ACOT13 in ADPKD. Thereafter, to uncover potential signaling pathways associated with these DEGs, GSEA was conducted. The results showed that compared to the L-ACOT13 group, PPAR signaling pathway and fatty acid metabolism were more activated in the H-ACOT13 group. Thus, we suspected that ACOT13 may attenuate ADPKD progression via affecting fatty acid metabolism. This is the first time to show the relationship between ACOT13 and fatty acid metabolism in ADPKD. Additionally, PPARs are fatty acid-activated transcription factors playing a crucial role in maintaining energy metabolism (e.g. fatty acid β-oxidation) [42, 43]. Lakhia et al. reported that PPARα overexpression could inhibit kidney cyst proliferation in ADPKD through enhancing fatty acid β-oxidation [23]. Collectively, we suspected that ACOT13 may regulate mitochondrial fatty acid β-oxidation through PPAR signaling, thereby attenuating ADPKD progression. Nevertheless, further studies are needed to clarify the molecular mechanism of ACOT13 in ADPKD in the future.
In ADPKD, the abnormal increase in renal epithelial cell growth leads to the development of numerous fluid-filled cysts, and a progressive renal dysfunction [44]. Ki67 and PCNA are commonly used as markers for cell proliferation, and high levels of ki67 and PCNA are associated with increased cell growth [45, 46]. In this study, we found that ACOT13 overexpression could decline PCNA and ki67 protein levels WT9-12 cells, suggesting that ACOT13 overexpression could inhibit WT9-12 cell proliferation through downregulating PCNA and ki67.
Cell apoptosis exerts key roles in ADPKD development [47]. Evidence have shown that apoptosis is an early event in ADPKD [48, 49]. For example, Lin et al. found that apoptosis exerted an essential role in the formation of Madin-Darby canine kidney cell cysts, and inhibition of cell apoptosis could suppress the cystogenesis [50]. Conversely, worsening ADPKD may related to the declined apoptosis [47]. Chen et al. showed that MIF knockdown notably triggered cyst-lining epithelia cell apoptosis, and suppressed renal cyst formation in ADPKD mice [51]. Consistent with Chen et al.’s finding, our results showed that ACOT13 overexpression obviously triggered WT9-12 cell apoptosis via upregulating cleaved caspase 3, suggested that ACOT13 could attenuate ADPKD progression via inducing cell apoptosis. Furthermore, ACOT13 overexpression strongly reduced ATP production and MMP level in WT9-12 cell, suggesting that ACOT13 could lead to mitochondria damage in WT9-12 cells. Mitochondria-related apoptosis has been reported to be related to the loss of MMP and reduced ATP generation [52]. These data demonstrated that ACOT13 could induce mitochondrial-mediated apoptosis in WT9-12 cells. Additionally, GSEA results showed that PI3K/Akt and MAPK signaling pathways were obviously inactivated in the H-ACOT13 group. PI3K/Akt and MAPK signalings are two mitochondrial dependent apoptosis pathways [53]. Inhibition of PI3K/Akt and MAPK/ERK signalings could lead to mitochondrial-mediated cell apoptosis [54]. Therefore, we suspected that ACOT13 may enhance mitochondrial-mediated cell apoptosis via inactivating PI3K/Akt and MAPK signalings, which needed to be further explored in the future.
Conclusions
Collectively, our results showed that ACOT13 level was greatly reduced in WT9-12 cells as well as in renal cystic tissues. Overexpression of ACOT13 remarkably suppressed WT9-12 cell proliferation and triggered mitochondrial-mediated cell apoptosis, suggesting that ACOT13 may exert a protective role in ADPKD. These findings revealed that ACOT13 may be a potential option for the treatment of ADPKD.
Supplementary Materials
Author Contributions
Conceptualization: Bin Wang; Methodology: Bin Wang; Software: Bin Wang, Qi Yang; Formal analysis: Bin Wang, Qi Yang; Data curation: Bin Wang, Qi Yang, Lihe Che; Writing - original draft: Bin Wang; Writing - review and editing: Luyao Sun, Na Du; Visualization: Qi Yang, Lihe Che, Luyao Sun; Project administration: Bin Wang; Funding acquisition: Na Du. All authors read and approved the final version to be published.
Conflicts of Interest
There are no conflicts of interest to report regarding the publication of this article.
Funding
This study was funded by the Jilin Provincial Commission of Health and Construction (Project number: 2022JC059), and the project name is “Study on the function and mechanism of ACOT13 regulating PPARα expression to promote polycystic kidney disease”.
References
- 1. Alam A. Risk factors for progression in ADPKD. Curr Opin Nephrol Hypertens. 2015; 24:290–4. https://doi.org/10.1097/MNH.0000000000000113 [PubMed]
- 2. Kim DY, Park JH. Genetic Mechanisms of ADPKD. Adv Exp Med Biol. 2016; 933:13–22. https://doi.org/10.1007/978-981-10-2041-4_2 [PubMed]
- 3. Gaur P, Gedroyc W, Hill P. ADPKD-what the radiologist should know. Br J Radiol. 2019; 92:20190078. https://doi.org/10.1259/bjr.20190078 [PubMed]
- 4. Oh YK, Park HC, Ryu H, Kim YC, Oh KH. Clinical and genetic characteristics of Korean autosomal dominant polycystic kidney disease patients. Korean J Intern Med. 2021; 36:767–79. https://doi.org/10.3904/kjim.2021.176 [PubMed]
- 5. Chebib FT, Perrone RD, Chapman AB, Dahl NK, Harris PC, Mrug M, Mustafa RA, Rastogi A, Watnick T, Yu AS, Torres VE. A Practical Guide for Treatment of Rapidly Progressive ADPKD with Tolvaptan. J Am Soc Nephrol. 2018; 29:2458–70. https://doi.org/10.1681/ASN.2018060590 [PubMed]
- 6. Mekahli D, Guay-Woodford LM, Cadnapaphornchai MA, Greenbaum LA, Litwin M, Seeman T, Dandurand A, Shi L, Sikes K, Shoaf SE, Schaefer F. Tolvaptan for Children and Adolescents with Autosomal Dominant Polycystic Kidney Disease: Randomized Controlled Trial. Clin J Am Soc Nephrol. 2023; 18:36–46. https://doi.org/10.2215/CJN.0000000000000022 [PubMed]
- 7. Barnawi RA, Attar RZ, Alfaer SS, Safdar OY. Is the light at the end of the tunnel nigh? A review of ADPKD focusing on the burden of disease and tolvaptan as a new treatment. Int J Nephrol Renovasc Dis. 2018; 11:53–67. https://doi.org/10.2147/IJNRD.S136359 [PubMed]
- 8. Andrieux P, Chevillard C, Cunha-Neto E, Nunes JP. Mitochondria as a Cellular Hub in Infection and Inflammation. Int J Mol Sci. 2021; 22:11338. https://doi.org/10.3390/ijms222111338 [PubMed]
- 9. Wanet A, Arnould T, Najimi M, Renard P. Connecting Mitochondria, Metabolism, and Stem Cell Fate. Stem Cells Dev. 2015; 24:1957–71. https://doi.org/10.1089/scd.2015.0117 [PubMed]
- 10. Bhargava P, Schnellmann RG. Mitochondrial energetics in the kidney. Nat Rev Nephrol. 2017; 13:629–46. https://doi.org/10.1038/nrneph.2017.107 [PubMed]
- 11. Duann P, Lin PH. Mitochondria Damage and Kidney Disease. Adv Exp Med Biol. 2017; 982:529–51. https://doi.org/10.1007/978-3-319-55330-6_27 [PubMed]
- 12. Pellegrini H, Sharpe EH, Liu G, Nishiuchi E, Doerr N, Kipp KR, Chin T, Schimmel MF, Weimbs T. Cleavage fragments of the C-terminal tail of polycystin-1 are regulated by oxidative stress and induce mitochondrial dysfunction. J Biol Chem. 2023; 299:105158. https://doi.org/10.1016/j.jbc.2023.105158 [PubMed]
- 13. Zhang HF, Liu HM, Xiang JY, Zhou XC, Wang D, Chen RY, Tan WL, Liang LQ, Liu LL, Shi MJ, Zhang F, Xiao Y, Zhou YX, et al. Alpha lipoamide inhibits diabetic kidney fibrosis via improving mitochondrial function and regulating RXRα expression and activation. Acta Pharmacol Sin. 2023; 44:1051–65. https://doi.org/10.1038/s41401-022-00997-1 [PubMed]
- 14. Liao X, Lv X, Zhang Y, Han Y, Li J, Zeng J, Tang D, Meng J, Yuan X, Peng Z, Tao L, Xie Y. Fluorofenidone Inhibits UUO/IRI-Induced Renal Fibrosis by Reducing Mitochondrial Damage. Oxid Med Cell Longev. 2022; 2022:2453617. https://doi.org/10.1155/2022/2453617 [PubMed]
- 15. Ishimoto Y, Inagi R, Yoshihara D, Kugita M, Nagao S, Shimizu A, Takeda N, Wake M, Honda K, Zhou J, Nangaku M. Mitochondrial Abnormality Facilitates Cyst Formation in Autosomal Dominant Polycystic Kidney Disease. Mol Cell Biol. 2017; 37:e00337–17. https://doi.org/10.1128/MCB.00337-17 [PubMed]
- 16. Kang HW, Niepel MW, Han S, Kawano Y, Cohen DE. Thioesterase superfamily member 2/acyl-CoA thioesterase 13 (Them2/Acot13) regulates hepatic lipid and glucose metabolism. FASEB J. 2012; 26:2209–21. https://doi.org/10.1096/fj.11-202853 [PubMed]
- 17. Du N, Dong D, Sun L, Che L, Li X, Liu Y, Wang B. Identification of ACOT13 and PTGER2 as novel candidate genes of autosomal dominant polycystic kidney disease through whole exome sequencing. Eur J Med Res. 2021; 26:142. https://doi.org/10.1186/s40001-021-00613-8 [PubMed]
- 18. Ritchie ME, Phipson B, Wu D, Hu Y, Law CW, Shi W, Smyth GK. limma powers differential expression analyses for RNA-sequencing and microarray studies. Nucleic Acids Res. 2015; 43:e47. https://doi.org/10.1093/nar/gkv007 [PubMed]
- 19. Yu G, Wang LG, Han Y, He QY. clusterProfiler: an R package for comparing biological themes among gene clusters. OMICS. 2012; 16:284–7. https://doi.org/10.1089/omi.2011.0118 [PubMed]
- 20. Liu B, Li Z. Black Currant (Ribes nigrum L.) Extract Induces Apoptosis of MKN-45 and TE-1 Cells Through MAPK- and PI3K/Akt-Mediated Mitochondrial Pathways. J Med Food. 2016; 19:365–73. https://doi.org/10.1089/jmf.2015.3521 [PubMed]
- 21. Luo G, Zhou J, Li G, Hu N, Xia X, Zhou H. Retracted: Ferruginol Diterpenoid Selectively Inhibits Human Thyroid Cancer Growth by Inducing Mitochondrial Dependent Apoptosis, Endogenous Reactive Oxygen Species (ROS) Production, Mitochondrial Membrane Potential Loss and Suppression of Mitogen-Activated Protein Kinase (MAPK) and PI3K/AKT Signaling Pathways. Med Sci Monit. 2021; 27:e932341. https://doi.org/10.12659/MSM.932341 [PubMed]
- 22. Sharma S, Sun X, Rafikov R, Kumar S, Hou Y, Oishi PE, Datar SA, Raff G, Fineman JR, Black SM. PPAR-γ regulates carnitine homeostasis and mitochondrial function in a lamb model of increased pulmonary blood flow. PLoS One. 2012; 7:e41555. https://doi.org/10.1371/journal.pone.0041555 [PubMed]
- 23. Lakhia R, Yheskel M, Flaten A, Quittner-Strom EB, Holland WL, Patel V. PPARα agonist fenofibrate enhances fatty acid β-oxidation and attenuates polycystic kidney and liver disease in mice. Am J Physiol Renal Physiol. 2018; 314:F122–31. https://doi.org/10.1152/ajprenal.00352.2017 [PubMed]
- 24. Stamerra CA, Di Giosia P, Giorgini P, Ferri C, Sukhorukov VN, Sahebkar A. Mitochondrial Dysfunction and Cardiovascular Disease: Pathophysiology and Emerging Therapies. Oxid Med Cell Longev. 2022; 2022:9530007. https://doi.org/10.1155/2022/9530007 [PubMed]
- 25. Sutherland TC, Sefiani A, Horvat D, Huntington TE, Lei Y, West AP, Geoffroy CG. Age-Dependent Decline in Neuron Growth Potential and Mitochondria Functions in Cortical Neurons. Cells. 2021; 10:1625. https://doi.org/10.3390/cells10071625 [PubMed]
- 26. Luan G, Li G, Ma X, Jin Y, Hu N, Li J, Wang Z, Wang H. Dexamethasone-Induced Mitochondrial Dysfunction and Insulin Resistance-Study in 3T3-L1 Adipocytes and Mitochondria Isolated from Mouse Liver. Molecules. 2019; 24:1982. https://doi.org/10.3390/molecules24101982 [PubMed]
- 27. Formica C, Peters DJ. Molecular pathways involved in injury-repair and ADPKD progression. Cell Signal. 2020; 72:109648. https://doi.org/10.1016/j.cellsig.2020.109648 [PubMed]
- 28. Pinto CS, Raman A, Reif GA, Magenheimer BS, White C, Calvet JP, Wallace DP. Phosphodiesterase Isoform Regulation of Cell Proliferation and Fluid Secretion in Autosomal Dominant Polycystic Kidney Disease. J Am Soc Nephrol. 2016; 27:1124–34. https://doi.org/10.1681/ASN.2015010047 [PubMed]
- 29. Cabrita I, Kraus A, Scholz JK, Skoczynski K, Schreiber R, Kunzelmann K, Buchholz B. Cyst growth in ADPKD is prevented by pharmacological and genetic inhibition of TMEM16A in vivo. Nat Commun. 2020; 11:4320. https://doi.org/10.1038/s41467-020-18104-5 [PubMed]
- 30. Shen AW, Fu LL, Lin L, Sun B, Song DX, Wang WT, Wang YH, Yin PR, Yu SQ. SNX9 Inhibits Cell Proliferation and Cyst Development in Autosomal Dominant Polycystic Kidney Disease via Activation of the Hippo-YAP Signaling Pathway. Front Cell Dev Biol. 2020; 8:811. https://doi.org/10.3389/fcell.2020.00811 [PubMed]
- 31. Elliott J, Zheleznova NN, Wilson PD. c-Src inactivation reduces renal epithelial cell-matrix adhesion, proliferation, and cyst formation. Am J Physiol Cell Physiol. 2011; 301:C522–9. https://doi.org/10.1152/ajpcell.00163.2010 [PubMed]
- 32. Li Z, Zhou J, Li Y, Yang F, Lian X, Liu W. Overexpression of DJ-1 alleviates autosomal dominant polycystic kidney disease by regulating cell proliferation, apoptosis, and mitochondrial metabolism in vitro and in vivo. Ann Transl Med. 2020; 8:1175. https://doi.org/10.21037/atm-20-5761 [PubMed]
- 33. Xu T, Wang NS, Fu LL, Ye CY, Yu SQ, Mei CL. Celecoxib inhibits growth of human autosomal dominant polycystic kidney cyst-lining epithelial cells through the VEGF/Raf/MAPK/ERK signaling pathway. Mol Biol Rep. 2012; 39:7743–53. https://doi.org/10.1007/s11033-012-1611-2 [PubMed]
- 34. Kang HW, Ozdemir C, Kawano Y, LeClair KB, Vernochet C, Kahn CR, Hagen SJ, Cohen DE. Thioesterase superfamily member 2/Acyl-CoA thioesterase 13 (Them2/Acot13) regulates adaptive thermogenesis in mice. J Biol Chem. 2013; 288:33376–86. https://doi.org/10.1074/jbc.M113.481408 [PubMed]
- 35. Kawano Y, Ersoy BA, Li Y, Nishiumi S, Yoshida M, Cohen DE. Thioesterase superfamily member 2 (Them2) and phosphatidylcholine transfer protein (PC-TP) interact to promote fatty acid oxidation and control glucose utilization. Mol Cell Biol. 2014; 34:2396–408. https://doi.org/10.1128/MCB.01601-13 [PubMed]
- 36. Kahveci AS, Barnatan TT, Kahveci A, Adrian AE, Arroyo J, Eirin A, Harris PC, Lerman A, Lerman LO, Torres VE, Irazabal MV. Oxidative Stress and Mitochondrial Abnormalities Contribute to Decreased Endothelial Nitric Oxide Synthase Expression and Renal Disease Progression in Early Experimental Polycystic Kidney Disease. Int J Mol Sci. 2020; 21:1994. https://doi.org/10.3390/ijms21061994 [PubMed]
- 37. Lakhia R. The role of PPARα in autosomal dominant polycystic kidney disease. Curr Opin Nephrol Hypertens. 2020; 29:432–8. https://doi.org/10.1097/MNH.0000000000000615 [PubMed]
- 38. Lin CC, Kurashige M, Liu Y, Terabayashi T, Ishimoto Y, Wang T, Choudhary V, Hobbs R, Liu LK, Lee PH, Outeda P, Zhou F, Restifo NP, et al. A cleavage product of Polycystin-1 is a mitochondrial matrix protein that affects mitochondria morphology and function when heterologously expressed. Sci Rep. 2018; 8:2743. https://doi.org/10.1038/s41598-018-20856-6 [PubMed]
- 39. Ménégaut L, Thomas C, Lagrost L, Masson D. Fatty acid metabolism in macrophages: a target in cardio-metabolic diseases. Curr Opin Lipidol. 2017; 28:19–26. https://doi.org/10.1097/MOL.0000000000000370 [PubMed]
- 40. Menezes LF, Lin CC, Zhou F, Germino GG. Fatty Acid Oxidation is Impaired in An Orthologous Mouse Model of Autosomal Dominant Polycystic Kidney Disease. EBioMedicine. 2016; 5:183–92. https://doi.org/10.1016/j.ebiom.2016.01.027 [PubMed]
- 41. Bataille A, Galichon P, Chelghoum N, Oumoussa BM, Ziliotis MJ, Sadia I, Vandermeersch S, Simon-Tillaux N, Legouis D, Cohen R, Xu-Dubois YC, Commereuc M, Rondeau E, et al. Increased Fatty Acid Oxidation in Differentiated Proximal Tubular Cells Surviving a Reversible Episode of Acute Kidney Injury. Cell Physiol Biochem. 2018; 47:1338–51. https://doi.org/10.1159/000490819 [PubMed]
- 42. Christofides A, Konstantinidou E, Jani C, Boussiotis VA. The role of peroxisome proliferator-activated receptors (PPAR) in immune responses. Metabolism. 2021; 114:154338. https://doi.org/10.1016/j.metabol.2020.154338 [PubMed]
- 43. Herman-Edelstein M, Scherzer P, Tobar A, Levi M, Gafter U. Altered renal lipid metabolism and renal lipid accumulation in human diabetic nephropathy. J Lipid Res. 2014; 55:561–72. https://doi.org/10.1194/jlr.P040501 [PubMed]
- 44. Yamaguchi T, Reif GA, Calvet JP, Wallace DP. Sorafenib inhibits cAMP-dependent ERK activation, cell proliferation, and in vitro cyst growth of human ADPKD cyst epithelial cells. Am J Physiol Renal Physiol. 2010; 299:F944–51. https://doi.org/10.1152/ajprenal.00387.2010 [PubMed]
- 45. Juríková M, Danihel Ľ, Polák Š, Varga I. Ki67, PCNA, and MCM proteins: Markers of proliferation in the diagnosis of breast cancer. Acta Histochem. 2016; 118:544–52. https://doi.org/10.1016/j.acthis.2016.05.002 [PubMed]
- 46. Kaya B, Nayki U, Nayki C, Ulug P, Oner G, Gultekin E, Yildirim Y. Proliferation of trophoblasts and Ki67 expression in preeclampsia. Arch Gynecol Obstet. 2015; 291:1041–6. https://doi.org/10.1007/s00404-014-3538-4 [PubMed]
- 47. Nowak KL, Edelstein CL. Apoptosis and autophagy in polycystic kidney disease (PKD). Cell Signal. 2020; 68:109518. https://doi.org/10.1016/j.cellsig.2019.109518 [PubMed]
- 48. Goilav B, Satlin LM, Wilson PD. Pathways of apoptosis in human autosomal recessive and autosomal dominant polycystic kidney diseases. Pediatr Nephrol. 2008; 23:1473–82. https://doi.org/10.1007/s00467-008-0851-9 [PubMed]
- 49. Ibrahim S. Increased apoptosis and proliferative capacity are early events in cyst formation in autosomal-dominant, polycystic kidney disease. ScientificWorldJournal. 2007; 7:1757–67. https://doi.org/10.1100/tsw.2007.274 [PubMed]
- 50. Lin HH, Yang TP, Jiang ST, Yang HY, Tang MJ. Bcl-2 overexpression prevents apoptosis-induced Madin-Darby canine kidney simple epithelial cyst formation. Kidney Int. 1999; 55:168–78. https://doi.org/10.1046/j.1523-1755.1999.00249.x [PubMed]
- 51. Chen L, Zhou X, Fan LX, Yao Y, Swenson-Fields KI, Gadjeva M, Wallace DP, Peters DJ, Yu A, Grantham JJ, Li X. Macrophage migration inhibitory factor promotes cyst growth in polycystic kidney disease. J Clin Invest. 2015; 125:2399–412. https://doi.org/10.1172/JCI80467 [PubMed]
- 52. Zhao Y, Yu S, Wang Y, Chen Y, Chen J, Wang J, Liu M, Wang S. Pueraria protein extract inhibits melanogenesis and promotes melanoma cell apoptosis through the regulation of MITF and mitochondrial-related pathways. Mol Med Rep. 2023; 27:64. https://doi.org/10.3892/mmr.2023.12951 [PubMed]
- 53. Lee HJ, Nagappan A, Park HS, Hong GE, Yumnam S, Raha S, Saralamma VV, Lee WS, Kim EH, Kim GS. Flavonoids isolated from Citrus platymamma induce mitochondrial-dependent apoptosis in AGS cells by modulation of the PI3K/AKT and MAPK pathways. Oncol Rep. 2015; 34:1517–25. https://doi.org/10.3892/or.2015.4122 [PubMed]
- 54. Yuan L, Wang J, Xiao H, Wu W, Wang Y, Liu X. MAPK signaling pathways regulate mitochondrial-mediated apoptosis induced by isoorientin in human hepatoblastoma cancer cells. Food Chem Toxicol. 2013; 53:62–8. https://doi.org/10.1016/j.fct.2012.11.048 [PubMed]