


Introduction
Tuberculosis (TB), caused by Mycobacterium tuberculosis (Mtb), is a contagious disease with a significant global impact on mortality and new case incidence [1, 2]. Each year, millions contract Mtb, and a percentage ranging from 5–15% may progress to pulmonary tuberculosis (PTB), particularly with an increased risk for children [3]. The intricate and time-consuming nature of TB treatment poses challenges for patient adherence [4]. Currently, the specific factors that distinguish PTB from other conditions remain unclear. Existing diagnostic methods, including the tuberculin skin test and interferon-gamma release assay, encounter difficulties in reliably discerning between types of tuberculosis infections, such as PTB and latent tuberculosis infection (LTBI), especially in cases involving malnutrition or concurrent human immunodeficiency virus infection [5–7]. Consequently, there is a pressing need to develop dependable biomarkers for distinguishing these diverse types and progression of tuberculosis infections, providing robust support for more precise diagnosis and treatment.
Prior studies have identified biomarkers for predicting PTB progression, including cytokine levels, blood biochemical indicators, immune cell subsets, and metabolic products [8–10]. Specifically, certain changes in cytokine levels (e.g., IL-1β, IL-2, IL-12, IFNγ, TNFα) reflect the host immune response [8, 11]. However, these biomarkers are prone to interference from individual differences and environmental factors, limiting their applicability. Commonly used blood biochemical indicators like C-reactive protein (CRP) and erythrocyte sedimentation rate (ESR) for PTB detection suffer reduced specificity due to sensitivity to non-specific inflammatory reactions [9, 12, 13]. Technical complexity and individual variations also pose challenges for assessing changes in immune cell subsets (e.g., T cells, B cells) and metabolic products [10, 14, 15].
Neutrophil extracellular traps (NETs) emerge as significant biomarkers in the context of TB, serving as a crucial facet of the host’s defense mechanism against microbial invaders [16, 17]. Particularly noteworthy is their release during Mtb infection, prompting inquiries into their potential impact on the immune dynamics in TB. Beyond their fundamental antimicrobial role, NETs also engage in intricate interactions with inflammation and disease pathology, necessitating a comprehensive exploration of their contribution to the severity of TB [15, 18]. In recent years, the advent of single-cell technology has empowered researchers to conduct thorough analyses of the gene expression and functionality of individual cells [19, 20]. This technological advancement provides a robust tool for unraveling the intricate pathology associated with TB. Consequently, in the field of TB biomarker research, the integration of single-cell data and NETs presents a novel perspective for a more profound comprehension of the disease’s pathogenesis and improved diagnostic methodologies.
Herein, we thoroughly examined single-cell data related to murine Mtb infection, focusing specifically on genes associated with NETs. Our investigation revealed dynamic changes in neutrophils, emphasizing their distinct interactions among TB status across various cell types. Notably, significant activities involving IL1B, G0S2, PTAFR, and CSF3R were observed, suggesting potential therapeutic implications. Through a comprehensive analysis of 31 human TB-related datasets, we systematically explored the expression variations of these four NETs-related genes in TB patients under different clinical conditions. Additionally, a diagnostic biomarker developed based on these core NETs-related genes exhibited promising accuracy. Particularly, we identified potential subtypes of PTB and unveiled unique clinical variations. Intriguingly, our findings also highlighted a significant correlation between the early abundance changes in neutrophils and CD8+ T cells.
Materials and Methods
Data source and preprocessing
In the present study, a single-cell dataset (GEO number: GSE167232) [21] from mice infected with Mtb was obtained, comprising 17,101 cells and spanning 14 cell types: alveolar macrophages 1 (AM_1), AM_2, AM_3, AM_4, interstitial macrophages 1 (IM_1), IM_2, IM_3, IM_4, Monocytes, Neutrophils, Dendritic cells (DC), DC.103+11B-, Macrophages/T-cells, Macrophages/ B-cells. Additionally, the single-cell dataset encompasses three distinct disease states: Infected, Bystander, and Uninfected. Furthermore, 49 transcriptomic studies related to patients with TB and other clinical conditions were obtained from the “curatedTBData” package (https://github.com/wejlab/curatedTBData). To streamline integration, datasets with fewer than 15,000 genes or those not sourced from human peripheral blood were excluded. This refinement resulted in 31 high-quality datasets, including GSE101705 (n = 44) [22], GSE107104 (n = 33) [23], GSE107731 (n = 6), GSE112104 (n = 51) [24], GSE19435 (n = 33) [25], GSE19439 (n = 42) [25], GSE19442 (n = 51) [25], GSE19443 (n = 44) [25], GSE19444 (n = 54) [25], GSE22098 (n = 274) [25], GSE25534 (n = 102) [26], GSE28623 (n = 108) [27], GSE29536 (n = 15) [28], GSE34608 (n = 44) [29], GSE37250 (n = 537) [30], GSE39939 (n = 157) [31], GSE39940 (n = 334) [31], GSE40553 (n = 204) [32], GSE41055 (n = 27) [33], GSE42825 (n = 42) [34], GSE42826 (n = 102) [34], GSE42830 (n = 95) [34], GSE42832 (n = 90) [34], GSE50834 (n = 44) [35], GSE54992 (n = 39) [36], GSE56153 (n = 71) [37], GSE62147 (n = 52) [38], GSE62525 (n = 42) [39], GSE69581 (n = 50) [40], GSE73408 (n = 109) [41], GSE81746 (n = 8) [42], GSE83456 (n = 202) [43], GSE83892 (n = 116) [44], GSE84076 (n = 36) [45], GSE89403 (n = 453) [46], GSE94438 (n = 418) [47], GSETornheim (n = 100). The expression values for these datasets have been standardized in “curatedTBData” package. To mitigate potential batch effects across disparate datasets, the expression profiles corresponding to each dataset were amalgamated into a unified matrix. Subsequently, the Quantile Normalization strategy was implemented to systematically rectify batch effects. Additionally, 69 gene sets related to neutrophil extracellular traps were obtained from published studies [16, 48], with detailed information available in Supplementary Tables 1 and 2.
Significantly, our cohort comprised 31 human TB patients, stratified into four primary categories: healthy controls (Control), individuals with subclinical infection (Subclinical), those diagnosed with extrapulmonary tuberculosis (EPTB), and individuals with pulmonary tuberculosis (PTB), as well as those with latent tuberculosis infection (LTBI). Subclinical denotes a condition where individuals are infected but do not manifest overt symptoms, while EPTB refers to tuberculosis affecting organs or tissues outside the lungs. PTB is the predominant form, instigated by Mtb and typically characterized by pulmonary symptoms. LTBI describes individuals harboring the bacteria without active disease, signifying potential for disease progression.
Calculation of signature score
The Seurat tool’s AddModuleScore function [49] was employed to calculate the signature score for a list of genes, evaluating and integrating module scores for samples based on the expression levels within predefined gene sets.
Cell-cell interactions analysis
CellChat [50] (version 1.6.1) was employed to model intra- and intercellular communication networks based on the abundance of known ligand-receptor (L-R) transcript pairs. To quantify interactions between cell types, a series of functions, including identifyOver ExpressedGenes, identifyOverExpressedInteractions, projectData, computeCommunProb, filterCommunication, aggregateNet, and netAnalysis_computeCentrality, were sequentially applied with default parameters. The mergeCellChat function was utilized to compare the intensity differences between Infected and Bystander, as well as Infected and Uninfected states.
Random forest modeling for TB diagnostics
To assess the predictive capability of IL1B, G0S2, PTAFR, and CSF3R for different diagnostic types among TB patients, including Control, Subclinical, EPTB, PTB, and LTBI, a random forest model was employed with the following steps: (1) The 31 TB patient queues were split into training and testing sets in a 3:1 ratio. It is important to note that patient samples lacking the aforementioned five labels were excluded. (2) IL1B, G0S2, PTAFR, and CSF3R were used as features, and the corresponding diagnostic types of patient samples served as labels. (3) The randomForest function from the “randomForest” package (version 4.7-1.1) [51] was utilized to train a random forest multi-classification model, with the formula: TBStatus ~ IL1B + G0S2 + PTAFR + CSF3R. All parameters were set to their default values. (4) The performance of the random forest model was evaluated using the testing set, and an Area Under the Receiver Operating Characteristic Curve (AUC) curve was plotted.
The strategy for constructing a random forest multi-classification model for the 11-feature gene set, composed of IL1B, G0S2, PTAFR, CSF3R, and their highly interacting genes, remained consistent with the aforementioned approach. It is worth noting that to construct a model effectively predicting the progression stages of TB patients over time, one only needs to replace the labels of different diagnostic types with labels representing different time stages since the onset of TB.
Construction TBSig for predicting the progress of TB patients
To construct a signature related to NETs for predicting disease progression in TB patients, 11 key genes (including IL1R2, MYD88, PTAFR, CSF3R, IL1RAP, IL1R1, CASP1, IL1B, G0S2, IFNG, IL4) inferred by this study are crucial for this purpose. The specific methodology is outlined as follows: (1) Utilizing the “ssgsea” method in GSVA [52] tool to estimate the activity of the gene set comprising these 11 genes in samples from TB patients. (2) Considering that the activity scores in TB patients approximately follow a Gaussian distribution, applying the Maximum Likelihood Estimation (MLE) strategy to estimate the corresponding mean and standard deviation of this distribution. (3) Given the fitted normal distribution, the TBSig score was considered as a continuous score variable X with PDF fX(x), and the cumulative distribution function (CDF) can be obtained from:
According to the above formula, the TBSig score is ranged between 0 and 1.
Heterogeneity analysis in TB patients
The variability of TBSig scores across different diagnostic types in TB patients was assessed using the Gini coefficient and the interquartile range (IQR). The Gini coefficient, a statistical measure of economic inequality within a population, was computed using the Gini function from the “DescTools” R package (version 0.99.52) [53]. This coefficient offered insights into the distribution of TBSig scores among various diagnostic categories. Additionally, the IQR, calculated as the difference between the third quartile (Q3) and the first quartile (Q1), served as another measure to evaluate the spread of TBSig scores within the TB patient population.
Inference of PTB patient subtypes
Given the higher heterogeneity observed in PTB patients compared to other types of patients, including Control, Subclinical, EPTB, and LTBI, it suggests the presence of potential subtypes within this patient category. To address this, the Seurat [49] standard protocol was employed, utilizing the FindClusters function to achieve clustering of PTB patients. The parameters used were “algorithm = original Louvain algorithm; resolution = 0.5.” This resulted in the identification of three distinct subgroups, defined as C1 (n = 478), C2 (n = 408), and C3 (n = 501).
To validate the stability of unsupervised clustering, consensus clustering was performed using the “ConsensusClusterPlus” package (version 1.62.0) [54] with the parameters “maxK = 6, clusterAlg = pam, distance = maximum, pItem = 0.90”. The optimal value of k was determined using the highest and the elbow point of the Delta area plot.
Differentially expressed genes (DEGs) associated with the PTB subtypes
The identification of DEGs among subtypes involved the application of the FindAllMarkers function from the “Seurat” package (version 4.3.0) [55]. Notably, genes meeting the criteria of adjusted p-values (adjusted by Benjamini-Hochberg method) below 0.01 were considered as significantly differentially expressed.
Functional enrichment analysis
To scrutinize distinct biological processes and pathways exhibiting significant differential expression among PTB subtypes, the “clusterProfiler” package (version 4.0.5) [56] was employed. Gene symbols were converted into Entrez IDs using the bitr function for subsequent analysis. Following this, the enrichGO function with the “ont = BP” parameter and the enrichKEGG function were utilized for gene ontology (GO) and KEGG pathway enrichment analysis, respectively. Significantly enriched GO and KEGG terms were identified based on adjusted p-values below 0.05 (adjusted by Benjamini-Hochberg method).
Estimation of cellular compositions in PTB subtypes
Using CIBERSORT [57], the infiltration of immune cell types in different subtypes of PTB was estimated, with the LM22 expression profile as a reference containing 22 cell types and default parameters. Additionally, xCell (version 1.1.0) [58] was employed to assess the abundance of 67 cell types, also with default parameters.
Statistical analysis
Pearson correlations were employed to assess the concordance between groups. Standard statistical tests, including Student’s t-test, Wilcoxon rank-sum test, and Kruskal-Wallis test, were applied to analyze both clinical and expression data in the study. These statistical analyses were conducted using R version 4.3.2.
Availability of data and materials
Transcriptomic data and relevant clinical information for the TB cohorts were extracted from publicly accessible databases, as elaborated in Supplementary Table 1. LL authored and reviewed all the codes, which can be obtained upon request from the corresponding author.
Results
Uncovering the intricacies of cellular changes in TB through the analysis of single-cell data and NET-related genes
We initially acquired single-cell data pertaining to Mtb infection in mice from the research conducted by Pisu et al. [21]. This dataset comprises 17,101 cells and includes comprehensive single-cell clustering and annotation information provided by the research team (Figure 1A; Supplementary Table 1). The dataset delineates three distinct states in mice: Uninfected, Infected, and Bystander (Figure 1B). To gain a nuanced understanding of the alterations in diverse cell types within the murine lung microenvironment prompted by Mtb infection, we used Bystander as a reference and conducted a comparative analysis of cell-type abundance between the Infected and Uninfected states. The findings underscore a pronounced transformation in the Neutrophils cell type during the Infected state (Figure 1C). To further substantiate the dynamic changes in Neutrophils across various states of TB, we conducted a thorough analysis of cell-cell communication (see Materials and Methods). The observed differences in cell-type interactions between states revealed an augmented interaction between Neutrophils and Macrophages/T-cells during the Infected state compared to the Uninfected and Bystander states (Figure 1D). This heightened interaction implies a more robust immune response when addressing Mtb infection, reinforcing the pivotal role of Neutrophils cells in the progression of TB.
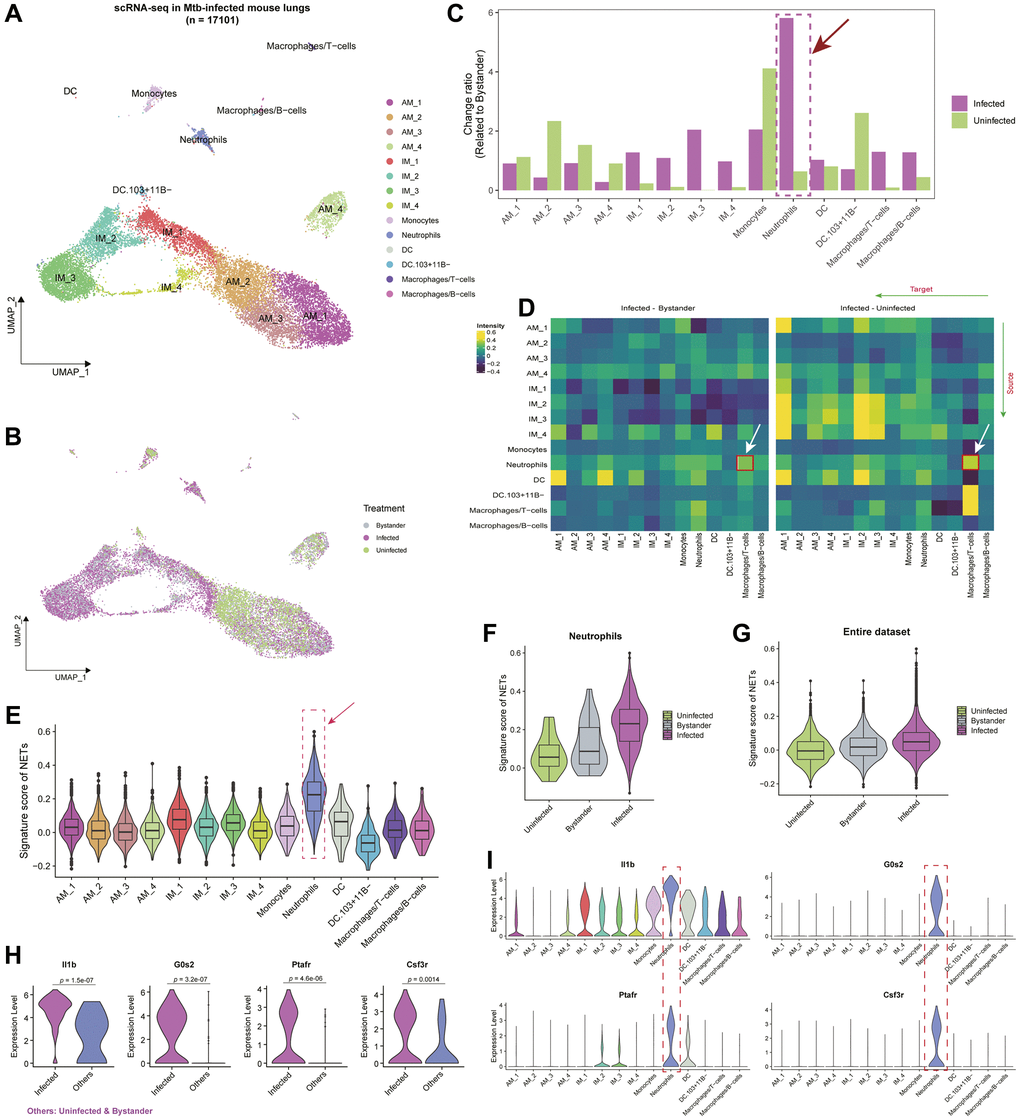
Figure 1. Interplay of cell types and neutrophil extracellular traps (NETs) in the single-cell landscape of Mtb infected mouse lung tissue. (A) Uniform Manifold Approximation and Projection (UMAP) showing the single-cell atlas of Mtb-infected mouse lung tissue [21]. Each point represents an individual cell, with distinct cell types marked by color codes. (B) UMAP showing the cell distribution based on uninfected, infected, and bystander statuses in mice. (C) Bar plot showing the change ratio of cell type fractions related to bystander mice. Notably, neutrophils exhibit the highest changes compared to uninfected mice and other cell types. (D) Heatmap showcasing ligand-receptor interactions within the mouse lung microenvironment. Greater inclination towards yellow indicates higher interactions among different cell types in the Infected group compared to bystander or uninfected status. (E) Violin plot coupled with a boxplot, revealing the signature scores of a gene set composed of neutrophil extracellular trap-related genes (NETs) in various cell types. (F, G) Violin plots showing the signature scores of NETs in Neutrophils (F) and the entire single-cell dataset (G) across different Mtb-infected statuses. (H) Violin plot showing the expression levels of Il1b, G0s2, Ptafr, and Csf3r between infected and Others (i.e., bystander and uninfected) statuses. P-values were obtained by t-test. (I) Violin plots showing the expression levels of Il1b, G0s2, Ptafr, and Csf3r across different cell types.
Several recent studies [16, 17, 59, 60] posit that Neutrophil Extracellular Traps (NETs), extracellular structures released by neutrophils, wield a significant influence in immune defense and inflammation regulation. We curated a set of 69 genes [16] associated with NETs and evaluated their activity across different cell types within the lung tissue microenvironment during Mtb infection in mice, highlighting the most robust activity scores within Neutrophils (Figure 1E; Supplementary Table 2). To delve into the dynamic fluctuations of NETs in distinct states of TB, we conducted a comparative analysis of NETs signature scores among the Uninfected, Infected, and Bystander states. The discerned pattern revealed the highest scores in the Infected state and the lowest in the Uninfected state, a consistent observation across the entire dataset (Figure 1F, 1G). The escalated NETs scores in the Infected state may be ascribed to the activation of neutrophils, releasing NETs to impede bacterial dissemination during Mtb infection.
Particularly, in the analysis discerning which NETs-related genes are closely associated with the progression of TB during the Infected state in comparison to the Uninfected and Bystander states, we conducted a differential expression analysis in Neutrophils cells. The results highlighted significant alterations in genes such as IL1B, G0S2, PTAFR, and CSF3R, manifesting specific high expression levels in Neutrophils cells (Figure 1H, 1I; t-test; p < 0.05; Supplementary Table 2). These genes, encompassing IL1B, G0S2, PTAFR, and CSF3R, exert pivotal roles in TB, contributing to immune responses and inflammation regulation [61, 62]. Their intricate interplay underscores a complex yet critical impact on the pathogenesis of TB. A comprehensive exploration of these genes holds promise in revealing novel therapeutic avenues and immune modulation strategies.
Significance of IL1B, G0S2, PTAFR, and CSF3R in the progression of TB patients
Although the single-cell data from murine Mtb provides insights into the putative roles of IL1B, G0S2, PTAFR, and CSF3R in the progression of TB, a more extensive investigation is imperative to elucidate their roles in TB patients. Consequently, we acquired data from 31 human TB datasets (see Supplementary Table 1; see Materials and Methods), comprising a total of 4229 samples, and applied IL1B, G0S2, PTAFR, and CSF3R to score these samples. The findings reveal consistent high expression scores for these four genes in the PTB state across diverse stages of patients (23/31) (Figure 2A). Notably, at the expression level, these four NETs-related genes exhibit significantly elevated expression levels in PTB compared to other stages, aligning with observations from murine single-cell data (Figures 2B and 1F).
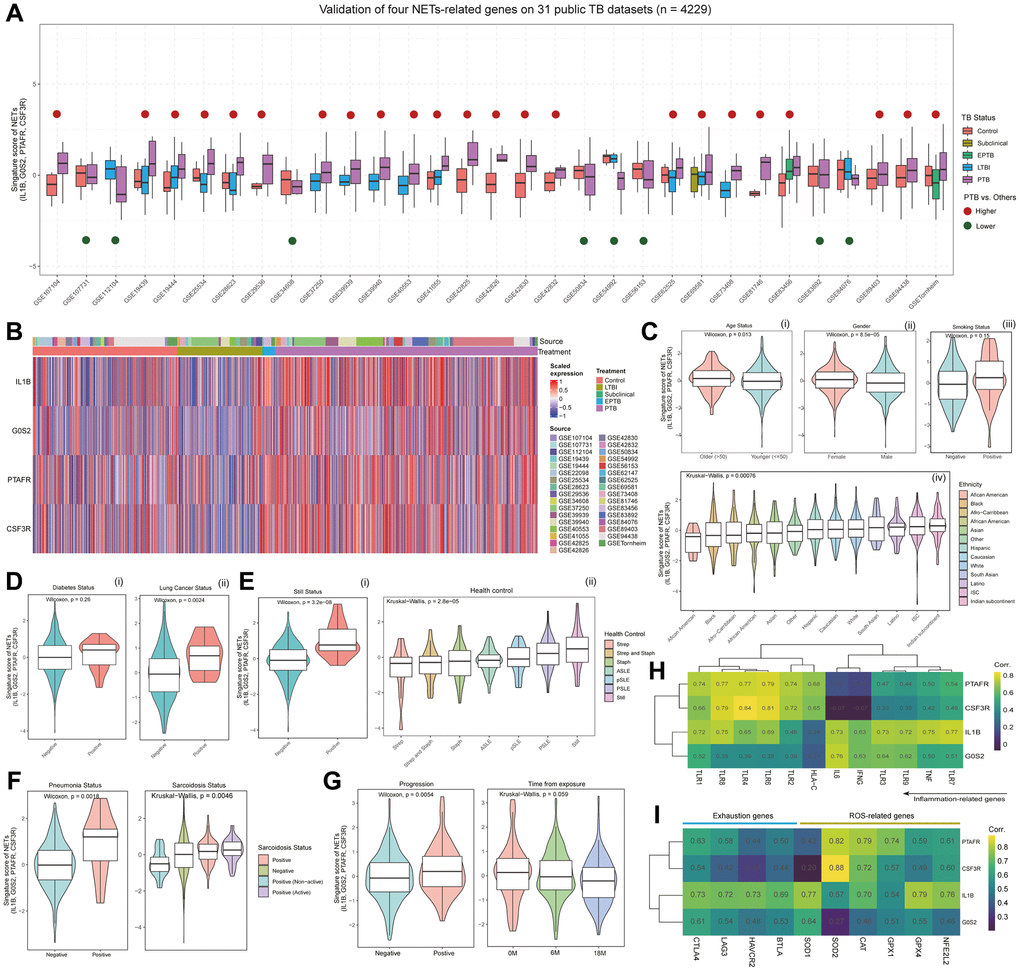
Figure 2. Multi-faceted analysis of NETs signature scores and gene expression patterns in TB patients. (A) Boxplot showing the distribution of signature scores for NETs, composed of IL1B, G0S2, PTAFR, and CSF3R, across different statuses in 31 publicly available TB datasets (with a total of 4209 samples). Red points above the box indicate that the scores in pulmonary tuberculosis (PTB) are higher than in other statuses, while green points below the box suggest lower scores in PTB compared to other statuses. (B) Heatmap depicting the expression levels of IL1B, G0S2, PTAFR, and CSF3R in patients from 31 TB datasets. Column annotations under “Source” represent the dataset to which the sample belongs, while column annotations under “Treatment” indicate the clinical status of the patients. (C) Violin plots showing the distribution of signature scores based on demographic features, including age status (i), gender (ii), smoking status (iii), and ethnicity status (iv). P-values were determined using the Wilcoxon or Kruskal-Wallis tests. (D) Violin plots showing the distribution of signature scores in TB patients with complications, including diabetes (i), and lung cancer (ii). P-values were obtained through the Wilcoxon test. (E) Violin plots showing the distribution of signature scores in TB patients with bacterial infection (i, ii) or autoimmune disease (ii). P-values were obtained through the Wilcoxon test or Kruskal-Wallis test. (F) Violin plots showing the distribution of signature scores in different health states of patients with pneumonia and sarcoidosis. P-values were determined using the Wilcoxon test or Kruskal-Wallis test. (G) Violin plots showing the distribution of signature scores at different stages of TB progression. P-values were obtained through the Wilcoxon test or Kruskal-Wallis test. (H) Heatmap presenting the co-expression relationships between the gene expression of IL1B, G0S2, PTAFR, and CSF3R, and inflammation-related genes. (I) Heatmap showing the co-expression relationships between the gene expression of IL1B, G0S2, PTAFR, and CSF3R, and genes associated with T cell exhaustion and reactive oxygen species (ROS) pathway.
Further investigation was conducted to examine the correlation of these four genes with clinical features, encompassing demographic characteristics, complications, and distinct stages of TB progression. In terms of demographic features, the signature scores associated with IL1B, G0S2, PTAFR, and CSF3R exhibited a notable increase in older patients compared to their younger counterparts, a trend also observed in female patients compared to males, and in smokers relative to non-smokers (Figure 2C). Among different ethnic cohorts, African Americans demonstrated the lowest scores, while individuals from the Indian subcontinent exhibited the highest scores (Figure 2C). Within the spectrum of complications, patients with diabetes and lung cancer displayed notably higher scores compared to their counterparts without these conditions (Figure 2D). Patients with Still’s complications exhibited the highest signature scores, whereas Strep was associated with the lowest scores (Figure 2E). In the context of pneumonia and sarcoidosis complications, positive patients consistently manifested higher signature scores than their negative counterparts (Figure 2F). Regarding the diverse stages of TB progression, those with positive progression exhibited higher scores than those with negative progression, and patients further removed from the onset of tuberculosis displayed correspondingly lower signature scores derived from these four genes (Figure 2G).
Considering the pivotal role of the inflammatory response pathway in the development of TB, the activation of inflammatory pathways such as NF-κB, IL-1, TNF-α, IL-6 upon Mtb infection in lung tissue leads to the activation and recruitment of immune cells, enhancing their antimycobacterial capabilities [1, 63]. The analysis of genes associated with the inflammatory response, including IL1B, G0S2, PTAFR, and CSF3R, underscored a significant overall correlation, signifying their synergistic role in regulating immune system inflammation (Figure 2H). During TB progression, the ROS pathway assumes a pivotal role [64, 65]. IL1B, G0S2, PTAFR, and CSF3R exhibited a robust positive correlation with genes linked to reactive oxygen species pathway (ROS) (average r > 0.5) (Figure 2I). Notably, these four genes also demonstrated a positive association with genes associated with exhaustion, mirroring the intricate integration of immune and inflammatory regulation within the organism (Figure 2I). Collectively, these findings suggest their joint participation in modulating immune response and depletion processes, ensuring an effective response to pathogens, thereby unveiling the intricate nature of the inflammatory regulation network.
Development of TBSig as a diagnostic biomarker for predicting the progressions of TB patients
We observed marked heterogeneity in the distribution of signature scores derived from IL1B, G0S2, PTAFR, and CSF3 among distinct diagnostic categories of TB patients (Figure 3A). Specifically, PTB demonstrated the highest average signature scores, exhibiting significant distinctions in comparison to both the Control and LTBI groups. However, when compared to the subclinical and EPTB groups, no statistically significant differences were observed. At the gene expression level, these four genes consistently demonstrated higher expression in PTB compared to other TB types (Figure 3B). This led us to question the potential of IL1B, G0S2, PTAFR, and CSF3 as effective discriminators for various TB patient types.
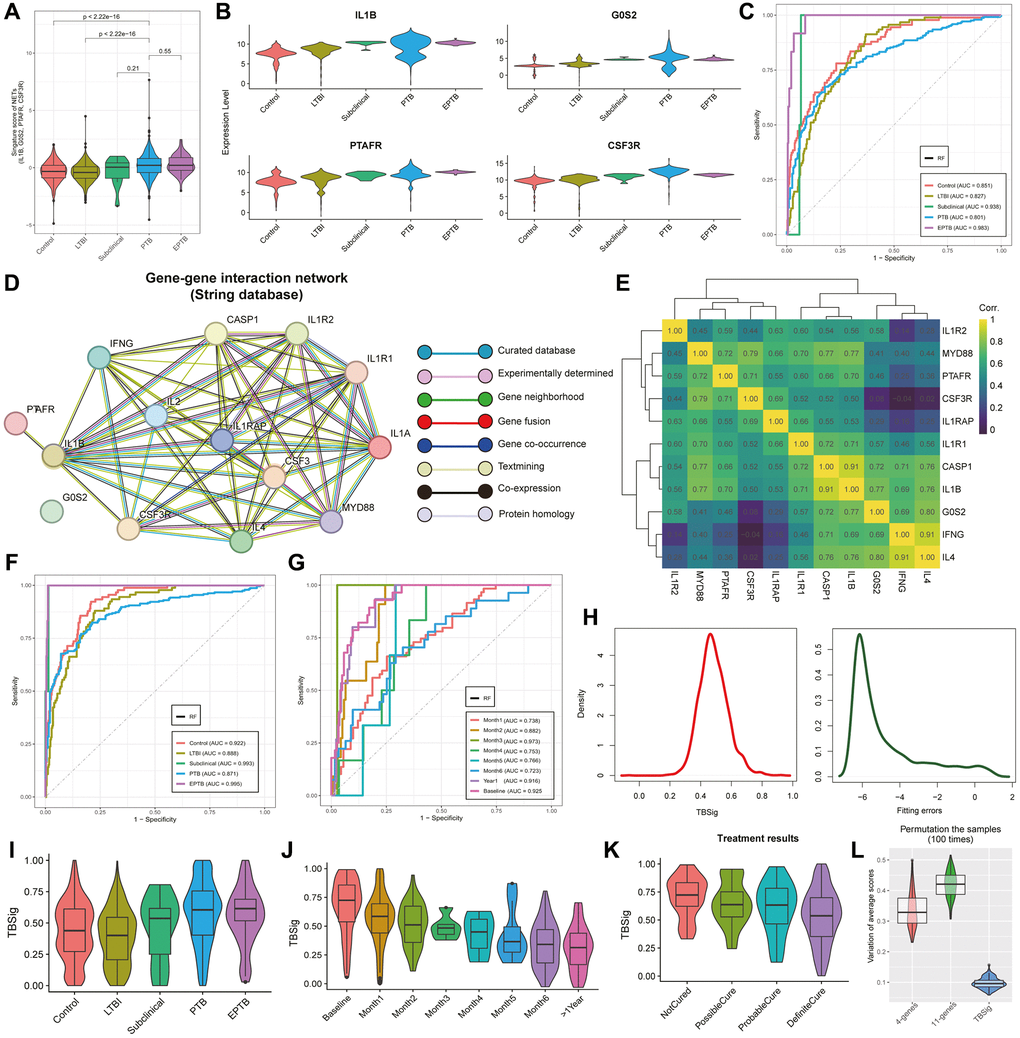
Figure 3. Unveiling TB progression insights with emphasis on TBSig score through NETs-related genes. (A) Violin plots showing the distribution of signature scores (IL1B, G0S2, PTAFR, and CSF3R) across various stages of progression in pulmonary tuberculosis (PTB). The stages include Control, Latent Tuberculosis Infection (LTBI), Subclinical, PTB, and Extrapulmonary Tuberculosis (EPTB). (B) Violin plots showing the expression distribution of IL1B, G0S2, PTAFR, and CSF3R in different stages of progression in PTB patients. (C) The Area Under the Curve (AUC) curves showcase the predictive performance of a random forest classifier built with IL1B, G0S2, PTAFR, and CSF3R as features, across different diagnostic type of TB patients. (D) Network diagram showing gene interactions from the STRING database associated with IL1B, G0S2, PTAFR, and CSF3R. Different lines represent the sources of gene interaction relationships. (E) Heatmap showing the expression correlations of 11 highly interacting genes. Colors trending towards yellow indicate stronger correlations. (F, G) AUC curves showing the predictive performance of a random forest classifier constructed with 11 genes as features for different diagnostic types of TB (F) and various time stages leading up to the occurrence of TB (G). (H) Density curve plots showing the distribution of predicted scores constructed from 11 genes (left side) and the fitted error distribution (right side). (I) Violin combined with box plots showing the distribution of TBSig scores across different stages of progression in TB patients. (J) Violin combined with box plots showing the distribution of TBSig scores at different time stages leading up to the occurrence of TB patients. (K) Violin combined with box plots showing the distribution of TBSig scores under different states after treatment. (L) Violin combined with box plots showing the variability in the average scores of 4-genes, 11-genes, and TBSig across diverse datasets. For each iteration, 500 samples were randomly subsampled from the dataset, and this process was repeated 100 times. TBSig consistently demonstrated the least perturbation variability across all datasets.
To explore this, we constructed a random forest multi-classification diagnostic model, utilizing these four genes as features and clinical diagnostic types as labels. In the test set, the model exhibited robust diagnostic accuracy, reaching 0.983 for EPTB, 0.938 for Subclinical, and maintaining a commendable level above 0.8 for PTB (Figure 3C; see Materials and Methods). This underscores the significance of IL1B, G0S2, PTAFR, and CSF3 as pivotal biomarkers for diverse TB classifications. In an effort to further refine the model’s predictive performance for PTB, we endeavored to incorporate additional genes closely interacting with IL1B, G0S2, PTAFR, and CSF3. Retrieving an additional 7 genes highly interactive with these four from the STRING database, the resulting interaction network graph revealed credible relationships among them (Figure 3D; see Materials and Methods). Co-expression pattern analysis across 31 TB datasets demonstrated predominantly strong positive interactions between most of these genes (Figure 3E). Reintegrating these 11 genes into the random forest model notably improved diagnostic performance for various TB types, notably achieving an AUC of 0.871 for PTB and an impressive 0.995 for EPTB in the test set (Figure 3F). Moreover, our exploration of time since PTB onset revealed the highest diagnostic AUC at 3 months (0.973), followed by baseline (0.925), and extending beyond a year (0.916). The diagnostic AUC values for other time points consistently remained above 0.72 (Figure 3G).
Subsequently, in the pursuit of a robust biomarker for TB diagnosis, we introduced a cumulative Gaussian probability distribution strategy based on the enrichment score inferred by the “ssgsea” method, resulting in the creation of a diagnostic biomarker named TBSig (Figure 3H; see Materials and Methods). TBSig scores exhibited a discernible trend of decreasing severity across different TB diagnoses and exposure times (Figure 3I, 3J). Notably, TBSig displayed sensitivity in distinguishing patients with varied treatment outcomes, with the highest scores in Not Cured patients and the lowest in Definite Cure patients, aligning seamlessly with clinical expectations (Figure 3K). Crucially, TBSig demonstrated remarkable comparability across diverse patient cohorts, a pivotal characteristic for its practical application in clinical settings. Subsampling analysis of 31 datasets for 4-gene, 11-gene, and TBSig scores consistently revealed TBSig’s minimal variability in average scores among different datasets, underscoring its suitability for cross-dataset comparisons (Figure 3L; see Materials and Methods).
In summary, IL1B, G0S2, PTAFR, CSF3, and their interacting genes showcased significant differences among TB patients, offering robust discriminative features for diverse TB clinical types. The integration of interacting genes and the creation of the TBSig biomarker not only enhanced the accuracy and predictive performance of TB patient diagnosis but also presented a potential valuable tool for practical implementation in clinical settings.
Distinct clinical subtypes identification in pulmonary tuberculosis patients
We conducted an analysis using the Gini index and Interquartile range (IQR) to explore the inherent heterogeneity of TBSig among different types of TB patients (see Materials and Methods). The findings revealed that the Gini index and IQR of PTB patients were consistently higher than those of other types, suggesting the presence of distinct clinical subtypes within the PTB cohort (Figure 4A). Employing the Louvain clustering algorithm, three subtypes of PTB patients, named C1, C2, and C3, were successfully identified (Figure 4B; see Materials and Methods; Supplementary Table 3). Additionally, consensus clustering was applied to subgroup the PTB patients, confirming that the optimal number of clusters is 3 (Supplementary Figures 1 and 2; see Materials and Methods). The overlap analysis revealed a high degree of agreement between the consensus clustering and Louvain clustering results, indicating that the clusters identified by the Louvain method are stable (Supplementary Figure 3). Moreover, the projection of TBSig scores onto UMAP revealed a gradual increase from C3 to C1, a pattern corroborated by Figure 4D, where C3 exhibited the lowest, and C1 had the highest (Figure 4C, 4D). When assessing different subtypes of PTB patients, we utilized an inflammation-related gene set for scoring, revealing that the C1 subtype exhibited the highest score, while C3 had the lowest (Figure 4E; t-test). This suggests an inclination towards early inflammatory responses in the C1 subtype. Examination of the distribution of the three PTB subtypes at various time points in the progression of the disease illustrated that C1 had a higher distribution at Baseline and Month1, gradually declining over time, whereas C3 demonstrated the opposite trend (Figure 4F). The Sankey diagram further confirmed the predominance of C1 at 0 months and 6 months, with minimal distribution at 18 months (Figure 4G). In contrast, C2 and C3 exhibited a notable number of patients at 18 months, reinforcing the association of C1 with early-stage PTB.
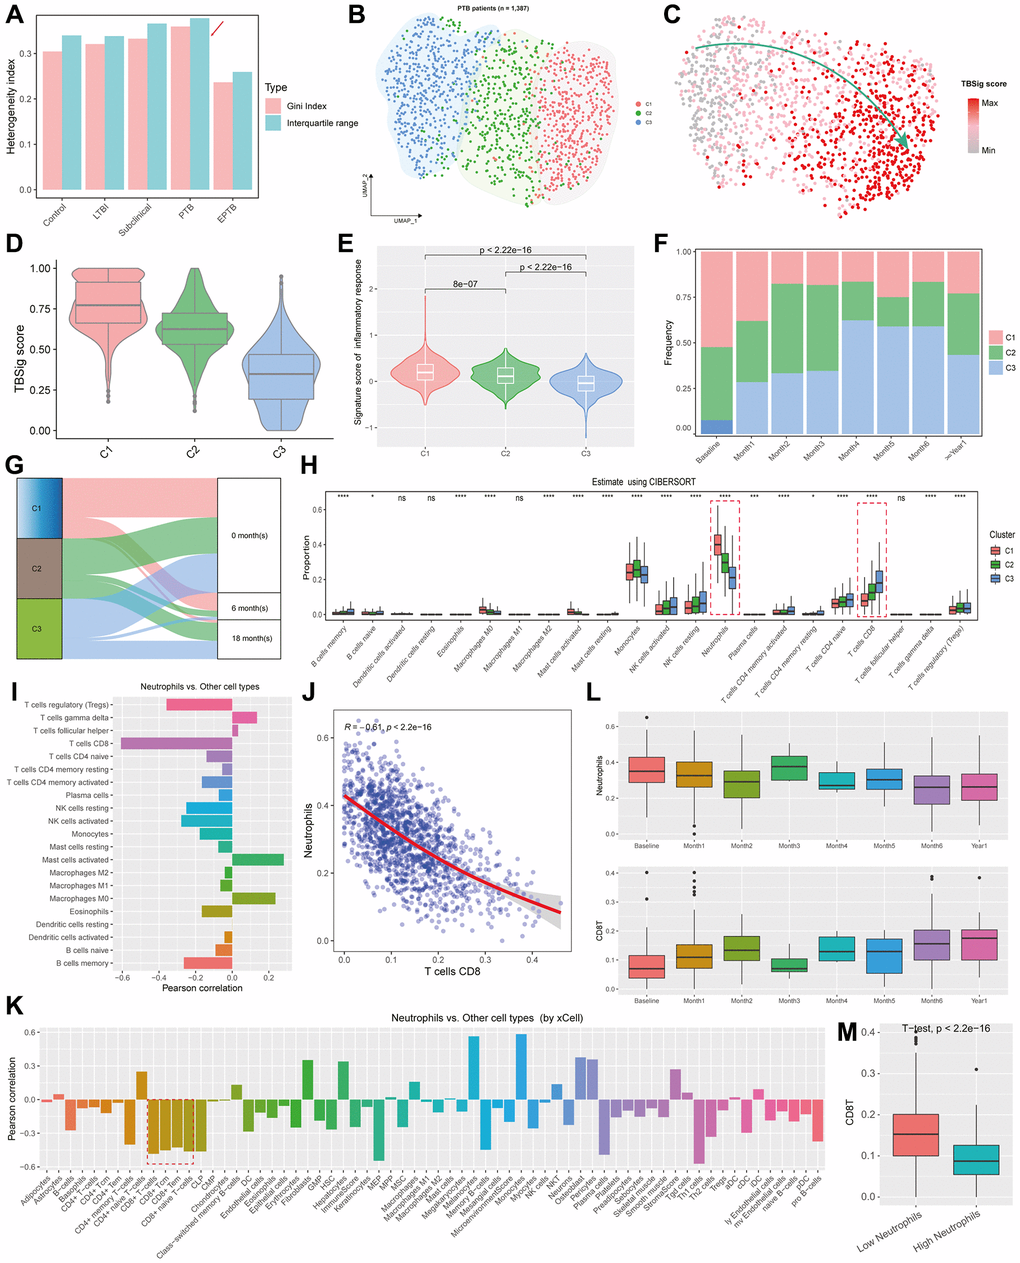
Figure 4. Exploration of inferred PTB subtypes based on NETs-related genes. (A) Bar plots showing the heterogeneity indexes of the diagnostic types of TB patients based on Gini index and Interquartile range. (B) UMAP showing the distribution of different PTB subtypes, with each point representing an individual sample, and distinct colors indicating PTB categories. (C) Projection of TBSig scores for PTB patients onto UMAP. Each dot represents an individual PTB patient. (D) Violin plots combined with box plots showing the distribution of TBSig scores within different PTB subtypes. (E) Violin plots showing the activity scores of inflammation-related gene sets across different subtypes, with p-values obtained from t-tests. (F) Proportions of different PTB subtypes at various time stages relative to the occurrence of TB. (G) Sankey diagram showing the mapping relationships between different PTB subtypes and stages of PTB outbreaks. (H) Box plots showing the proportions of distinct cell types infiltrating various PTB subtypes, as estimated by CIBERSORT. nsp > 0.05; *p < 0.01; **p < 0.001; ***p < 0.0001; ****p < 0.00001. (I) Bar plot showing the Pearson correlations between Neutrophils with other immune cell types. (J) Scatter plot with a fitted line showing the association between Neutrophils and CD8+ T cells. Each dot represents an individual PTB patient. “R” indicates the Pearson correlation, and the p-value is obtained by t-test. (K) Bar plot showing the Pearson correlations between Neutrophils and other cell types, as estimated by xCell. (L) Box plots showing the distribution of Neutrophils and CD8+ T cells at different time stages relative to the onset of PTB outbreak. (M) Box plot showing the difference of CD8+ T cell fractions between low and high Neutrophil infiltration. P-value was obtained by t-test.
To assess differences in the immune microenvironment among the three PTB subtypes, we utilized CIBERSORT [57] to estimate immune cell composition. The results indicated significant differences in the majority of immune cell types among the three subtypes (18/22; p < 0.05) (Figure 4H; see Materials and Methods; Supplementary Table 4). Monocytes, Neutrophils, and T cells CD8+ dominated the proportions, with Neutrophils gradually decreasing from C1 to C3, while T cells CD8+ increased gradually (Figure 4H; t-test). Further analysis revealed a robust negative correlation between Neutrophils and CD8+ T cells (r = −0.61; t-test, p < 0.00001; Figure 4I, 4J). Validation through the xCell tool [58] confirmed a substantial negative correlation between CD8+ T cells and Neutrophils (Figure 4K; see Materials and Methods; Supplementary Table 4). Based on these findings, we postulated that early PTB patients might manifest a higher abundance of Neutrophils, potentially inhibiting the activation of CD8+ T cells. Subsequent analysis demonstrated that Neutrophil abundance was elevated in the early stages, diminishing over time, whereas CD8+ T cell abundance followed the opposite trajectory, commencing at lower levels in the early stages and gradually increasing (Figure 4L). Stratifying PTB patients into high Neutrophils and low Neutrophils groups based on average abundance, the results revealed that Low Neutrophils patients had higher CD8+ T cell levels, while High Neutrophils patients had lower CD8+ T cell levels, with a significant distinction between the two groups (Figure 4M).
To summarize, our analysis unveiled internal heterogeneity and subtype differences within the TB patients. Specifically, the C1 subtype displayed a heightened inflammatory response in the early stages, linked with increased Neutrophil abundance and suppression of CD8+ T cells.
CLEC4D’s potential significance in suppressing CD8+ T cell activity by early neutrophils during TB
Through differential expression analysis, we observed significant variations in gene expression across different subtypes of PTB patients (Figure 5A; see Materials and Methods). Specifically, C1 exhibited a higher number of significantly differentially expressed genes compared to C2 and C3, while C2 displayed the fewest differentially expressed genes (Figure 5A; Supplementary Table 5). Additionally, there was an overlap in differentially expressed genes between C2 and both C1 and C3, indicating that C2 might be in an intermediate state during the progression of PTB from C3 to C1, providing insights into crucial nodes in the development of the disease. Further exploration of the biological functions and pathways involving the top 100 differentially expressed genes in different subtypes revealed that C1 was associated with biological functions related to inflammation, including pathways involving NK-kappaB and cytokines (Figure 5B, 5C; see Materials and Methods; Supplementary Tables 6 and 7). This suggests that C1 may play a vital role in immune responses. Conversely, C2 was predominantly involved in the electron transport chain and oxidative phosphorylation pathways, emphasizing its critical role in cellular energy production (Figure 5B, 5C; Supplementary Tables 6 and 7). On the other hand, C3 exhibited pathways related to the regulation and activation of T cells, highlighting its significance in modulating and activating T cells within the immune system (Figure 5B, 5C; Supplementary Tables 6 and 7). These findings unveil the involvement of specific functional pathways in each subtype, offering a new perspective for a deeper understanding of the progression of PTB.
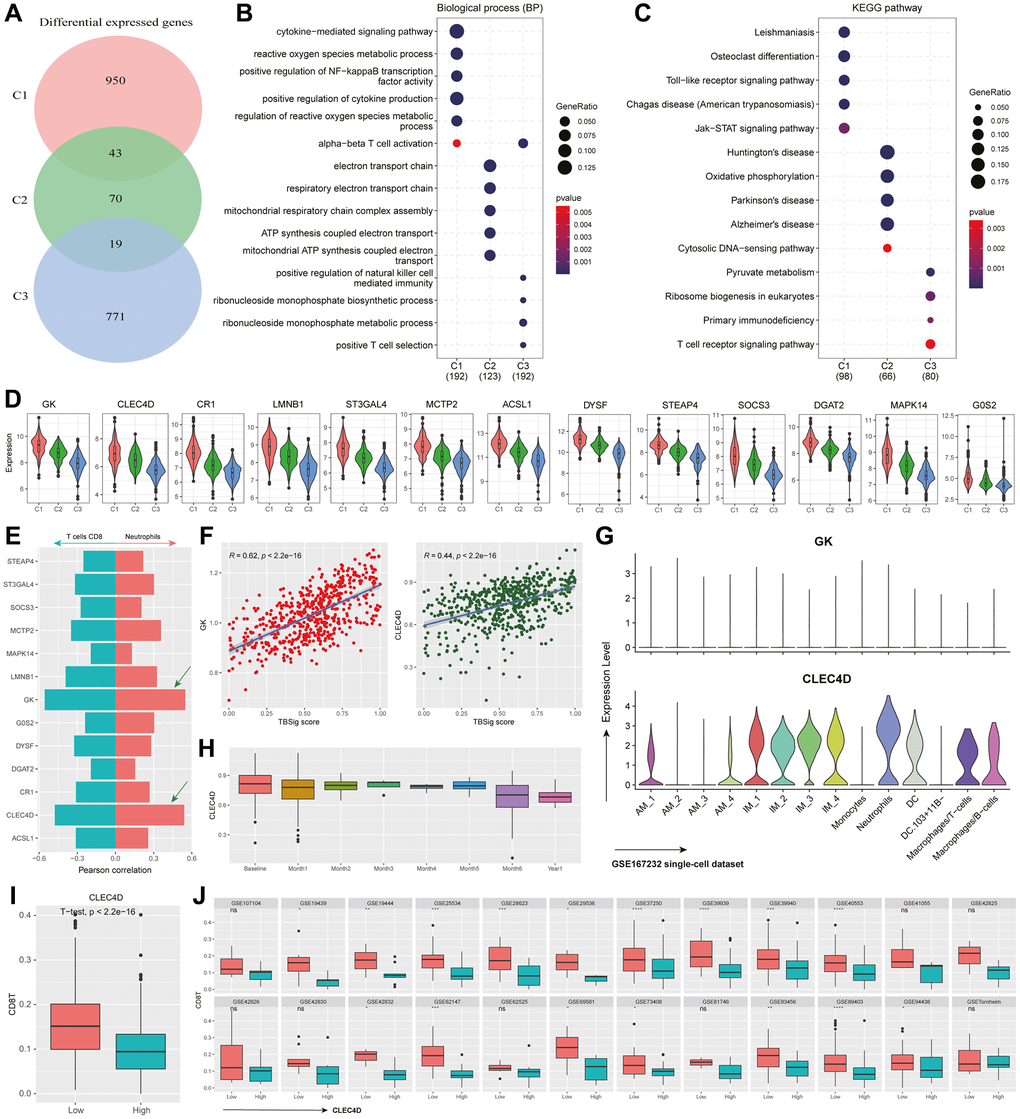
Figure 5. Functional characteristics and dynamic gene expression patterns in PTB subtypes. (A) Venn diagram showing the overlap of differentially expressed genes among different PTB subtypes. (B, C) The most significant 100 genes expressed in different PTB subtypes enrich in biological processes (B) and KEGG pathways (C). (D) Violin plot showing the distribution of differentially expressed genes in C1 that have a correlation with TBSig greater than 0.4 across different PTB subtypes. (E) Bar plot showing the correlation between gene expression and the abundance of CD8+ T cells and Neutrophils (estimated by CIBERSORT). The right side corresponds to Neutrophils, while the left side corresponds to CD8+ T cells. (F) Scatter plot showing the association between the expression of GK and CLEC4D genes and TBSig score. Each point represents an individual PTB patient, and the blue line is the fitted linear regression line, with “R” indicating the Pearson correlation coefficient. (G) Violin plot showing the expression of GK and CLEC4D in different cell types in a mouse single-cell dataset (GSE167232) [21]. (H) Box plot shows the dynamic changes in CLEC4D expression over different time points of PTB occurrence. (I) Box plot displays the difference in CD8+ T cells abundance between the high CLEC4D expression group and the control group in all PTB datasets. The p-value is obtained from a t-test. (J) Box plot illustrates the difference in CD8+ T cells abundance between the high CLEC4D expression group and the low group in different TB datasets. The p-values were obtained from a t-test.
In the investigation of key genes within the C1 subtype during the progression of PTB, a correlation analysis with TBSig identified 13 genes with correlation coefficients greater than 0.4. These genes displayed a clear trend from high to low expression levels from C1 to C3, indicating their potential crucial roles in the disease progression of TB patients (Figure 5D). Given the potential suppressive effect of early Neutrophils on CD8+ T cell activity, we analyzed the correlation between these genes and the abundance of Neutrophils and CD8+ T cells. Results revealed a strong positive correlation between GK and CLEC4D with Neutrophil abundance (r > 0.5), and a strong negative correlation with CD8+ T cell abundance (Figure 5E, 5F; r < −0.5). Single-cell data analysis further demonstrated the specific expression of CLEC4D in Neutrophils (Figure 5G). Combining these findings with existing literature, it is suggested that CLEC4D may participate in the early immune response to PTB, with its expression trend aligning with that of Neutrophils.
To validate the role of CLEC4D, we analyzed its dynamic changes during different stages of PTB progression. CLEC4D exhibited higher expression levels in the early stages, gradually decreasing over time, consistent with the trend observed in Neutrophils (Figure 5H). Stratifying PTB patients into high and low CLEC4D expression groups revealed significant differences in CD8+ T cell abundance between the two groups (Figure 5I). Further analysis across multiple datasets confirmed this trend, reinforcing the potential role of CLEC4D in regulating CD8+ T cell abundance (Figure 5J; t-test). Overall, these findings provide crucial clues for a comprehensive understanding of the molecular mechanisms underlying the progression of PTB.
Discussion
TB is caused by Mycobacterium tuberculosis, primarily affecting the lungs but potentially impacting other organs and systems [2, 8]. In our comprehensive investigation of single-cell data in the context of Mtb infection, murine model results highlighted dynamic alterations in neutrophils, emphasizing their pivotal role in the immune response to Mtb and their crucial involvement in PTB progression. The exploration of NET-related genes provided insights into host defense mechanisms against Mtb, with elevated NETs scores in the infected state indicating an active response. Furthermore, differential expression analysis of NETs-related genes IL1B, G0S2, PTAFR, and CSF3R in neutrophils, suggested their specific roles in immune responses and inflammation regulation during TB.
Extending the investigation to 31 human TB datasets, the consistently high expression of IL1B, G0S2, PTAFR, and CSF3R across diverse stages and clinical features reinforced their relevance in TB progression. By reviewing previous studies, IL1B, a pro-inflammatory cytokine, orchestrates the immune response by recruiting immune cells and enhancing macrophage bactericidal activity [66]. G0S2 regulates cell survival and apoptosis, influencing the containment of Mtb within granulomas [67]. PTAFR mediates immune cell recruitment and activation through platelet-activating factor signaling, which is crucial for inflammation and granuloma formation [39]. CSF3R stimulates the production and activation of neutrophils, providing a robust initial defense against TB by controlling bacterial growth [68]. Together, these genes contribute to an effective and balanced immune response, essential for combating TB while minimizing tissue damage. Additionally, correlation analysis with demographic characteristics, complications, and TB stages provided valuable insights into associations between these four genes and the clinical heterogeneity of TB. Analysis of inflammatory-related genes [69], along with positive correlations with the reactive oxygen species (ROS) pathway [70], underscored the involvement of IL1B, G0S2, PTAFR, and CSF3R in modulating immune response and inflammation. Positive associations with exhaustion-related genes revealed an intricate interplay between immune and inflammatory regulation during TB progression [71, 72].
The TBSig diagnostic biomarker, based on IL1B, G0S2, PTAFR, and CSF3R, demonstrated promising diagnostic accuracy across various TB classifications, showcasing TBSig’s potential as a valuable clinical diagnostic tool. Notably, compared to signature models based on multivariate Cox regression, such as GILncSig [73], OncoSig [74], and TLSig [75], TBSig posits that although individual gene expressions may be affected by external factors, the relative ranking of genes remains consistent [76]. TBSig assesses the activity scores through gene ranking and translates these scores into cumulative probability values ranging from 0 to 1. This methodology ensures stable comparisons of TBSig scores across different individuals, facilitating the establishment of a universal cutoff value for risk stratification in PTB patients. Additionally, the distinct clinical subtypes within PTB patients, determined by Louvain clustering-C1, C2, and C3, revealed internal heterogeneity. C1’s association with early inflammatory responses, evidenced by higher TBSig scores and inflammation-related gene set scores, suggests potential patient stratification based on immune profiles. Analysis of immune cell composition revealed significant subtype differences, particularly in Monocytes, Neutrophils, and CD8+ T cells, with a negative correlation suggesting early Neutrophils’ potential inhibitory effect on CD8+ T cell activation.
Further analysis of differentially expressed genes in PTB subtypes unveiled distinct functional pathways associated with each subtype. C1’s involvement in inflammation-related pathways, C2’s emphasis on energy production pathways, and C3’s association with T cell regulation pathways provide a nuanced understanding of molecular mechanisms underlying PTB progression. Correlation analysis with TBSig identified key genes, including CLEC4D, with hidden roles in disease development [77, 78]. The potential significance of CLEC4D in suppressing CD8+ T cell activity during early Neutrophil responses in TB adds complexity to our understanding of host-pathogen interactions. The association between CLEC4D and Neutrophil abundance, aligning with Neutrophils’ expression pattern, suggests its involvement in the early immune response to Mtb. Dynamic changes in CLEC4D expression during different PTB progression stages further support its role in regulating CD8+ T cell abundance. These comprehensive analysis offers a multifaceted perspective on the cellular and molecular intricacies of PTB. Identifying key genes and developing diagnostic biomarkers contribute to our understanding of TB pathogenesis. Recognition of distinct clinical subtypes and exploration of immune cell composition provide a basis for personalized TB diagnosis and treatment. CLEC4D’s potential role in modulating early immune responses highlights avenues for further research and potential therapeutic interventions in TB.
However, it’s essential to recognize the limitations of our study, including the reliance on transcriptomic data alone, which provides insight into gene expression patterns but may not fully capture the complexity of regulatory mechanisms or post-transcriptional modifications. Moreover, while our analysis identifies potential candidate genes associated with TB, further experimental validation is necessary to confirm their functional relevance and therapeutic potential. Overall, the integration of novel biomarker TBSig, derived from NETs, holds significant promise in TB management. TBSig facilitates early TB diagnosis, monitors disease progression, and detects recurrence. Additionally, subtype classifications in PTB guide personalized treatment and improve prognostication, optimizing therapeutic efficacy and patient outcomes. These findings have the potential to enhance clinical practice standards.
Supplementary Materials
Author Contributions
LL conceptualized and designed the study. LL, TW, and ZC conducted the data analysis. LL and JQL were responsible for drafting and revising the manuscript. All authors participated in contributing to and approving the final version of the manuscript.
Acknowledgments
We express our appreciation to all the authors who actively engaged in this study, contributing to data collection, coding, and the writing of the manuscript.
Conflicts of Interest
The authors declare no conflicts of interest related to this study.
Funding
This work was supported by the “Thirteenth Five-Year Plan” National Science and Technology Major Project for the Prevention and Control of Major Infectious Diseases such as HIV/AIDS and Viral Hepatitis (2018ZX10722-301-005).
References
- 1. Tiwari D, Martineau AR. Inflammation-mediated tissue damage in pulmonary tuberculosis and host-directed therapeutic strategies. Semin Immunol. 2023; 65:101672. https://doi.org/10.1016/j.smim.2022.101672 [PubMed]
- 2. Warsinske H, Vashisht R, Khatri P. Host-response-based gene signatures for tuberculosis diagnosis: A systematic comparison of 16 signatures. PLoS Med. 2019; 16:e1002786. https://doi.org/10.1371/journal.pmed.1002786 [PubMed]
- 3. Vargas R, Abbott L, Bower D, Frahm N, Shaffer M, Yu WH. Gene signature discovery and systematic validation across diverse clinical cohorts for TB prognosis and response to treatment. PLoS Comput Biol. 2023; 19:e1010770. https://doi.org/10.1371/journal.pcbi.1010770 [PubMed]
- 4. Chen L, Hua J, Dai X, He X. Assessment of ferroptosis-associated gene signatures as potential biomarkers for differentiating latent from active tuberculosis in children. Microb Genom. 2023; 9:mgen000997. https://doi.org/10.1099/mgen.0.000997 [PubMed]
- 5. Santos JA, Duarte R, Nunes C. Tuberculin skin test and interferon-γ release assays: Can they agree? Clin Respir J. 2023; 17:109–14. https://doi.org/10.1111/crj.13569 [PubMed]
- 6. Hamada Y, Kontsevaya I, Surkova E, Wang TT, Wan-Hsin L, Matveev A, Ziganshina LE, Denkinger CM, Korobitsyn A, Ismail N, Abubakar I, Rangaka MX. A Systematic Review on the Safety of Mycobacterium tuberculosis-Specific Antigen-Based Skin Tests for Tuberculosis Infection Compared With Tuberculin Skin Tests. Open Forum Infect Dis. 2023; 10:ofad228. https://doi.org/10.1093/ofid/ofad228 [PubMed]
- 7. Hamada Y, Gupta RK, Quartagno M, Izzard A, Acuna-Villaorduna C, Altet N, Diel R, Dominguez J, Floyd S, Gupta A, Huerga H, Jones-López EC, Kinikar A, et al. Predictive performance of interferon-gamma release assays and the tuberculin skin test for incident tuberculosis: an individual participant data meta-analysis. EClinicalMedicine. 2023; 56:101815. https://doi.org/10.1016/j.eclinm.2022.101815 [PubMed]
- 8. Shaukat SN, Eugenin E, Nasir F, Khanani R, Kazmi SU. Identification of immune biomarkers in recent active pulmonary tuberculosis. Sci Rep. 2023; 13:11481. https://doi.org/10.1038/s41598-023-38372-7 [PubMed]
- 9. Calderwood CJ, Reeve BW, Mann T, Palmer Z, Nyawo G, Mishra H, Ndlangalavu G, Abubakar I, Noursadeghi M, Theron G, Gupta RK. Clinical utility of C-reactive protein-based triage for presumptive pulmonary tuberculosis in South African adults. J Infect. 2023; 86:24–32. https://doi.org/10.1016/j.jinf.2022.10.041 [PubMed]
- 10. Cheng P, Wang L, Gong W. In silico Analysis of Peptide-Based Biomarkers for the Diagnosis and Prevention of Latent Tuberculosis Infection. Front Microbiol. 2022; 13:947852. https://doi.org/10.3389/fmicb.2022.947852 [PubMed]
- 11. Zhang F, Zhang F, Dong Y, Li L, Pang Y. New Insights into Biomarkers for Evaluating Therapy Efficacy in Pulmonary Tuberculosis: A Narrative Review. Infect Dis Ther. 2023; 12:2665–89. https://doi.org/10.1007/s40121-023-00887-x [PubMed]
- 12. Leboueny M, Maloupazoa Siawaya AC, Bouanga LDJ, Mvoundza Ndjindji O, Mveang Nzoghe A, Djoba Siawaya JF. Changes of C-reactive protein and Procalcitonin after four weeks of treatment in patients with pulmonary TB. J Clin Tuberc Other Mycobact Dis. 2023; 31:100348. https://doi.org/10.1016/j.jctube.2023.100348 [PubMed]
- 13. Abdulgader SM, Okunola AO, Ndlangalavu G, Reeve BWP, Allwood BW, Koegelenberg CFN, Warren RM, Theron G. Diagnosing Tuberculosis: What Do New Technologies Allow Us to (Not) Do? Respiration. 2022; 101:797–813. https://doi.org/10.1159/000525142 [PubMed]
- 14. Carpenter SM, Lu LL. Leveraging Antibody, B Cell and Fc Receptor Interactions to Understand Heterogeneous Immune Responses in Tuberculosis. Front Immunol. 2022; 13:830482. https://doi.org/10.3389/fimmu.2022.830482 [PubMed]
- 15. Conde R, Laires R, Gonçalves LG, Rizvi A, Barroso C, Villar M, Macedo R, Simões MJ, Gaddam S, Lamosa P, Puchades-Carrasco L, Pineda-Lucena A, Patel AB, et al. Discovery of serum biomarkers for diagnosis of tuberculosis by NMR metabolomics including cross-validation with a second cohort. Biomed J. 2022; 45:654–64. https://doi.org/10.1016/j.bj.2021.07.006 [PubMed]
- 16. Zhang Y, Guo L, Dai Q, Shang B, Xiao T, Di X, Zhang K, Feng L, Shou J, Wang Y. A signature for pan-cancer prognosis based on neutrophil extracellular traps. J Immunother Cancer. 2022; 10:e004210. https://doi.org/10.1136/jitc-2021-004210 [PubMed]
- 17. Hidalgo A, Libby P, Soehnlein O, Aramburu IV, Papayannopoulos V, Silvestre-Roig C. Neutrophil extracellular traps: from physiology to pathology. Cardiovasc Res. 2022; 118:2737–53. https://doi.org/10.1093/cvr/cvab329 [PubMed]
- 18. Meier S, Seddon JA, Maasdorp E, Kleynhans L, du Plessis N, Loxton AG, Malherbe ST, Zak DE, Thompson E, Duffy FJ, Kaufmann SHE, Ottenhoff THM, Scriba TJ, et al, and GC6-74 Consortium and Catalysis TB Biomarkers Consortium. Neutrophil degranulation, NETosis and platelet degranulation pathway genes are co-induced in whole blood up to six months before tuberculosis diagnosis. PLoS One. 2022; 17:e0278295. https://doi.org/10.1371/journal.pone.0278295 [PubMed]
- 19. Abdelaal T, Michielsen L, Cats D, Hoogduin D, Mei H, Reinders MJT, Mahfouz A. A comparison of automatic cell identification methods for single-cell RNA sequencing data. Genome Biol. 2019; 20:194. https://doi.org/10.1186/s13059-019-1795-z [PubMed]
- 20. Pasquini G, Rojo Arias JE, Schäfer P, Busskamp V. Automated methods for cell type annotation on scRNA-seq data. Comput Struct Biotechnol J. 2021; 19:961–9. https://doi.org/10.1016/j.csbj.2021.01.015 [PubMed]
- 21. Pisu D, Huang L, Narang V, Theriault M, Lê-Bury G, Lee B, Lakudzala AE, Mzinza DT, Mhango DV, Mitini-Nkhoma SC, Jambo KC, Singhal A, Mwandumba HC, Russell DG. Single cell analysis of M. tuberculosis phenotype and macrophage lineages in the infected lung. J Exp Med. 2021; 218:e20210615. https://doi.org/10.1084/jem.20210615 [PubMed]
- 22. Leong S, Zhao Y, Joseph NM, Hochberg NS, Sarkar S, Pleskunas J, Hom D, Lakshminarayanan S, Horsburgh CR
Jr , Roy G, Ellner JJ, Johnson WE, Salgame P. Existing blood transcriptional classifiers accurately discriminate active tuberculosis from latent infection in individuals from south India. Tuberculosis (Edinb). 2018; 109:41–51. https://doi.org/10.1016/j.tube.2018.01.002 [PubMed] - 23. Verma S, Du P, Nakanjako D, Hermans S, Briggs J, Nakiyingi L, Ellner JJ, Manabe YC, Salgame P. "Tuberculosis in advanced HIV infection is associated with increased expression of IFNγ and its downstream targets". BMC Infect Dis. 2018; 18:220. https://doi.org/10.1186/s12879-018-3127-4 [PubMed]
- 24. Leong S, Zhao Y, Ribeiro-Rodrigues R, Jones-López EC, Acuña-Villaorduña C, Rodrigues PM, Palaci M, Alland D, Dietze R, Ellner JJ, Johnson WE, Salgame P. Cross-validation of existing signatures and derivation of a novel 29-gene transcriptomic signature predictive of progression to TB in a Brazilian cohort of household contacts of pulmonary TB. Tuberculosis (Edinb). 2020; 120:101898. https://doi.org/10.1016/j.tube.2020.101898 [PubMed]
- 25. Berry MP, Graham CM, McNab FW, Xu Z, Bloch SA, Oni T, Wilkinson KA, Banchereau R, Skinner J, Wilkinson RJ, Quinn C, Blankenship D, Dhawan R, et al. An interferon-inducible neutrophil-driven blood transcriptional signature in human tuberculosis. Nature. 2010; 466:973–7. https://doi.org/10.1038/nature09247 [PubMed]
- 26. Maertzdorf J, Repsilber D, Parida SK, Stanley K, Roberts T, Black G, Walzl G, Kaufmann SH. Human gene expression profiles of susceptibility and resistance in tuberculosis. Genes Immun. 2011; 12:15–22. https://doi.org/10.1038/gene.2010.51 [PubMed]
- 27. Elliott TO, Owolabi O, Donkor S, Kampmann B, Hill PC, Ottenhoff TH, Haks MC, Kaufmann SH, Maertzdorf J, Sutherland JS. Dysregulation of Apoptosis Is a Risk Factor for Tuberculosis Disease Progression. J Infect Dis. 2015; 212:1469–79. https://doi.org/10.1093/infdis/jiv238 [PubMed]
- 28. Obermoser G, Presnell S, Domico K, Xu H, Wang Y, Anguiano E, Thompson-Snipes L, Ranganathan R, Zeitner B, Bjork A, Anderson D, Speake C, Ruchaud E, et al. Systems scale interactive exploration reveals quantitative and qualitative differences in response to influenza and pneumococcal vaccines. Immunity. 2013; 38:831–44. https://doi.org/10.1016/j.immuni.2012.12.008 [PubMed]
- 29. Maertzdorf J, Weiner J
3rd , Mollenkopf HJ, Bauer T, Prasse A, Müller-Quernheim J, Kaufmann SH, and TBornotTB Network. Common patterns and disease-related signatures in tuberculosis and sarcoidosis. Proc Natl Acad Sci U S A. 2012; 109:7853–8. https://doi.org/10.1073/pnas.1121072109 [PubMed] - 30. Kaforou M, Wright VJ, Oni T, French N, Anderson ST, Bangani N, Banwell CM, Brent AJ, Crampin AC, Dockrell HM, Eley B, Heyderman RS, Hibberd ML, et al. Detection of tuberculosis in HIV-infected and -uninfected African adults using whole blood RNA expression signatures: a case-control study. PLoS Med. 2013; 10:e1001538. https://doi.org/10.1371/journal.pmed.1001538 [PubMed]
- 31. Anderson ST, Kaforou M, Brent AJ, Wright VJ, Banwell CM, Chagaluka G, Crampin AC, Dockrell HM, French N, Hamilton MS, Hibberd ML, Kern F, Langford PR, et al. Diagnosis of childhood tuberculosis and host RNA expression in Africa. N Engl J Med. 2014; 370:1712–23. https://doi.org/10.1056/NEJMoa1303657 [PubMed]
- 32. Bloom CI, Graham CM, Berry MP, Wilkinson KA, Oni T, Rozakeas F, Xu Z, Rossello-Urgell J, Chaussabel D, Banchereau J, Pascual V, Lipman M, Wilkinson RJ, O'Garra A. Detectable changes in the blood transcriptome are present after two weeks of antituberculosis therapy. PLoS One. 2012; 7:e46191. https://doi.org/10.1371/journal.pone.0046191 [PubMed]
- 33. Verhagen LM, Zomer A, Maes M, Villalba JA, Del Nogal B, Eleveld M, van Hijum SA, de Waard JH, Hermans PW. A predictive signature gene set for discriminating active from latent tuberculosis in Warao Amerindian children. BMC Genomics. 2013; 14:74. https://doi.org/10.1186/1471-2164-14-74 [PubMed]
- 34. Bloom CI, Graham CM, Berry MP, Rozakeas F, Redford PS, Wang Y, Xu Z, Wilkinson KA, Wilkinson RJ, Kendrick Y, Devouassoux G, Ferry T, Miyara M, et al. Transcriptional blood signatures distinguish pulmonary tuberculosis, pulmonary sarcoidosis, pneumonias and lung cancers. PLoS One. 2013; 8:e70630. https://doi.org/10.1371/journal.pone.0070630 [PubMed]
- 35. Dawany N, Showe LC, Kossenkov AV, Chang C, Ive P, Conradie F, Stevens W, Sanne I, Azzoni L, Montaner LJ. Identification of a 251 gene expression signature that can accurately detect M. tuberculosis in patients with and without HIV co-infection. PLoS One. 2014; 9:e89925. https://doi.org/10.1371/journal.pone.0089925 [PubMed]
- 36. Cai Y, Yang Q, Tang Y, Zhang M, Liu H, Zhang G, Deng Q, Huang J, Gao Z, Zhou B, Feng CG, Chen X. Increased complement C1q level marks active disease in human tuberculosis. PLoS One. 2014; 9:e92340. https://doi.org/10.1371/journal.pone.0092340 [PubMed]
- 37. Ottenhoff TH, Dass RH, Yang N, Zhang MM, Wong HE, Sahiratmadja E, Khor CC, Alisjahbana B, van Crevel R, Marzuki S, Seielstad M, van de Vosse E, Hibberd ML. Genome-wide expression profiling identifies type 1 interferon response pathways in active tuberculosis. PLoS One. 2012; 7:e45839. https://doi.org/10.1371/journal.pone.0045839 [PubMed]
- 38. Tientcheu LD, Maertzdorf J, Weiner J, Adetifa IM, Mollenkopf HJ, Sutherland JS, Donkor S, Kampmann B, Kaufmann SH, Dockrell HM, Ota MO. Differential transcriptomic and metabolic profiles of M. africanum- and M. tuberculosis-infected patients after, but not before, drug treatment. Genes Immun. 2015; 16:347–55. https://doi.org/10.1038/gene.2015.21 [PubMed]
- 39. Lee SW, Wu LS, Huang GM, Huang KY, Lee TY, Weng JT. Gene expression profiling identifies candidate biomarkers for active and latent tuberculosis. BMC Bioinformatics. 2016 (Suppl 1); 17:3. https://doi.org/10.1186/s12859-015-0848-x [PubMed]
- 40. Esmail H, Lai RP, Lesosky M, Wilkinson KA, Graham CM, Horswell S, Coussens AK, Barry CE
3rd , O'Garra A, Wilkinson RJ. Complement pathway gene activation and rising circulating immune complexes characterize early disease in HIV-associated tuberculosis. Proc Natl Acad Sci U S A. 2018; 115:E964–73. https://doi.org/10.1073/pnas.1711853115 [PubMed] - 41. Walter ND, Miller MA, Vasquez J, Weiner M, Chapman A, Engle M, Higgins M, Quinones AM, Rosselli V, Canono E, Yoon C, Cattamanchi A, Davis JL, et al. Blood Transcriptional Biomarkers for Active Tuberculosis among Patients in the United States: a Case-Control Study with Systematic Cross-Classifier Evaluation. J Clin Microbiol. 2016; 54:274–82. https://doi.org/10.1128/JCM.01990-15 [PubMed]
- 42. Wang X, VanValkenberg A, Odom-Mabey AR, Ellner JJ, Hochberg NS, Salgame P, Patil P, Johnson WE. Comparison of gene set scoring methods for reproducible evaluation of multiple tuberculosis gene signatures. bioRxiv. 2023. https://doi.org/10.1101/2023.01.19.520627 [PubMed]
- 43. Blankley S, Graham CM, Turner J, Berry MP, Bloom CI, Xu Z, Pascual V, Banchereau J, Chaussabel D, Breen R, Santis G, Blankenship DM, Lipman M, O'Garra A. The Transcriptional Signature of Active Tuberculosis Reflects Symptom Status in Extra-Pulmonary and Pulmonary Tuberculosis. PLoS One. 2016; 11:e0162220. https://doi.org/10.1371/journal.pone.0162220 [PubMed]
- 44. Marais S, Lai RPJ, Wilkinson KA, Meintjes G, O'Garra A, Wilkinson RJ. Inflammasome Activation Underlying Central Nervous System Deterioration in HIV-Associated Tuberculosis. J Infect Dis. 2017; 215:677–86. https://doi.org/10.1093/infdis/jiw561 [PubMed]
- 45. de Araujo LS, Vaas LA, Ribeiro-Alves M, Geffers R, Mello FC, de Almeida AS, Moreira AD, Kritski AL, Lapa E Silva JR, Moraes MO, Pessler F, Saad MH. Transcriptomic Biomarkers for Tuberculosis: Evaluation of DOCK9. EPHA4, and NPC2 mRNA Expression in Peripheral Blood. Front Microbiol. 2016; 7:1586. https://doi.org/10.3389/fmicb.2016.01586 [PubMed]
- 46. Thompson EG, Du Y, Malherbe ST, Shankar S, Braun J, Valvo J, Ronacher K, Tromp G, Tabb DL, Alland D, Shenai S, Via LE, Warwick J, et al, and Catalysis TB–Biomarker Consortium. Host blood RNA signatures predict the outcome of tuberculosis treatment. Tuberculosis (Edinb). 2017; 107:48–58. https://doi.org/10.1016/j.tube.2017.08.004 [PubMed]
- 47. Suliman S, Thompson EG, Sutherland J, Weiner J
3rd , Ota MOC, Shankar S, Penn-Nicholson A, Thiel B, Erasmus M, Maertzdorf J, Duffy FJ, Hill PC, Hughes EJ, et al, and GC6-74 cohort study team, The ACS cohort study team. Four-Gene Pan-African Blood Signature Predicts Progression to Tuberculosis. Am J Respir Crit Care Med. 2018; 197:1198–208. https://doi.org/10.1164/rccm.201711-2340OC [PubMed] - 48. Li H, Du W, Sharma A, Huang X, Liu R, Ye F, Li X. NetPSig: Computationally guided neutrophil extracellular trap-associated signature significantly predicts the prognosis and therapeutic response in breast cancer. Res Sq. 2023. https://doi.org/10.21203/rs.3.rs-2638739/v1
- 49. Hao Y, Hao S, Andersen-Nissen E, Mauck WM
3rd , Zheng S, Butler A, Lee MJ, Wilk AJ, Darby C, Zager M, Hoffman P, Stoeckius M, Papalexi E, et al. Integrated analysis of multimodal single-cell data. Cell. 2021; 184:3573–3587.e29. https://doi.org/10.1016/j.cell.2021.04.048 [PubMed] - 50. Jin S, Guerrero-Juarez CF, Zhang L, Chang I, Ramos R, Kuan CH, Myung P, Plikus MV, Nie Q. Inference and analysis of cell-cell communication using CellChat. Nat Commun. 2021; 12:1088. https://doi.org/10.1038/s41467-021-21246-9 [PubMed]
- 51. Liaw A, Wiener M. Classification and regression by randomForest. R news. 2002; 2:18–22. https://journal.r-project.org/articles/RN-2002-022/RN-2002-022.pdf.
- 52. Hänzelmann S, Castelo R, Guinney J. GSVA: gene set variation analysis for microarray and RNA-seq data. BMC Bioinformatics. 2013; 14:7. https://doi.org/10.1186/1471-2105-14-7 [PubMed]
- 53. Signorell A, Aho K, Alfons A, Anderegg N, Aragon T, Arppe A, Baddeley A, Barton K, Bolker B, Borchers HW. DescTools: Tools for descriptive statistics. R package version 099. 2019; 28:17.
- 54. Wilkerson MD, Hayes DN. ConsensusClusterPlus: a class discovery tool with confidence assessments and item tracking. Bioinformatics. 2010; 26:1572–3. https://doi.org/10.1093/bioinformatics/btq170 [PubMed]
- 55. Stuart T, Butler A, Hoffman P, Hafemeister C, Papalexi E, Mauck WM
3rd , Hao Y, Stoeckius M, Smibert P, Satija R. Comprehensive Integration of Single-Cell Data. Cell. 2019; 177:1888–1902.e21. https://doi.org/10.1016/j.cell.2019.05.031 [PubMed] - 56. Yu G, Wang LG, Han Y, He QY. clusterProfiler: an R package for comparing biological themes among gene clusters. OMICS. 2012; 16:284–7. https://doi.org/10.1089/omi.2011.0118 [PubMed]
- 57. Newman AM, Liu CL, Green MR, Gentles AJ, Feng W, Xu Y, Hoang CD, Diehn M, Alizadeh AA. Robust enumeration of cell subsets from tissue expression profiles. Nat Methods. 2015; 12:453–7. https://doi.org/10.1038/nmeth.3337 [PubMed]
- 58. Aran D, Hu Z, Butte AJ. xCell: digitally portraying the tissue cellular heterogeneity landscape. Genome Biol. 2017; 18:220. https://doi.org/10.1186/s13059-017-1349-1 [PubMed]
- 59. Wigerblad G, Kaplan MJ. Neutrophil extracellular traps in systemic autoimmune and autoinflammatory diseases. Nat Rev Immunol. 2023; 23:274–88. https://doi.org/10.1038/s41577-022-00787-0 [PubMed]
- 60. Li X, Xiao S, Filipczak N, Yalamarty SSK, Shang H, Zhang J, Zheng Q. Role and Therapeutic Targeting Strategies of Neutrophil Extracellular Traps in Inflammation. Int J Nanomedicine. 2023; 18:5265–87. https://doi.org/10.2147/IJN.S418259 [PubMed]
- 61. Wen H, Wang Y. Identification of key immune biomarkers and key immune cells in lumbar disc herniation. Res Sq. 2023. https://doi.org/10.21203/rs.3.rs-2676210/v1
- 62. Xu Y, Qiang L, Wu F, Liu Y, Jin S. Bioinformatics analyses of NET-related hub genes in chronic obstructive pulmonary disease and their association with immune infiltration. Res Sq. 2023. https://doi.org/10.21203/rs.3.rs-3420350/v1
- 63. Ma X, Wang F, Zhen L, Cai Q. Hsa_circ_0001204 modulates inflammatory response of macrophages infected by Mycobacterium tuberculosis via TLR4/NF-κB signalling pathway. Clin Exp Pharmacol Physiol. 2023; 50:132–9. https://doi.org/10.1111/1440-1681.13716 [PubMed]
- 64. Pellegrino E, Aylan B, Bussi C, Fearns A, Bernard EM, Athanasiadi N, Santucci P, Botella L, Gutierrez MG. Peroxisomal ROS control cytosolic Mycobacterium tuberculosis replication in human macrophages. J Cell Biol. 2023; 222:e202303066. https://doi.org/10.1083/jcb.202303066 [PubMed]
- 65. Ellzey LM, Patrick KL, Watson RO. Mitochondrial reactive oxygen species: double agents in Mycobacterium tuberculosis infection. Curr Opin Immunol. 2023; 84:102366. https://doi.org/10.1016/j.coi.2023.102366 [PubMed]
- 66. Boni FG, Hamdi I, Koundi LM, Shrestha K, Xie J. Cytokine storm in tuberculosis and IL-6 involvement. Infect Genet Evol. 2022; 97:105166. https://doi.org/10.1016/j.meegid.2021.105166 [PubMed]
- 67. Baazim H, Antonio-Herrera L, Bergthaler A. The interplay of immunology and cachexia in infection and cancer. Nat Rev Immunol. 2022; 22:309–21. https://doi.org/10.1038/s41577-021-00624-w [PubMed]
- 68. Szuber N, Tefferi A. Chronic neutrophilic leukemia: new science and new diagnostic criteria. Blood Cancer J. 2018; 8:19. https://doi.org/10.1038/s41408-018-0049-8 [PubMed]
- 69. Ma S, Peng P, Duan Z, Fan Y, Li X. Predicting the Progress of Tuberculosis by Inflammatory Response-Related Genes Based on Multiple Machine Learning Comprehensive Analysis. J Immunol Res. 2023; 2023:7829286. https://doi.org/10.1155/2023/7829286 [PubMed]
- 70. García-Bengoa M, Meurer M, Stehr M, Elamin AA, Singh M, Oehlmann W, Mörgelin M, von Köckritz-Blickwede M. Mycobacterium tuberculosis PE/PPE proteins enhance the production of reactive oxygen species and formation of neutrophil extracellular traps. Front Immunol. 2023; 14:1206529. https://doi.org/10.3389/fimmu.2023.1206529 [PubMed]
- 71. Su R, Peng YP, Deng Z, Deng YT, Ye JQ, Guo Y, Huang ZK, Luo Q, Jiang H, Li JM. Mycobacterium tuberculosis Infection Induces Low-Density Granulocyte Generation by Promoting Neutrophil Extracellular Trap Formation via ROS Pathway. Front Microbiol. 2019; 10:1468. https://doi.org/10.3389/fmicb.2019.01468 [PubMed]
- 72. Roca FJ, Whitworth LJ, Prag HA, Murphy MP, Ramakrishnan L. Tumor necrosis factor induces pathogenic mitochondrial ROS in tuberculosis through reverse electron transport. Science. 2022; 376:eabh2841. https://doi.org/10.1126/science.abh2841 [PubMed]
- 73. Bao S, Zhao H, Yuan J, Fan D, Zhang Z, Su J, Zhou M. Computational identification of mutator-derived lncRNA signatures of genome instability for improving the clinical outcome of cancers: a case study in breast cancer. Brief Bioinform. 2020; 21:1742–55. https://doi.org/10.1093/bib/bbz118 [PubMed]
- 74. Li H, Liu H, Hao Q, Liu X, Yao Y, Cao M. Oncogenic signaling pathway-related long non-coding RNAs for predicting prognosis and immunotherapy response in breast cancer. Front Immunol. 2022; 13:891175. https://doi.org/10.3389/fimmu.2022.891175 [PubMed]
- 75. Du W, Huang X, Liu R, Ye F, Li X, Sun B, Li H. Transcriptome analysis of tertiary lymphoid structures (TLSs)-related genes reveals prognostic value and immunotherapeutic potential in cancer. Oncologie. 2024; 26:287–300. https://doi.org/10.1515/oncologie-2023-0372
- 76. Chen Y, Gu Y, Hu Z, Sun X. Sample-specific perturbation of gene interactions identifies breast cancer subtypes. Brief Bioinform. 2021; 22:bbaa268. https://doi.org/10.1093/bib/bbaa268 [PubMed]
- 77. Luo J, Li D, Jiang L, Shi C, Duan L. Identification of Tregs-Related Genes with Molecular Patterns in Patients with Systemic Sclerosis Related to ILD. Biomolecules. 2023; 13:535. https://doi.org/10.3390/biom13030535 [PubMed]
- 78. Li L, Li F, Xie K, Zhou P, Zhu H, Du L, Yang P, Jin X. Key common genes and pathways in ulcerative colitis and ankylosing spondylitis based on bioinformatics analysis. bioRxiv. 2023. https://doi.org/10.1101/2023.04.20.537616