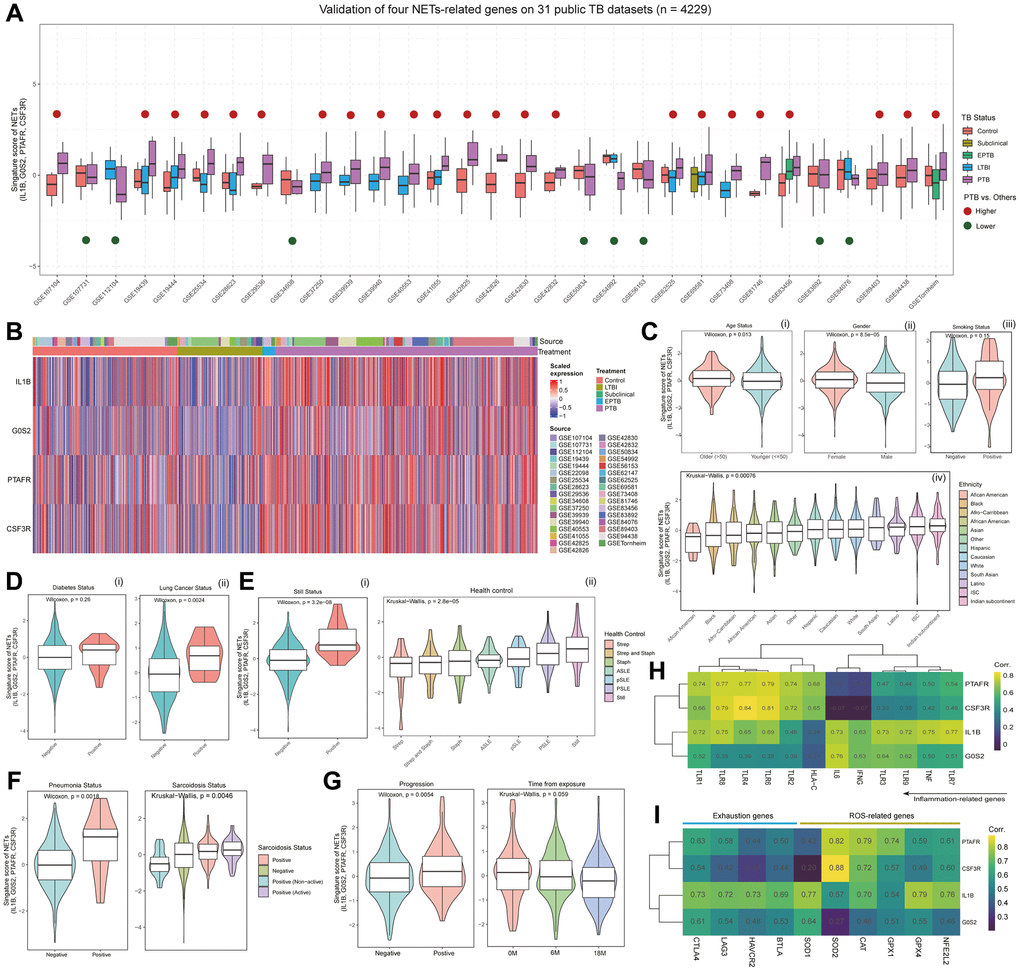
Figure 2.Multi-faceted analysis of NETs signature scores and gene expression patterns in TB patients. (A) Boxplot showing the distribution of signature scores for NETs, composed of IL1B, G0S2, PTAFR, and CSF3R, across different statuses in 31 publicly available TB datasets (with a total of 4209 samples). Red points above the box indicate that the scores in pulmonary tuberculosis (PTB) are higher than in other statuses, while green points below the box suggest lower scores in PTB compared to other statuses. (B) Heatmap depicting the expression levels of IL1B, G0S2, PTAFR, and CSF3R in patients from 31 TB datasets. Column annotations under “Source” represent the dataset to which the sample belongs, while column annotations under “Treatment” indicate the clinical status of the patients. (C) Violin plots showing the distribution of signature scores based on demographic features, including age status (i), gender (ii), smoking status (iii), and ethnicity status (iv). P-values were determined using the Wilcoxon or Kruskal-Wallis tests. (D) Violin plots showing the distribution of signature scores in TB patients with complications, including diabetes (i), and lung cancer (ii). P-values were obtained through the Wilcoxon test. (E) Violin plots showing the distribution of signature scores in TB patients with bacterial infection (i, ii) or autoimmune disease (ii). P-values were obtained through the Wilcoxon test or Kruskal-Wallis test. (F) Violin plots showing the distribution of signature scores in different health states of patients with pneumonia and sarcoidosis. P-values were determined using the Wilcoxon test or Kruskal-Wallis test. (G) Violin plots showing the distribution of signature scores at different stages of TB progression. P-values were obtained through the Wilcoxon test or Kruskal-Wallis test. (H) Heatmap presenting the co-expression relationships between the gene expression of IL1B, G0S2, PTAFR, and CSF3R, and inflammation-related genes. (I) Heatmap showing the co-expression relationships between the gene expression of IL1B, G0S2, PTAFR, and CSF3R, and genes associated with T cell exhaustion and reactive oxygen species (ROS) pathway.