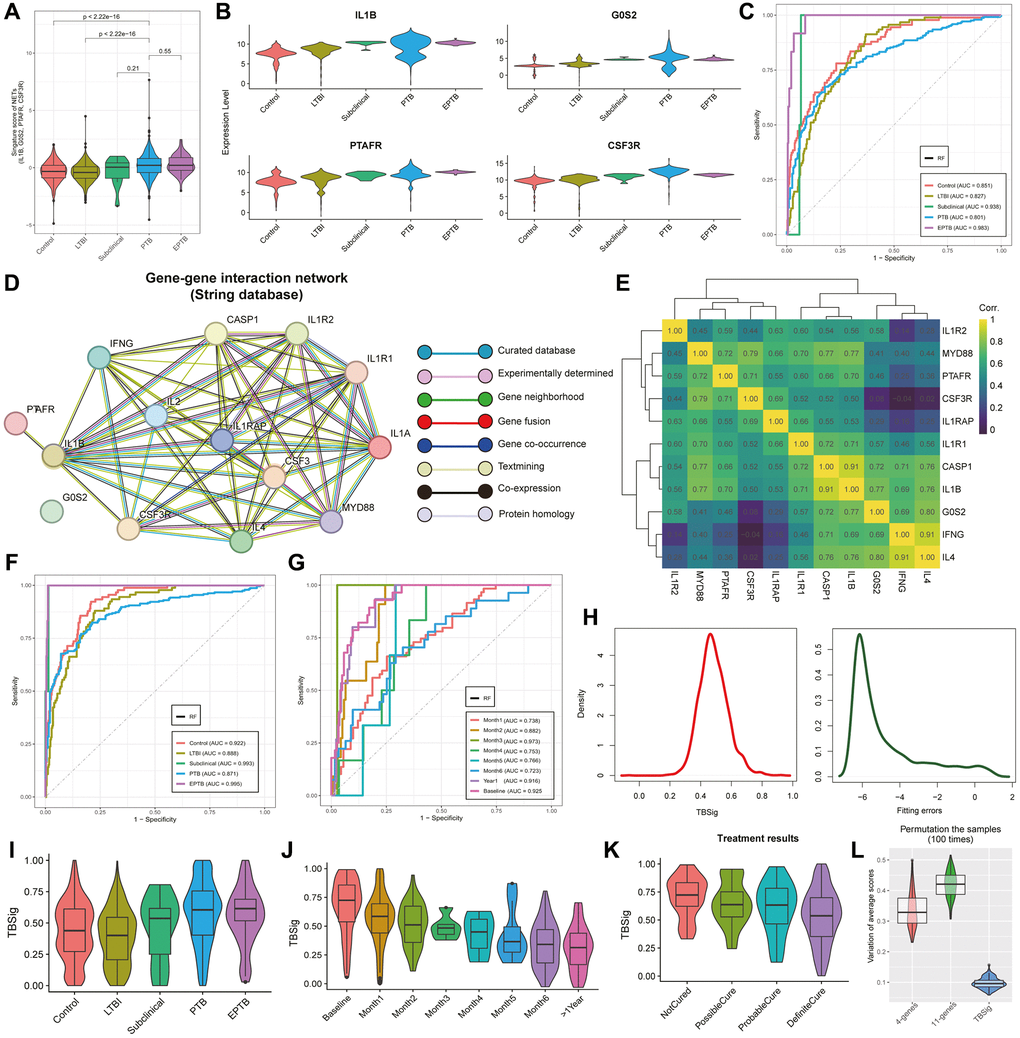
Figure 3.Unveiling TB progression insights with emphasis on TBSig score through NETs-related genes. (A) Violin plots showing the distribution of signature scores (IL1B, G0S2, PTAFR, and CSF3R) across various stages of progression in pulmonary tuberculosis (PTB). The stages include Control, Latent Tuberculosis Infection (LTBI), Subclinical, PTB, and Extrapulmonary Tuberculosis (EPTB). (B) Violin plots showing the expression distribution of IL1B, G0S2, PTAFR, and CSF3R in different stages of progression in PTB patients. (C) The Area Under the Curve (AUC) curves showcase the predictive performance of a random forest classifier built with IL1B, G0S2, PTAFR, and CSF3R as features, across different diagnostic type of TB patients. (D) Network diagram showing gene interactions from the STRING database associated with IL1B, G0S2, PTAFR, and CSF3R. Different lines represent the sources of gene interaction relationships. (E) Heatmap showing the expression correlations of 11 highly interacting genes. Colors trending towards yellow indicate stronger correlations. (F, G) AUC curves showing the predictive performance of a random forest classifier constructed with 11 genes as features for different diagnostic types of TB (F) and various time stages leading up to the occurrence of TB (G). (H) Density curve plots showing the distribution of predicted scores constructed from 11 genes (left side) and the fitted error distribution (right side). (I) Violin combined with box plots showing the distribution of TBSig scores across different stages of progression in TB patients. (J) Violin combined with box plots showing the distribution of TBSig scores at different time stages leading up to the occurrence of TB patients. (K) Violin combined with box plots showing the distribution of TBSig scores under different states after treatment. (L) Violin combined with box plots showing the variability in the average scores of 4-genes, 11-genes, and TBSig across diverse datasets. For each iteration, 500 samples were randomly subsampled from the dataset, and this process was repeated 100 times. TBSig consistently demonstrated the least perturbation variability across all datasets.