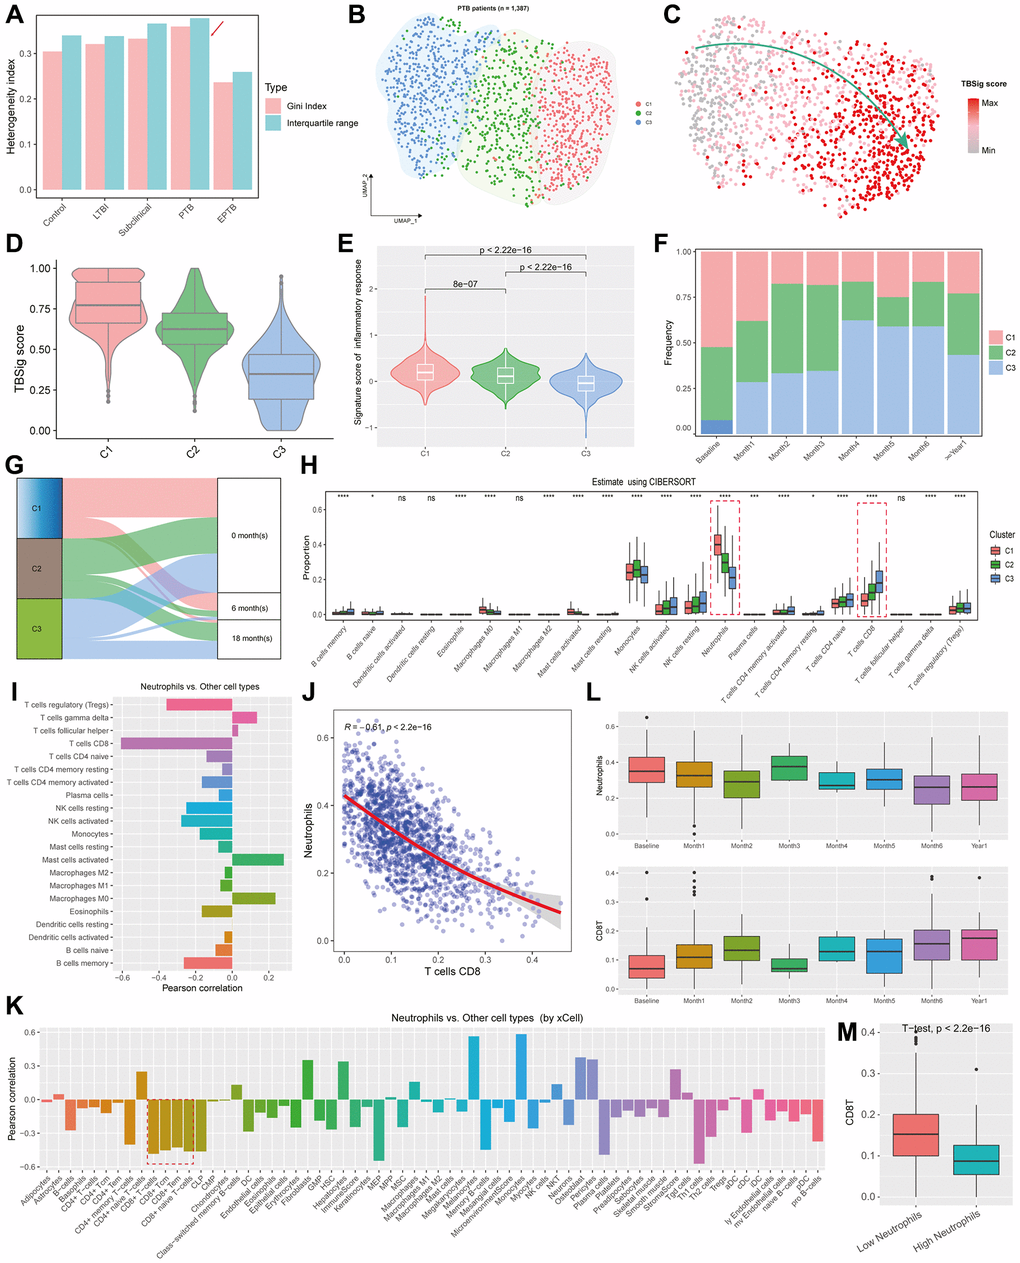
Figure 4.Exploration of inferred PTB subtypes based on NETs-related genes. (A) Bar plots showing the heterogeneity indexes of the diagnostic types of TB patients based on Gini index and Interquartile range. (B) UMAP showing the distribution of different PTB subtypes, with each point representing an individual sample, and distinct colors indicating PTB categories. (C) Projection of TBSig scores for PTB patients onto UMAP. Each dot represents an individual PTB patient. (D) Violin plots combined with box plots showing the distribution of TBSig scores within different PTB subtypes. (E) Violin plots showing the activity scores of inflammation-related gene sets across different subtypes, with p-values obtained from t-tests. (F) Proportions of different PTB subtypes at various time stages relative to the occurrence of TB. (G) Sankey diagram showing the mapping relationships between different PTB subtypes and stages of PTB outbreaks. (H) Box plots showing the proportions of distinct cell types infiltrating various PTB subtypes, as estimated by CIBERSORT. nsp > 0.05; *p < 0.01; **p < 0.001; ***p < 0.0001; ****p < 0.00001. (I) Bar plot showing the Pearson correlations between Neutrophils with other immune cell types. (J) Scatter plot with a fitted line showing the association between Neutrophils and CD8+ T cells. Each dot represents an individual PTB patient. “R” indicates the Pearson correlation, and the p-value is obtained by t-test. (K) Bar plot showing the Pearson correlations between Neutrophils and other cell types, as estimated by xCell. (L) Box plots showing the distribution of Neutrophils and CD8+ T cells at different time stages relative to the onset of PTB outbreak. (M) Box plot showing the difference of CD8+ T cell fractions between low and high Neutrophil infiltration. P-value was obtained by t-test.