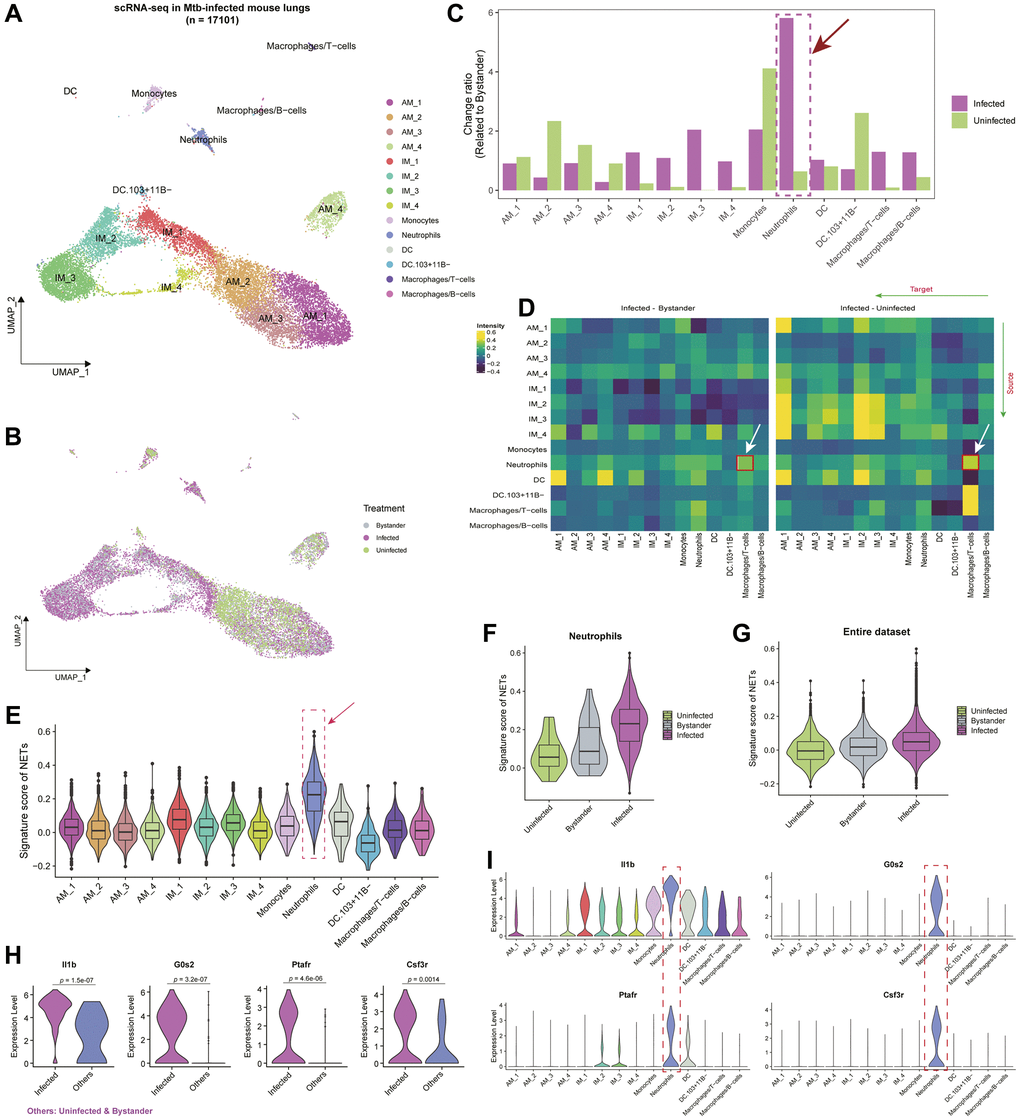
Figure 1.Interplay of cell types and neutrophil extracellular traps (NETs) in the single-cell landscape of Mtb infected mouse lung tissue. (A) Uniform Manifold Approximation and Projection (UMAP) showing the single-cell atlas of Mtb-infected mouse lung tissue [21]. Each point represents an individual cell, with distinct cell types marked by color codes. (B) UMAP showing the cell distribution based on uninfected, infected, and bystander statuses in mice. (C) Bar plot showing the change ratio of cell type fractions related to bystander mice. Notably, neutrophils exhibit the highest changes compared to uninfected mice and other cell types. (D) Heatmap showcasing ligand-receptor interactions within the mouse lung microenvironment. Greater inclination towards yellow indicates higher interactions among different cell types in the Infected group compared to bystander or uninfected status. (E) Violin plot coupled with a boxplot, revealing the signature scores of a gene set composed of neutrophil extracellular trap-related genes (NETs) in various cell types. (F, G) Violin plots showing the signature scores of NETs in Neutrophils (F) and the entire single-cell dataset (G) across different Mtb-infected statuses. (H) Violin plot showing the expression levels of Il1b, G0s2, Ptafr, and Csf3r between infected and Others (i.e., bystander and uninfected) statuses. P-values were obtained by t-test. (I) Violin plots showing the expression levels of Il1b, G0s2, Ptafr, and Csf3r across different cell types.