


Introduction
Primary hepatocellular carcinoma (HCC) is a highly invasive malignant tumor posing a significant burden on healthcare globally. Its 5-year survival rate is less than 21% [1]. HCC is the main type of liver cancer, accounting for 90% of all reported liver cancer cases and the fourth leading cause of cancer deaths worldwide [2]. The development of HCC is driven by several factors, among which angiogenesis is the most important biological feature considered to be a key treatment target [3]. Angiogenesis is a process in which new blood vessels are formed from existing ones to build new vascular networks. Angiogenesis have been implicated in numerous physiological processes, like the tissue repair, embryonic development and inflammatory response. However, in pathological situations, such as tumors, excessive angiogenesis provides nutrients and oxygen to tumor cells thereby promoting tumor growth, invasion, and metastasis [4–7]. HCC is a highly angiogenic tumor, and the level of its angiogenesis correlates with the degree of the tumor stage, grade, prognosis, and therapeutic efficacy [8].
Angiogenesis is a complex process involving multiple cellular and molecular interactions. In this process, vascular endothelial growth factor (VEGF) functions as a crucial role, which can bind to its receptor (VEGFR), thereby activating multiple signaling pathways to regulate the functions of vascular endothelial cells, such as proliferation, migration, lumen formation, and vascular permeability, etc. [9–12]. VEGF expression in HCC is modulated by various factors, such as hypoxia, inflammation, tumor microenvironment, and gene mutations [13–15]. VEGF is the dominant factor influencing HCC angiogenesis, and its level is closely associated with the degree of malignancy, metastatic ability and prognosis of HCC [3, 16, 17]. In addition, VEGF not only regulates HCC angiogenesis, but also affects the biological characteristics of HCC cells, like the proliferation, apoptosis, invasion and metastasis [18, 19]. Therefore, VEGF is an important molecular marker and therapeutic target for HCC, and drugs targeting VEGF or VEGFR have shown promising potential in the clinical treatment of HCC [20–23].
To date, several prognostic prediction models based on angiogenesis-related genes have been developed for HCC, but no study has investigated this key factor of HCC angiogenesis in detail. Moreover, the role of VEGF in hepatocellular carcinoma angiogenesis is not fully understood [24–27]. Moreover, considering the heterogeneity and complexity of hepatocellular carcinoma, the detection and inhibition of VEGF or VEGFR alone may not be sufficient to reflect and predict the angiogenic status and therapeutic efficacy of HCC [28]. Therefore, it is necessary to explore the gene expression profiles of VEGF from a global perspective to build a gene signature that might comprehensively assess and predict microangiogenesis and prognosis of HCC patients. For our design, we constructed a gene signature capable of predicting microangiogenesis and prognosis of HCC by screening genes associated with VEGF production. Its clinical significance and biological function in HCC were validated.
Materials and Methods
Public data and collection of samples
Clinical, molecular, and whole-genome RNA-seq expression data were downloaded from TCGA database (https://portal.gdc.cancer.gov/). After exclusion of samples without prognostic information or incomplete clinical information, 374 HCC samples were included. In addition, the TCGA database was used to obtain whole-genome RNA-seq expression data of 50 normal liver samples. A total of 232 HCC patient samples were retrieved from International Cancer Genome Consortium (ICGC) database (https://dcc.icgc.org/). Moreover, the GSE76427, which includes the expression and corresponding clinical data of another 114 HCC patient samples, was gained from the Gene Expression Omnibus (GEO) database (https://www.ncbi.nlm.nih.gov/geo/). The samples were merged and standardized to create validation sets. We excluded cases with less than or exactly 10 days of survival or patients without survival data since they could have died from unrelated complications. In such cases, 50 normal liver samples and 310 HCC samples from TCGA, 231 HCC samples from ICGC, and 114 HCC samples from GSE76427, were selected for subsequent analyses. Furthermore, we considered the possibility of batch effects present among different databases as well as within the same database. To address this issue, “normalize between arrays” function [29, 30] of R package “limma” was utilized to remove multiple batch influences when merging the mRNA_seq data of ICGC, TCGA and GSE76427.
Patient samples
The tissues were obtained with informed consent from all participating patients. Six control samples were collected between September 2019 and June 2022, five samples from patients with HCC and five samples from non-tumor liver tissues. Preoperative chemotherapy or radiotherapy was not used to treat any of the HCCs. Independent samples from our hospital were verified by the hub genes of GSRS mRNA levels in HCC.
Identifying differentially expressed genes between normal liver tissues and hepatocellular carcinoma
The training set was established using HCC and correlated normal liver samples from TCGA databases. DEGs were identified from Vascular endothelial growth factor Production-RGlated genes (VPRGs) using the R package “limma” [30]. The criterion set for this study was a p-value less than 0.05, with an abs value of logFC greater than 0.585.
Protein-protein interaction network analysis
The STRING database (https://cn.string-db.org/) was used to construct the PPI network containing 34 VPRGs. Nodes with interaction confidences greater than 0.4 were displayed.
Principal components analysis
The samples were divided into low and high-risk groups based on the median risk scores. The Principal Component Analysis (PCA) was employed to clarify the variances among these two groups. The variation in mRNA expression data among the high and low-risk groups in TCGA-, ICGC- and GSE76427-HCC datasets were observed using dimensionality reduction.
Tumor-infiltrating immune cells profiles
The population of immune cells in low-risk and high-risk groups was estimated using the CIBERSORT computational method. In both the TCGA and ICGC-HCC cohorts, we utilized Pearson correlation analysis and the Wilcoxon test to examine the association between the fraction of Tumor-Infiltrating Immune Cells (TIICs) and the risk score. We then utilized the ESTIMATE algorithm, specifically the “estimate” package, to calculate the immune score, stromal score and tumor purity for each HCC sample [33].
Single-sample gene sets enrichment analysis
All significant genes of the 29 immune-related pathways were obtained from a previous study [34]. The TIICs level was estimated by the single-sample GSEA (ssGSEA; [35]) using melanoma mRNA Tumor Mutation Burden (TMB) data. Moreover, the enrichment level of gene hallmarks for 29 hallmarks related to immune was analyzed in the training and verification cohorts, among the low and high-risk groups, with a significance threshold of p-value < 0.05. Additionally, given the significance of Immune Checkpoints (ICPs) and Immunogenic Cell Death (ICD) modulators in cancer immunity, the expression levels of these proteins were compared among the high and low-risk groups.
Analysis of tumor mutational load
In the TCGA-HCC dataset, total tumor somatic mutations detected in each sample was used for computation. The prognostic value of TMB in HCC was also analyzed. The R package “maftools” was applied to calculate and compare the mutational status in high and low-risk groups.
Analysis of hallmark gene sets
Further analysis focused on hallmark gene sets derived from the Molecular Signatures Database. These sets represent and summarize explicit, well-defined biological states or displays and processes that are coherently expressed. The R package “GSVA” was applied on low and high-risk groups in TCGA-HCC to implement GSVA of hallmark gene sets [36].
Quantitative real-time PCR (qRT-PCR)
RNA was extracted from liver tissues using the TRIzol reagent (as described in [37]) for qRT-PCR analysis. SYBR Green assays and specific primers were used to quantify gene expression. Relative Ct values, normalized to GAPDH, were employed to compare gene expression between the experimental and control groups.
Data availability statement
The authors will unreservedly share raw data that support the conclusions of this article.
Results
Genetic alterations of vascular endothelial growth factor production-related genes in hepatocellular carcinoma
We performed a differential analysis of 34 VPRGs in the training group and identified 22 DEGs between normal and HCC cases (Figure 1A, 1B). Supplementary Table 1 shows the upregulated and downregulated VPRGs with their analogous logFC values. In addition, Spearman’s correlation analysis was performed to characterize the expression correlations among the VPRGs and the results were presented in Figure 1C. A PPI network analysis also revealed a substantial co-expression correlation among the VPRGs, as demonstrated in Supplementary Figure 1A. Additionally, for further understanding of the genomic characteristics of VPRGs in HCC, we analyzed somatic mutational status and the copy number variation of GSRGs using the cBioPortal database (Supplementary Figure 1B).
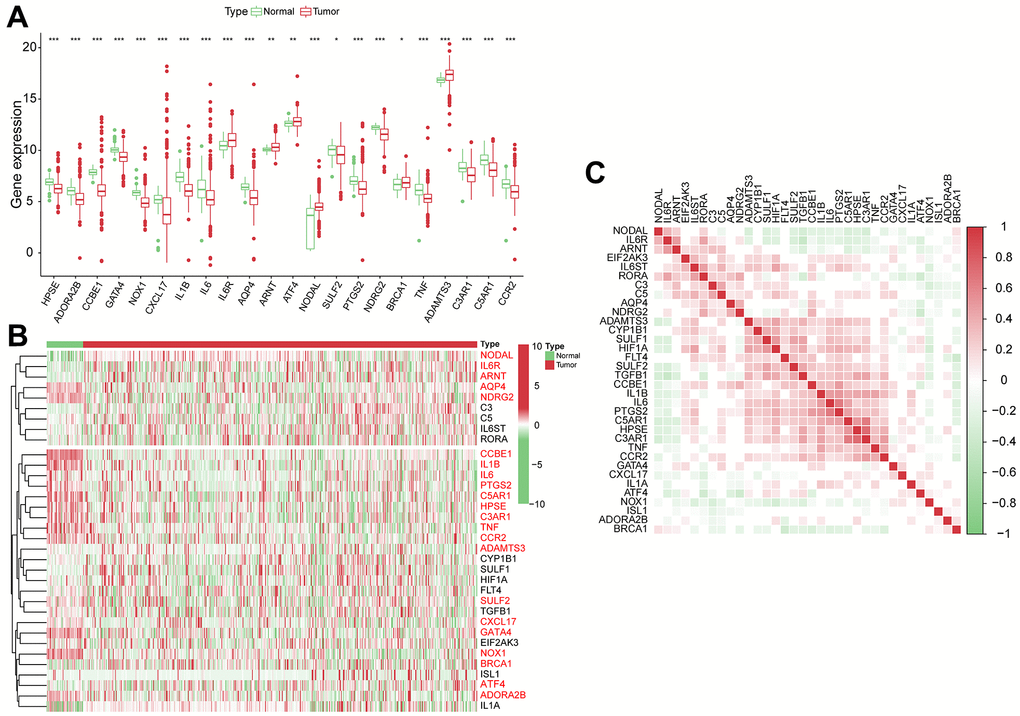
Figure 1. The genomic characterization of VPRGs. (A) Boxplot for differentially expressed VPRGs. (B) Heatmap for differentially expressed VPRGs; genes with red color are significantly differently expressed between normal liver tissues and HCC tissues. (C) Correlation plot for VPRGs; red and green squares indicate positive and inverse correlation respectively. ***p < 0.001, **p < 0.001, *p < 0.05.
Construction and verification of vascular endothelial growth factor production-related risk signature
From 34 VPRGs, univariate Cox analysis identified 7 genes significantly correlated with prognosis (p < 0.05) (Figure 2A). LASSO regression further narrowed this down to 4 key genes: ADAMTS3, CCR2, NDRG2, and NODAL (Supplementary Figure 2A, 2B). A risk score was then calculated for each patient based on the expression levels and coefficients of these 4 genes (Figure 2B). The PCA results further revealed significant separation between high- and low-risk groups based on the median VPRS in both training and validation sets (Figure 2C, 2D and Supplementary Figure 2C).
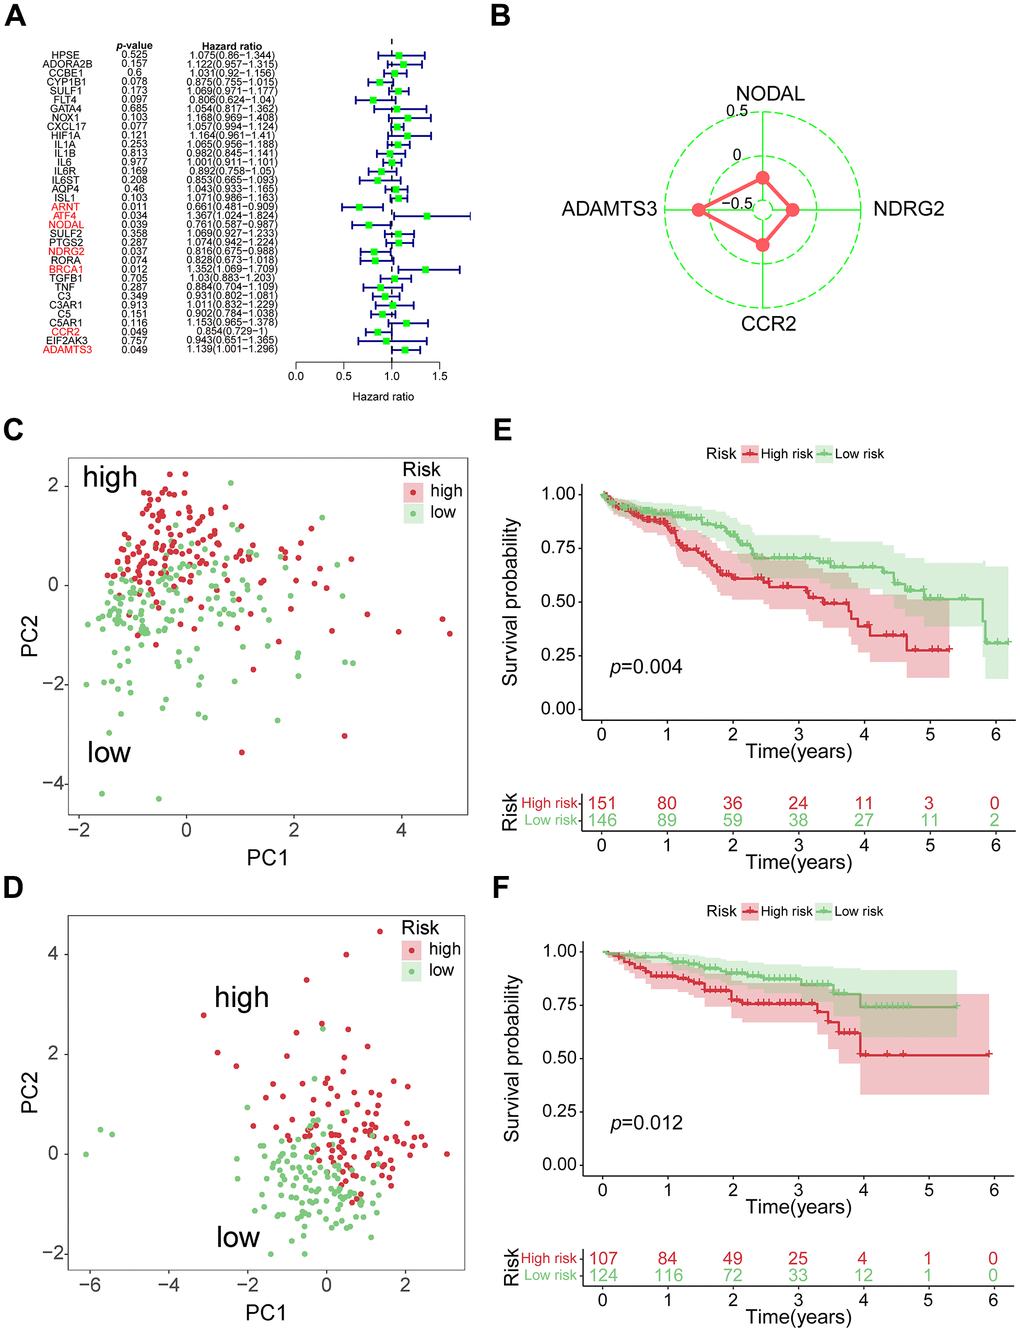
Figure 2. Construction of 4-genes VPRS. (A) Forest plot for the survival analysis of HCC patients with a univariate Cox model after adjustment for VPRGs; red color represents p < 0.05. (B) Radar diagram of efficiency of the 4 genes in VPRS; the closer the red dot is to the outside, the greater the value it represents. (C) PCA of HCC samples in TCGA; dots in red and green represent samples in high-risk and low-risk groups respectively. (D) Overall survival analysis of risk score for HCC patients in TCGA. (E) PCA in ICGC-HCC. (F) Survival analysis in ICGC-HCC.
Survival analysis demonstrated significantly different clinical outcomes between the high- and low-risk groups in both training and validation sets (Figure 2E, 2F and Supplementary Figure 2D). Notably, the VPRS across TCGA, ICGC, and GSE76427-HCC datasets exhibited distinct patterns in risk gene expression, risk scores, and survival states, highlighting the VPRS’s potential as a valuable prognostic predictor compared to other clinical factors (Supplementary Figure 2E–2G). Supplementary Table 2 summarizes the 4 genes and their corresponding coefficients in the optimal model. Altogether, above results demonstrated that the risk score based on VPRS could be a better indicator for predicting the prognosis of HCC compared with other clinical factors.
The risk score acts as an independent factor for predicting overall survival of hepatocellular carcinoma patients
We conducted both univariate and multivariate COX analysis to assess the independent prognostic value of the VPRS to predict the outcomes of HCC patients. In the TCGA-HCC group, the risk score independently predicted the OS (overall survival) (HR = 2.137, p = 0.002) (Figure 3A, 3B). Additionally, the risk score exhibited a higher AUC-ROC unlike additional clinical features, including age, gender, ECOG, vascular invasion, tumor grade, and stage. The AUC of the risk score in the training group was 0.679, 0.753, and 0.684 for 1-, 3-, and 5-year OS of patients, respectively (Figure 3C–3E). The findings were also validated in the ICGC- and GSE76427-HCC cohort. In multivariate COX regression, the risk score had an HR of 1.320 in ICGC (Figure 3F, 3G, p = 0.031), while it was 1.226 in GSE76427 (Supplementary Figure 3A, 3B, p = 0.039). Moreover, the AUC values of 1-, 3-, and 5-year OS of patients in ICGC-HCC were 0.692, 0.591, and 0.539, respectively (Figure 3H–3J), while there were 0.474, 0.419, and 0.473 in GSE76427-HCC, respectively (Supplementary Figure 3C–3E).
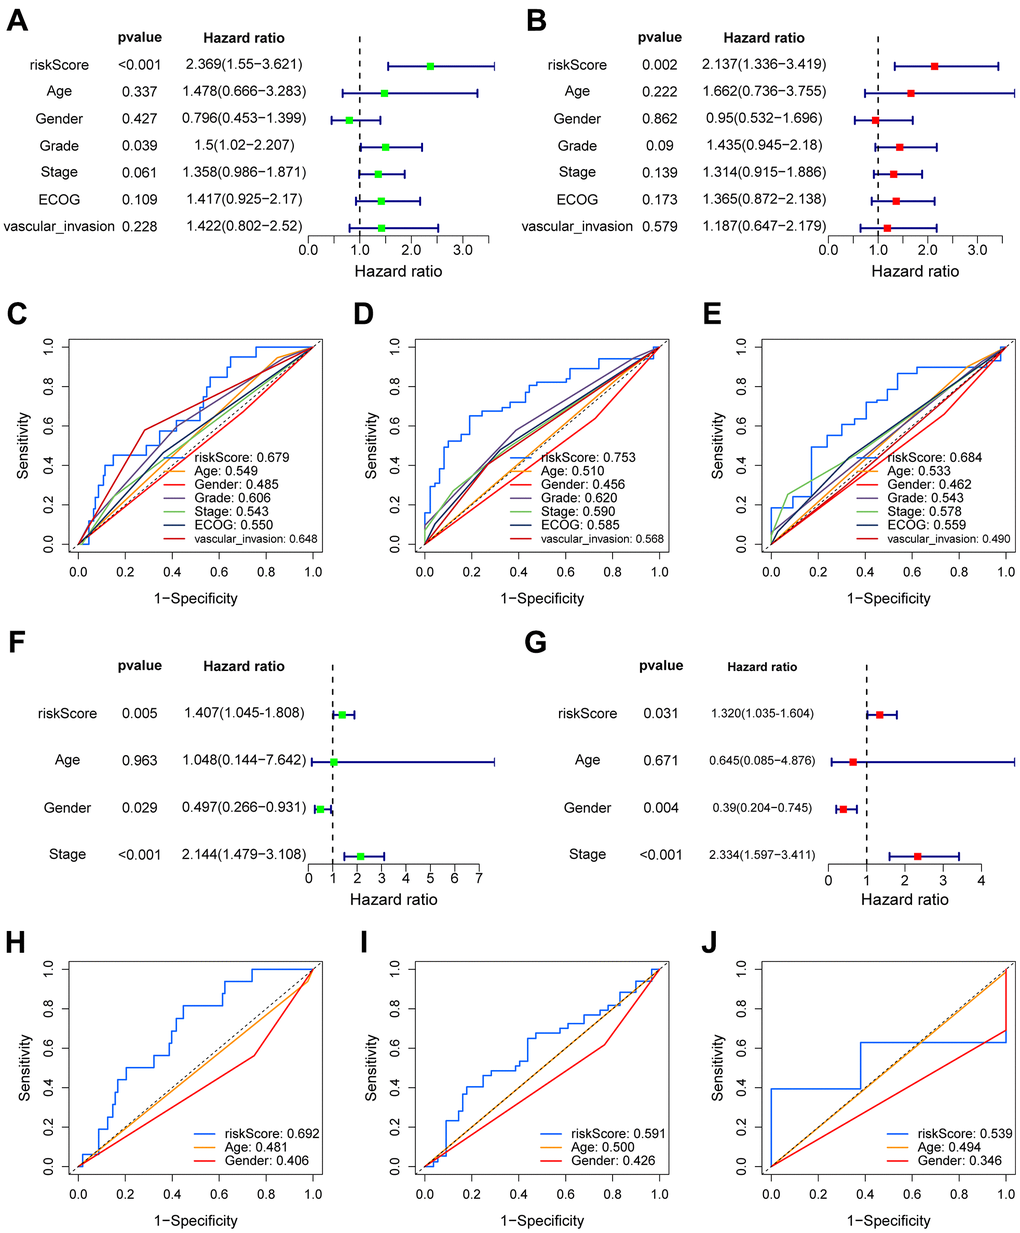
Figure 3. The prognostic value of VPRS. In the training set, forest plot on the left for the univariate Cox test (A) evaluating the correlation of the risk score and clinical factors with OS of patients, and forest plot on the right for the multivariate Cox analysis (B) identifying independent risk factors for the OS of patients. The ROC curve of risk score and clinical factors to predict 1- (C), 3- (D), and 5-year (E) OS. In the validation set, univariate (F) and multivariate (G) COX analysis of risk score and clinical factors. ROC curve of risk score compared with other clinical factors to predict 1- (H), 3- (I), and 5-year (J) OS.
Relationship between vascular endothelial growth factor production-related risk signature and the features of clinicopathology
During the training phase, we identified a total of 310 cases that included clinical data such as age, gender, T classification, N classification, M classification, ECOG, vascular invasion, tumor grade, and stage (Figure 4A). In the ICGC sets, we narrowed down the cases to 231 by considering only those with clinical features of age, gender, and tumor stage (Figure 4B). To compare the distribution of clinical characteristics among different risk groups, we utilized the “chisq.test” function in R to conduct Chi-square tests. The results of these tests for both the TCGA and ICGC cohorts can be found in Table 1. Based on VPRS, the risk scores substantially correlated with age, tumor grade, and T classification in TCGA cohorts (Figure 4C–4F). Furthermore, we noted a major correlation between the risk scores and tumor stage in ICGC groups (Figure 4G). HCC samples with higher age, T classification, tumor grade, and stage specifically exhibited markedly higher risk scores than those with lower values, with risk score and vascular invasion also showing a significant correlation. Thus, the risk score values were significantly correlated with age, T classification, vascular invasion, tumor grade, and stage of HCC.
Table 1. Correlation between clinicopathological factors of hepatocellular carcinoma patients and 4-VPRS genes risk scores in the two cohorts.
| Features | Training set TCGA RNA-seq cohort (n = 310) | Validation set ICGC RNA-seq cohort (n = 231) | ||||
| Low-risk score (n = 155) | High-risk score (n = 155) | P-value | Low-risk score (n = 124) | High-risk score (n = 107) | P-value | |
| Age | 0.025 | 0.778 | ||||
| ≤ 45 | 14 | 24 | 3 | 3 | ||
| > 45 | 141 | 131 | 121 | 104 | ||
| Gender | 0.963 | 0.375 | ||||
| Female | 51 | 48 | 35 | 26 | ||
| Male | 104 | 107 | 89 | 81 | ||
| Grade | <0.001 | - | ||||
| G1 | 30 | 16 | - | - | ||
| G2 | 82 | 64 | - | - | ||
| G3 | 32 | 69 | - | - | ||
| G4 | 7 | 5 | - | - | ||
| unknow | 4 | 1 | - | - | ||
| Stage | 0.06 | <0.001 | ||||
| Stage I | 87 | 75 | 19 | 17 | ||
| Stage II | 34 | 37 | 70 | 36 | ||
| Stage III | 21 | 29 | 26 | 44 | ||
| Stage IV | 1 | 2 | 9 | 10 | ||
| unknow | 12 | 12 | 0 | 0 | ||
| T | 0.034 | - | ||||
| T1 | 92 | 79 | - | - | ||
| T2 | 34 | 41 | - | - | ||
| T3 | 22 | 30 | - | - | ||
| T4 | 4 | 5 | - | - | ||
| unknow | 3 | 0 | - | - | ||
| N | 0.109 | - | ||||
| N0 | 97 | 109 | - | - | ||
| N1 | 0 | 3 | - | - | ||
| unknow | 58 | 43 | - | - | ||
| M | 0.918 | - | ||||
| M0 | 99 | 114 | - | - | ||
| M1 | 1 | 2 | - | - | ||
| unknow | 55 | 39 | - | - | ||
| ECOG | 0.623 | - | ||||
| 0 | 77 | 82 | - | - | ||
| 1 | 42 | 40 | - | - | ||
| 2 | 8 | 6 | - | - | ||
| unknow | 28 | 27 | - | - | ||
| vascular invasion | 0.016 | - | ||||
| Yes | 39 | 50 | - | - | ||
| No | 97 | 95 | - | - | ||
| unknow | 19 | 10 | - | - | ||
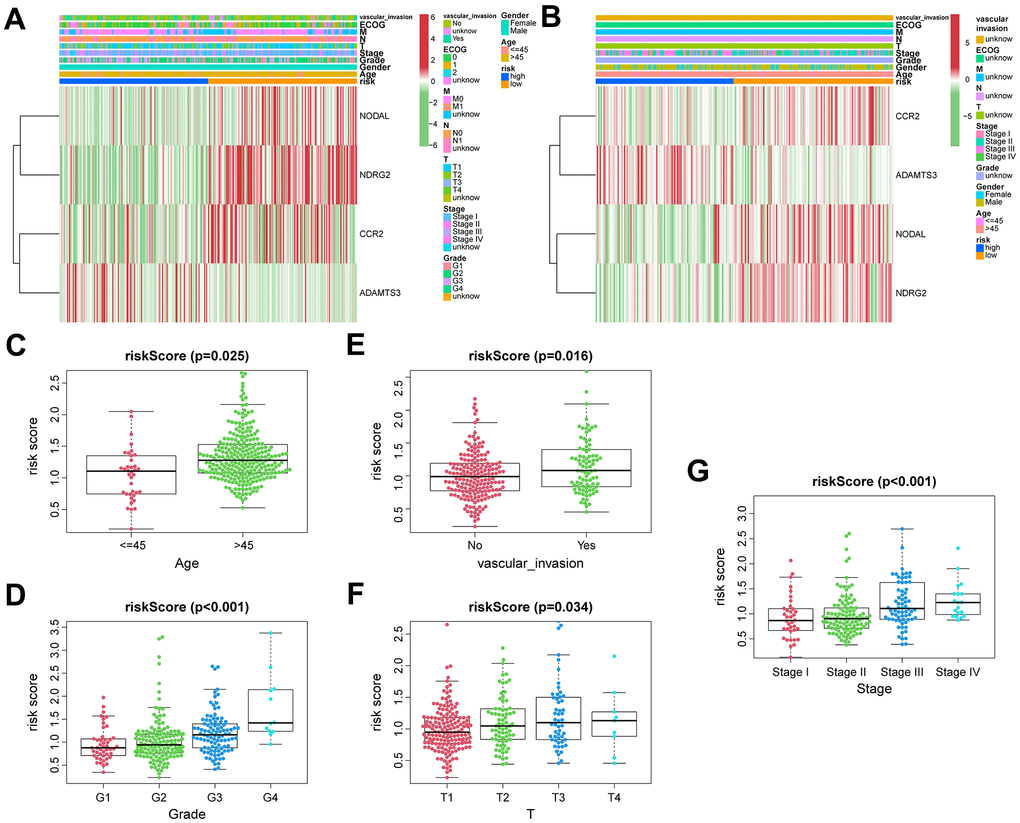
Figure 4. The correlation between clinicopathological factors and risk score. Heatmap of the correlations between clinicopathological characteristics of HCC and risk score in the TCGA (A) and ICGC (B) cohorts. Distribution of vascular endothelial growth factor production-related risk signature within HCC patients stratified by age, tumor grade, T classification, and vascular invasion in TCGA (C–F) and tumor stage in ICGC (G) cohorts.
Tumor-infiltrating immune cells profiles
TIICs are essential components of the TME. This study examined the relative fraction of 22 immune cell types before computing using the “CIBERSORT” algorithm. The boxplots display the differences in fractions among low and high-risk sets (Figure 5A, 5D). Notably, the high-risk group had substantially higher proportions of M2, M1, and M0 macrophages, and regulatory T cells (Tregs) than the low-risk group. Additionally, M1 macrophages and risk scores had a significant negative correlation (Figure 5B, 5E), whereas M2 macrophages positively correlated to risk scores (Figure 5C, 5F) in TCGA and ICGC cohorts, respectively. Consequently, it is suggested that the risk scores associated with the decreased M1 macrophage and increased M2 macrophages may alter the prognosis of HCC patients. The ssGSEA scores were used to quantify the abundances and activities of various pathways, immunocytes, or functions. Higher ssGSEA scores revealed significant infiltration of immune cells and more active immune-related pathways. The heatmaps (Figure 6A, 6C) and boxplots (Figure 6B, 6D) revealed that the high-risk group had higher ssGSEA scores for various immune cell types, such as checkpoint, macrophages, and Tregs. Furthermore, we evaluated the stromal and immunological scores, which represent the presence of stromal cells and infiltration of immune cells in the tumor microenvironment, respectively. The analysis revealed that samples in the high-risk group exhibited significantly higher immune and stromal scores unlike those in the low-risk set (Figure 6B, 6D). The HCC samples with elevated risk scores exhibited higher levels of infiltrating stromal and immune cells. The TIICs and immune-related pathways were not substantially distinct among high and low-risk groups. In the high-risk group, the levels of immunosuppressive TIICs like M2 and Tregs were substantially higher than the baseline.
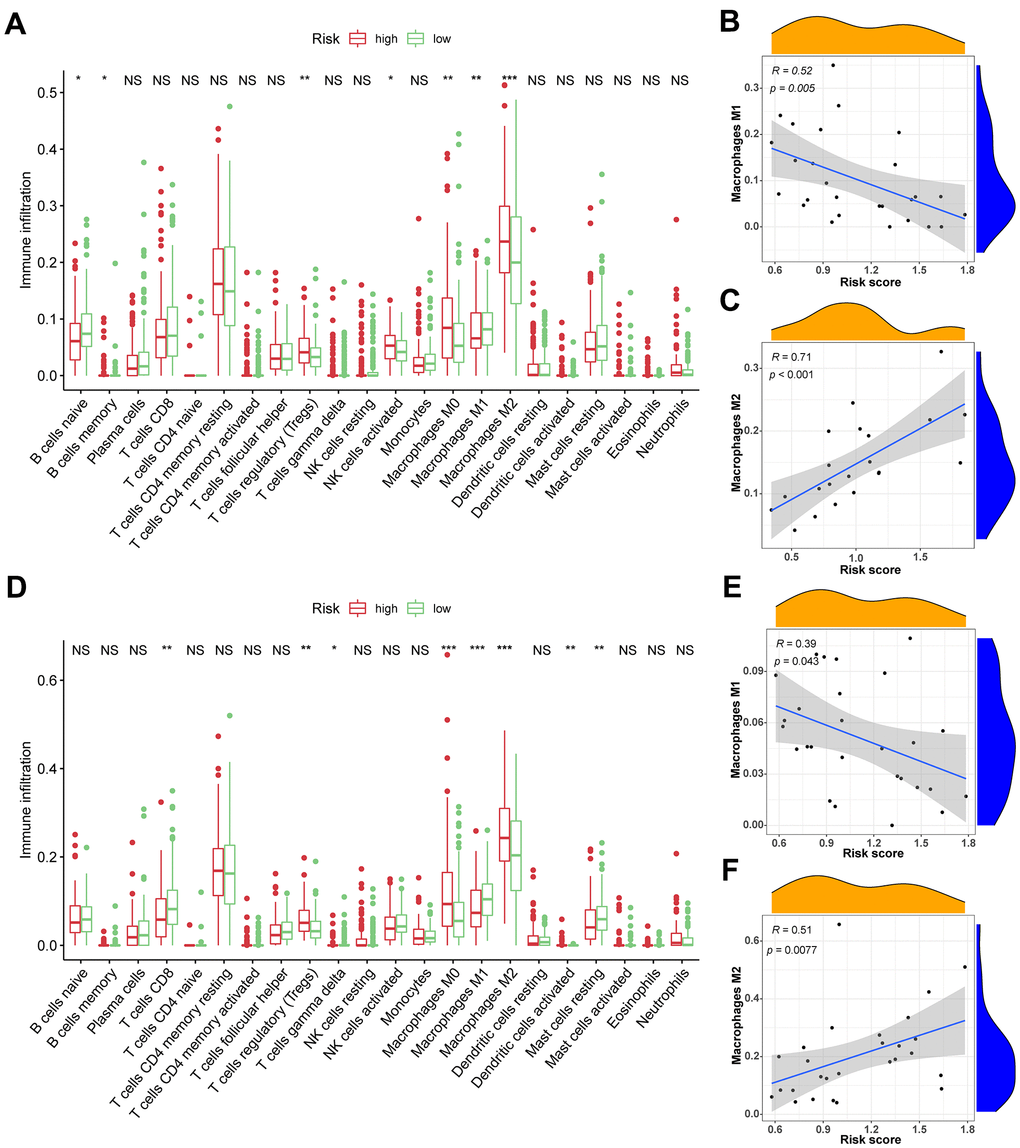
Figure 5. The association between TIICs and VPRS. (A) Differential analysis of 22 kinds of TIICs in the low and high-risk groups in training sets. (B, C) Spearman’s correlation analysis for risk score and M1 and M2 macrophages in TCGA cohorts, each dot plot represents a subject, and the correlation is fitted into a straight blue line. (D) Differential analysis of 22 kinds of TIICs in the low and high-risk groups invalidation sets. (E, F) Spearman’s correlation analysis for risk score and M1 and M2 macrophages in ICGC cohorts, each dot plot represents a subject, and the correlation is fitted into a straight blue line. R, rho; ***p < 0.001, **p < 0.001, *p < 0.05.
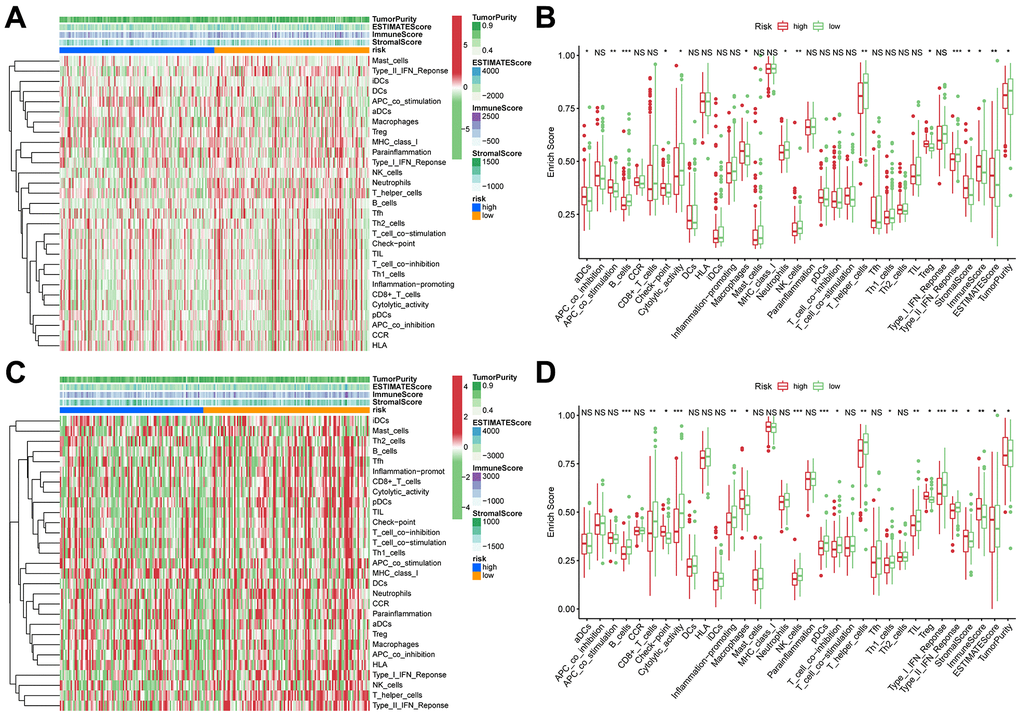
Figure 6. ssGSEA of immune hallmarks. (A) Heatmap of ssGSEA scores among high- and low-risk groups in training sets (green = negative, red = positive). (B) Boxplot of ssGSEA scores, immune score, stromal score, ESTIMATE score, and tumor purity among high- and low-risk groups in TCGA cohorts. (C) Heatmap of ssGSEA scores among high- and low-risk groups in validation sets (green = negative, red = positive). (D) Boxplot of ssGSEA scores, immune score, stromal score, ESTIMATE score, and tumor purity among high- and low-risk groups in ICGC cohorts. ***p < 0.001, **p < 0.001, *p < 0.05.
Correlation between immune modulators and risk score
The levels of genes related to ICD and ICPs were analyzed to explore the potential impact of these modulators on anticancer immunity. All 20 genes, related with ICPs, showed differential expression among the different risk groups in the TCGA and ICGC cohort (Figure 7A, 7C). The expressions of key ICPs including CTLA4, CD274 (PD-L1), and PDCD1 (PD-1) were significantly elevated in the high-risk group. Moreover, both in TCGA and ICGC cohorts, all 12 ICD genes had differential expression among the low and high-risk groups (Figure 7B, 7D). These findings imply that the risk score value, which reflects the expression levels of ICD and ICPs modulators, could be a promising immune treatment biomarker.
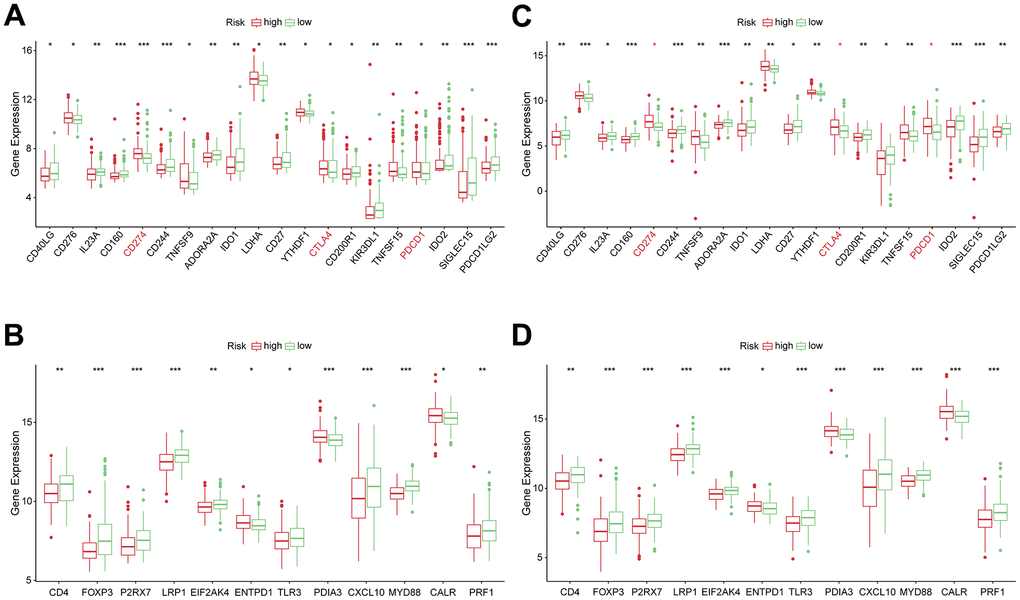
Figure 7. Correlation between risk subtypes and ICPs and ICD modulators. (A) Differential expression of ICP genes among the risk subtypes in TCGA cohorts. (B) Differential expression of ICD modulator genes among the risk subtypes in TCGA cohorts. (C) Differential expression of ICP genes among the risk subtypes in ICGC cohorts. (D) Differential expression of ICD modulator genes among the risk subtypes in ICGC cohorts.
The correlation of risk score with somatic mutation rates and gene set variation analysis
The mutation landscape of both groups was analyzed. Results showed that the top 20 frequently mutated genes in each subtype included PCLO, ALB, MUC16, TTN, TP53, and CTNNB1 (Figure 8A, 8B). These suggests that the VPRS-based risk score in HCC patients can predict the somatic mutation rate. Moreover, patients with higher risk scores showed good response to anticancer immunity. Using the GSVA, the pathway activities were compared between the low and high-risk groups. Signaling pathways associated with cell cycle, tumor proliferation, tumor invasion, angiogenesis, and tumorigenesis were significantly enriched in the high-risk groups (Figure 8C). The pathways included MYC target v1 and v2, E2F target, G2M checkpoint, MTORC1 signaling, epithelial-mesenchymal transition, and others. Collectively, these findings showed that the VPRS-based risk score can be used as a novel biomarker of HCC, associated with the signaling pathways involved in angiogenesis and tumor invasion.
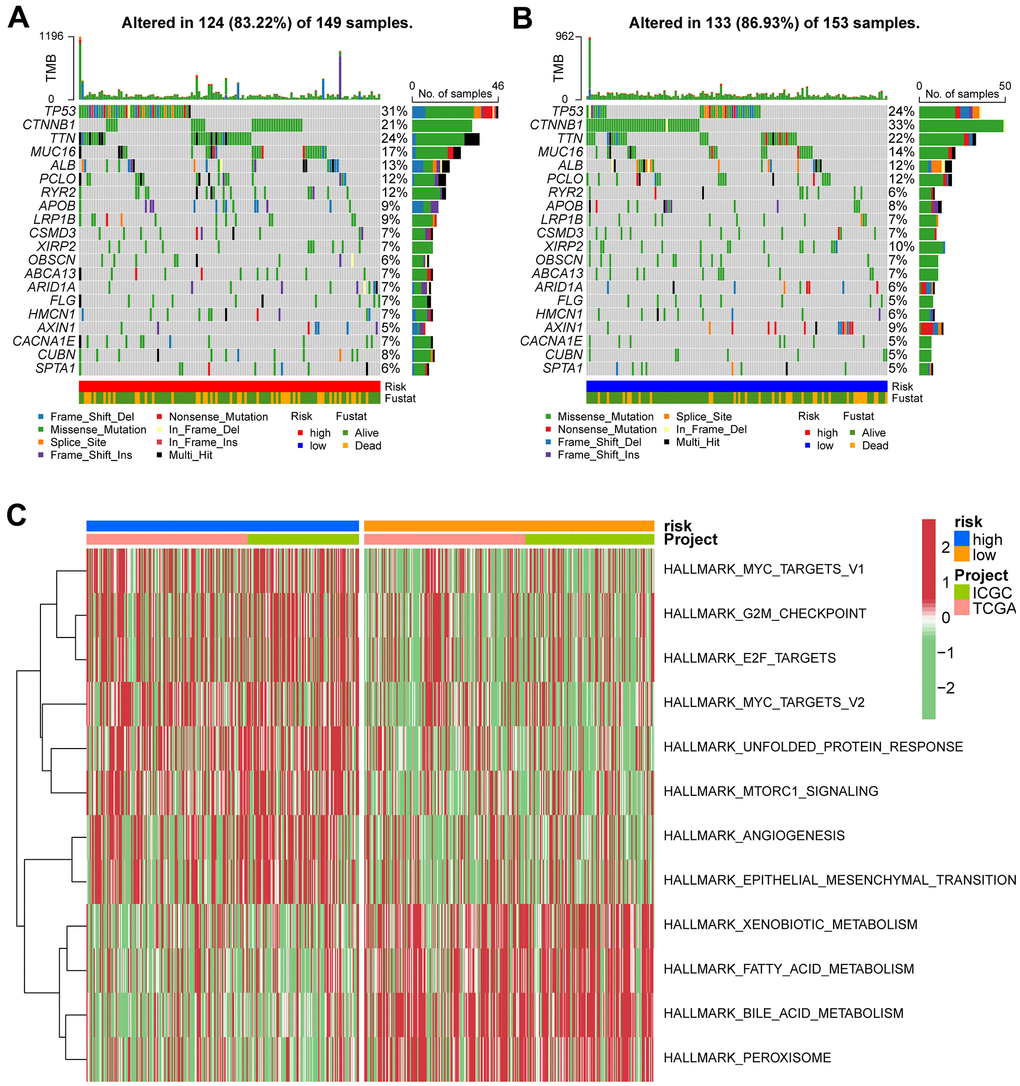
Figure 8. Gene set variation analysis and correlation between mutation and risk subtype. (A) Top 20 highly mutated genes in HCC high-risk group. (B) Top 20 highly mutated genes in HCC low-risk group. (C) Heatmap for the contribution of GSVA scores of hallmarks in high- and low-risk groups. The red color represents up-regulated terms in the high-risk group, green color shows the down-regulated terms in the low-risk group.
Identification of hub genes of vascular endothelial growth factor production-related risk signature
The prognostic value of the 4-gene VPRS was evaluated in the training and validation groups (Figure 9A–9H). Analysis of the effect of the 4 genes on the survival outcomes (Table 2) revealed that CCR2, NDRG2, and NODAL levels were positively correlated to the OS of HCC patients. On the other hand, those with higher ADAMTS3 levels predicted poor OS. Given the significant correlation between these four genes and the prognosis of HCC patients, ADAMTS3, CCR2, NDRG2 and NODAL were considered as hub genes. Next, we explored the protein expression of related hub genes utilizing the HPA database. Consequently, the expression of ADAMTS3 (liver#img/ENSG00000156140-ADAMTS3/HPA021369 available from v22.0.proteinatlas.org; liver+cancer#img/ENSG00000156140-ADAMTS3/HPA021369 available from v22.0.proteinatlas.org) and NODAL (liver#img/ENSG00000156574-NODAL/HPA045201 available from v22.0.proteinatlas.org; liver+cancer#img/ENSG00000156574-NODAL/HPA045201 available from v22.0.proteinatlas.org) were significantly higher in HCC tissues compared with the normal liver tissues, whereas NDRG2 (liver#img/ENSG00000165795-NDRG2/HPA002896 available from v22.0.proteinatlas.org; liver+cancer#img/ENSG00000165795-NDRG2/HPA002896 available from v22.0.proteinatlas.org) expression was lower in HCC tissues. The CCR2 protein (liver#img/ENSG00000121807-CCR2/CAB003793 available from v22.0.proteinatlas.org; liver+cancer#img/ENSG00000121807-CCR2/CAB003793 available from v22.0.proteinatlas.org) expression was not detected neither in HCC nor normal tissue (Figure 9I–9L). Furthermore, the expression levels of the four hub genes in our hospital samples were measured using the real-time PCR technique (Figure 9M). Supplementary Table 3 shows the primer sequences of 4 hub genes. The mRNA expression of ADAMTS3, CCR2, NDRG2, and NODAL was significantly higher in HCC than in normal liver tissues, similar to the documented results in the public database.
Table 2. 4 VPRS genes related K–M survival analysis in ICGC and TCGA.
| Gene | TCGA | ICGC | ||
| HR(high) | Log-rank P | HR(high) | Log-rank P | |
| ADAMTS3 | 1.438 | p<0.05 | 1.069 | p<0.05 |
| CCR2 | 0.858 | p<0.05 | 0.868 | p<0.05 |
| NDRG2 | 0.784 | p<0.05 | 0.864 | p<0.05 |
| NODAL | 0.752 | p<0.05 | 0.82 | p<0.05 |
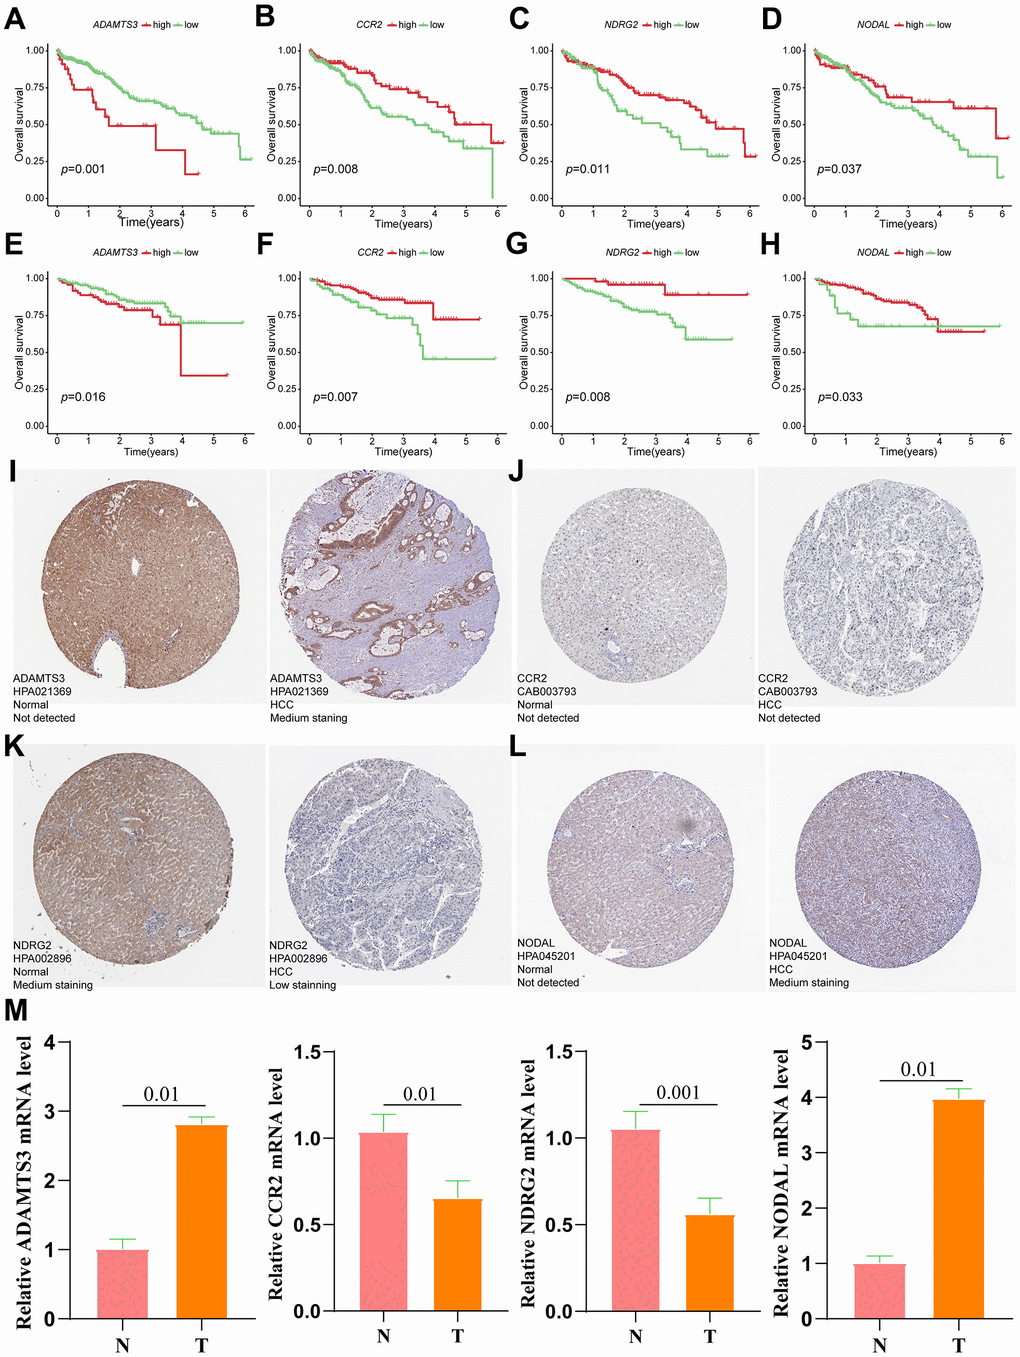
Figure 9. Verification of the prognostic value and expression of hub genes of VPRS. Survival analysis of ADAMTS3, CCR2, NDRG2, and NODAL for patients in TCGA (A–D) and ICGC (E–H) cohorts. The protein expression level of ADAMTS3 (I), CCR2 (J), NDRG2 (K), and NODAL (L) in normal and HCC tissues based on the HPA database. (M) The relative mRNA expression levels of ADAMTS3, CCR2, NDRG2, and NODAL are compared between HCC and non-tumor tissues with real-time PCR results. ***p < 0.001, **p < 0.001, *p < 0.05.
Establishing a prognostic nomogram
A new prognosis nomogram was developed by combining risk score and tumor stage to predict the survival of HCC patients (Figure 10A). The nomogram predicted the OS of patients at 1, 3, and 5 years, with higher scores indicating lower survival probability. The results were comparable with the tumor stage, as higher stage status corresponded to a worse prognosis. To assess the effectiveness of the nomogram in predicting patient survival rates, we performed ROC curve analyses for 1-, 3-, and 5-year survival predictions in both training and validation sets. In the training set, the AUC values indicating the model’s discriminatory power was 0.619, 0.693, and 0.698 for 1-, 3-, and 5-year survival outcomes, respectively (Figure 10B). In the validation set, AUC values were 0.844, 0.638, and 0.634 for the same prediction periods (Figure 10C).
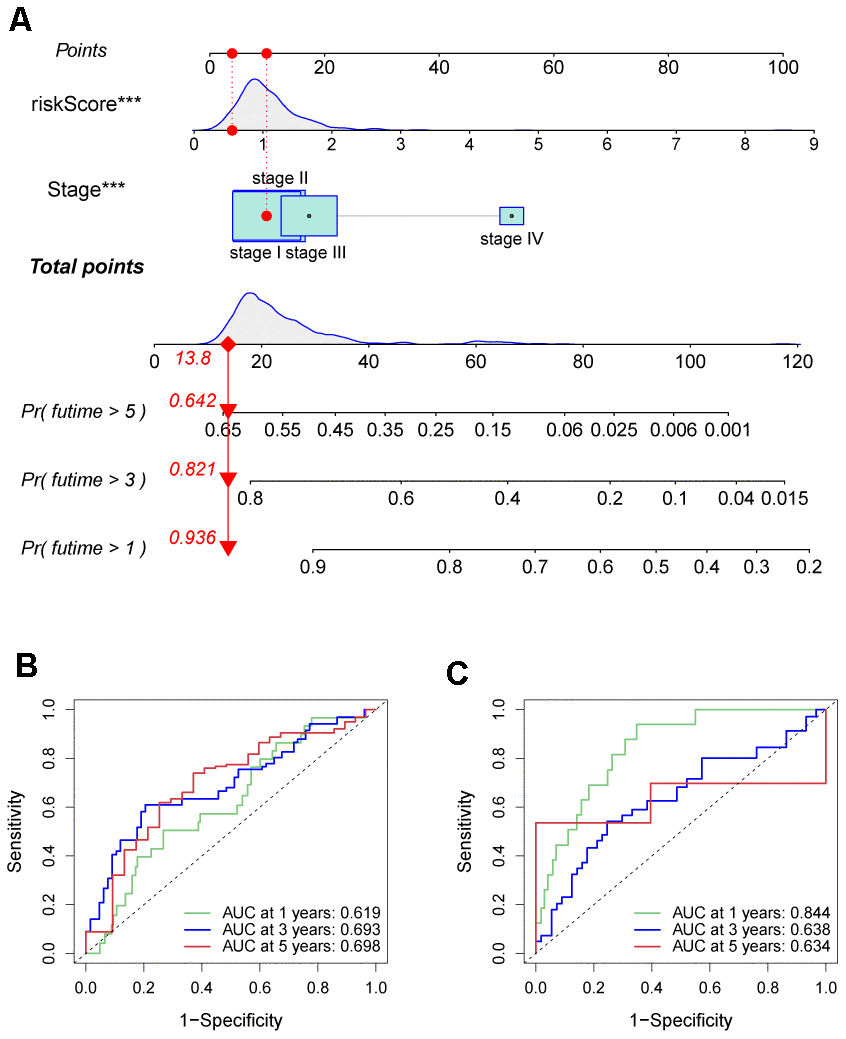
Figure 10. Prognostic nomogram was established by combining risk score and tumor stage characters. (A) Nomogram for assessing the 1-, 3-, and 5-year OS for HCC patients in the TCGA dataset. ROC curves of 1-, 3-, and 5-year in the TCGA (B) and ICGC (C) datasets.
Discussion
HCC is characterized by high vascularity and degree of malignancy due to impaired angiogenesis [38, 39]. This is because the tumor vascular network determines the supply of oxygen and nutrients to the growing tumor cells [40, 41]. Existing blood vessels are transformed into new ones through a process referred to as angiogenesis [42]. The process of angiogenesis has been shown to modulate cancer progression [43]. Anti-angiogenic therapy is now recognized as an effective strategy for treating cancers. Numerous retrospective studies have shown that microangiogenesis can contribute to the early recurrence and prognosis of HCC [44, 45]. Microangiogenesis levels are often linked to a higher probability of recurrence even poorer survival outcomes [46]. Given the negative prognostic implications of microangiogenesis in recurrent HCC, clinicians should consider whether more aggressive treatment options are necessary for such patients, particularly those experiencing recurrence within two years of their initial curative hepatectomy. This is because HCCs that recur within this time frame are assumed to arise from residual microscopic lesions. However, this issue has not been investigated. Limited research has explored this topic [45]. VEGF functions as an irreplaceable role in the angiogenesis of HCC tissues which is bound up with its tumorigenesis. Although some studies have constructed predictive models of angiogenesis in HCC, none of them has involved VEGF as an important factor in promoting angiogenesis in HCC.
For our study, we first obtained the VPRGs from the Molecular Signatures Database, and found the expression levels of most VPRGs substantially fluctuated among HCC and normal tissues. In addition, these genes had lower CNV and SNP in HCC tissues, implying that these genes are associated with HCC progression. Similarly, it suggested that they had high genetic stability and could inhibit the gene mutations. Through single-factor analysis, we identified prognostic genes in HCC. Using Lasso regression, we built a risk model based on four vascular pattern regulatory genes (VPRGs): ADAMTS3, CCR2, NDRG2, and NODAL. This model outperformed other clinical factors in predicting patient prognosis significantly. Furthermore, this signature showed better predictive performance for HCC prognosis compared to other clinical factors. A positive correlation was observed between the constructed risk score and the grade, stage, and T stage of the tumor, demonstrating a substantial positive correlation between the risk model we constructed and the HCC progression. Moreover, there was a significant association of our risk score with the clinical characteristic of vascular invasion. Specifically, the risk of significant vascular invasion increases with score, confirming the correlation between our constructed risk model and angiogenesis. We further investigated the validity of our risk model by examining its correlations with clinical features of HCC patients. Through GSVA analysis, the potential mechanisms driving the model’s predictive power were also explored. Furthermore, experiments were conducted to validate the aberrant expression of four key model-related genes identified as VPRGs in HCC tissues. The results showed significant upregulation of ADAMTS3 and NODAL, while CCR2 and NDRG2 were downregulated. A Disintegrin and Metalloproteinase with Thrombospondin Motifs 3 (ADAMTS3) is a metalloproteinase, belonging to the ADAMTS family, which is capable of degrading components of the extracellular matrix, like the elastic fibers, collagen and proteoglycans [47]. ADAMTS3 participates in normal physiological processes, like the embryonic development, tissue remodeling and wound healing [48]. A study by Kim et al. reported that ADAMTS3 was highly expressed in glioma stem cells and significantly correlated with its tumorigenic and proliferative activities [49]. However, at present, no study has reported the correlation between ADAMTS3 and HCC. We found, for the first time, that ADAMTS3 was highly expressed in HCC samples in our study. Based on these findings, future mechanistic studies should investigate the role of ADAMTS3 in hepatocarcinogenesis. C-C motif chemokine receptor 2 (CCR2), a C-C chemokine receptor, is mainly expressed on immune cells, like the monocytes, macrophages, and T-cells, and can recognize and bind to chemokines, such as CCL2, as well as modulate the migration of immune cells to inflammatory and tumor sites [50]. In the advanced stage of HCC, CCR2 inhibits anti-tumor immune responses by recruiting and activating immunosuppressive cells, such as the macrophages, myeloid-derived suppressor cells, and regulatory T cells, thereby promoting immune escape of HCC cells [51]. In addition, CCR2 promotes HCC development by modulating fibrosis and inflammatory responses in the liver [52]. In contrast, in the early stages of HCC, immune cells such as macrophages recruited by CCR2 can prevent early tumor formation by eliminating senescent hepatocytes [53]. This intricate observation suggests that CCR2 plays a multifaceted role in HCC progression. It can promote and suppress cancer, which need to be further investigated to clarify the mechanisms governing its divergent effects [54, 55]. NDRG2, a tumor suppressor gene, has been shown to inhibit the growth and metastasis of many malignant tumors, including HCC, and its expression level is positively associated with the prognosis and survival outcomes of cancer patients [56–58]. In HCC, the expression of NDRG2 is downregulated, which is consistent with our findings, and down-regulation of NDRG2 expression can significantly increase tumor angiogenesis via the VEGFA pathway [59]. Nodal Growth Differentiation Factor (NODAL) is a secreted protein belonging to the transforming growth factor β (TGF-β) superfamily. It plays a role in physiological processes such as embryonic development, tissue remodeling and stem cell maintenance [60]. However, NODAL are highly expressed in several malignant tumors, such as melanoma, breast cancer, gastric cancer, HCC, etc., and negatively correlates with the degree of differentiation, clinical stage, metastasis, and prognosis of the tumors [61–63]. NODAL is an important component of the TGF-β signaling pathway which enhances the proliferation, migration, and invasion of HCC cells by promoting the phosphorylation of Smad3 and the expression of Snail, drug resistance, and epithelial-mesenchymal transition (EMT) [64]. In addition, NODAL has been shown to modulate tumor cell plasticity by promoting the formation of angiogenic mimetic structures [7]. These results suggest that these signature-associated VPRGs contribute to HCC development and progression, and further studies are advocated to explore their mechanisms and identify potential therapeutic targets.
Immune cells determine response to immunotherapy and tumor survival as the primary component of TIME. For example, clinical research confirms that the immune cell composition of tumors in HCC is strongly associated with patient prognosis and affects therapeutic response [65–67]. Individuals in the low-risk group experienced intense immune cell infiltration compared to their counterparts in the high-risk group. High-density Tumor-Associated Macrophages (TAM) infiltration in HCC is a poor prognosis marker, and TAM is primarily M2 macrophages [68, 69]. M2 macrophages can up-regulate the PDL1 expression in HCC, limiting the activity of CD8+ T cells [70]. In our study, high-risk patients exhibited higher levels of M2 macrophage and Treg cell infiltration, but M1 macrophage infiltration was minimal. Our results strongly demonstrated that the risk scores were negatively correlated with the degree of M1 macrophage infiltration and positively associated with the degree of M2 macrophage infiltration. In our analysis, the high-risk group exhibited higher immune and interstitial scores unlike the low-risk group, although the tumor purity was lower, suggesting better response to immunotherapy. Therefore, boosting anti-tumor immune responses is critical for effective clinical treatment.
Cancer immunotherapy is a new treatment approach for tumors which aims to restart the tumor immune cycle and reestablish the normal anti-tumor immune response [71, 72]. Several studies have investigated the effect of tumor immunotherapy on the TIME [73, 74]. The ICP is an effective approach for stimulating the anti-tumor immune response. The PD-1-and CTLA-4-activated immune T cells are the reliable point for the treatment. Substances that suppress PD-1 and CTLA-4 could significantly enhance the treatment for advanced cancers [75]. Chemokines can also influence cancer migration and progression [76, 77]. Specifically, several key immune checkpoints (e.g., PD-1, CTLA-4) and genes involved in immunogenic cell death pathways (e.g., ERp5, CRTL) were upregulated in the high-risk group. Therefore, higher gene expression levels are more sensitive to ICIs and immunotherapy. Thus, our risk-scoring model is expected to improve individualized treatment of HCC patients.
The intricacy of HCC pathogenesis pathways leads to variation across diverse populations in various countries and regions, posing a significant challenge to customized therapy [78, 79]. Therefore, the use of a single DEG as a biomarker for customized HCC patients is not reliable. Moreover, it is difficult to identify and characterize the immune properties of HCC. In our study, we developed a new prognostic biomarker of HCC that can differentiate the immune status and the malignancy of HCC as well as predict the efficacy of immune checkpoint blockade (ICB) treatment in HCC patients. In addition, a microangiogenesis prediction model for HCC prognosis was developed and validated. Nevertheless, we acknowledge that our study has certain limitations. Firstly, the retrospective nature of our study, although validated with diverse datasets to assess performance, limits the application of our model. Secondly, the TIME exhibited significant heterogeneity, making it difficult to perform precise evaluation. Despite efforts to minimize biases by leveraging the relative order of immune cell infiltration, residual biases may persist. Future biological analyses are advocated to expand our understanding of survival outcomes.
Conflicts of Interest
The authors declare that they have no conflicts of interest.
Ethical Statement and Consent
The Institutional Ethics Committee of The Faculty of Medicine at Wuhan Third Hospital approved our study design (KY2019-021). The tissues were obtained with informed consent from all participating patients.
Funding
The seventh batch of the academic experience inheritance guidance project of the old Chinese medicine experts (Letter of the Department of Personnel and Education of the National Administration of Traditional Chinese Medicine; No. [2022]76); 2017 Wuhan Health and Family Planning Research Fund Project (WZ17B04); 2018 Wuhan Young and middle-aged medical talents Training Project (No. 116[2018]).
References
- 1. Wang Y, Song F, Zhang X, Yang C. Mitochondrial-Related Transcriptome Feature Correlates with Prognosis, Vascular Invasion, Tumor Microenvironment, and Treatment Response in Hepatocellular Carcinoma. Oxid Med Cell Longev. 2022; 2022:1592905. https://doi.org/10.1155/2022/1592905 [PubMed]
- 2. Akinyemiju T, Abera S, Ahmed M, Alam N, Alemayohu MA, Allen C, Al-Raddadi R, Alvis-Guzman N, Amoako Y, Artaman A, Ayele TA, Barac A, Bensenor I, et al, and Global Burden of Disease Liver Cancer Collaboration. The Burden of Primary Liver Cancer and Underlying Etiologies From 1990 to 2015 at the Global, Regional, and National Level: Results From the Global Burden of Disease Study 2015. JAMA Oncol. 2017; 3:1683–91. https://doi.org/10.1001/jamaoncol.2017.3055 [PubMed]
- 3. Morse MA, Sun W, Kim R, He AR, Abada PB, Mynderse M, Finn RS. The Role of Angiogenesis in Hepatocellular Carcinoma. Clin Cancer Res. 2019; 25:912–20. https://doi.org/10.1158/1078-0432.CCR-18-1254 [PubMed]
- 4. Felmeden DC, Blann AD, Lip GY. Angiogenesis: basic pathophysiology and implications for disease. Eur Heart J. 2003; 24:586–603. https://doi.org/10.1016/s0195-668x(02)00635-8 [PubMed]
- 5. Karamysheva AF. Mechanisms of angiogenesis. Biochemistry (Mosc). 2008; 73:751–62. https://doi.org/10.1134/s0006297908070031 [PubMed]
- 6. Jiang X, Wang J, Deng X, Xiong F, Zhang S, Gong Z, Li X, Cao K, Deng H, He Y, Liao Q, Xiang B, Zhou M, et al. The role of microenvironment in tumor angiogenesis. J Exp Clin Cancer Res. 2020; 39:204. https://doi.org/10.1186/s13046-020-01709-5 [PubMed]
- 7. Lugano R, Ramachandran M, Dimberg A. Tumor angiogenesis: causes, consequences, challenges and opportunities. Cell Mol Life Sci. 2020; 77:1745–70. https://doi.org/10.1007/s00018-019-03351-7 [PubMed]
- 8. Pinto E, Pelizzaro F, Farinati F, Russo FP. Angiogenesis and Hepatocellular Carcinoma: From Molecular Mechanisms to Systemic Therapies. Medicina (Kaunas). 2023; 59:1115. https://doi.org/10.3390/medicina59061115 [PubMed]
- 9. Hoang MV, Nagy JA, Fox JE, Senger DR. Moderation of calpain activity promotes neovascular integration and lumen formation during VEGF-induced pathological angiogenesis. PLoS One. 2010; 5:e13612. https://doi.org/10.1371/journal.pone.0013612 [PubMed]
- 10. Bates DO. Vascular endothelial growth factors and vascular permeability. Cardiovasc Res. 2010; 87:262–71. https://doi.org/10.1093/cvr/cvq105 [PubMed]
- 11. Chen L, Lin G, Chen K, Liang R, Wan F, Zhang C, Tian G, Zhu X. VEGF promotes migration and invasion by regulating EMT and MMPs in nasopharyngeal carcinoma. J Cancer. 2020; 11:7291–301. https://doi.org/10.7150/jca.46429 [PubMed]
- 12. Florentin J, O’Neil SP, Ohayon LL, Uddin A, Vasamsetti SB, Arunkumar A, Ghosh S, Boatz JC, Sui J, Kliment CR, Chan SY, Dutta P. VEGF Receptor 1 Promotes Hypoxia-Induced Hematopoietic Progenitor Proliferation and Differentiation. Front Immunol. 2022; 13:882484. https://doi.org/10.3389/fimmu.2022.882484 [PubMed]
- 13. Farzaneh Z, Vosough M, Agarwal T, Farzaneh M. Critical signaling pathways governing hepatocellular carcinoma behavior; small molecule-based approaches. Cancer Cell Int. 2021; 21:208. https://doi.org/10.1186/s12935-021-01924-w [PubMed]
- 14. Zhao P, Malik S, Xing S. Epigenetic Mechanisms Involved in HCV-Induced Hepatocellular Carcinoma (HCC). Front Oncol. 2021; 11:677926. https://doi.org/10.3389/fonc.2021.677926 [PubMed]
- 15. Xu C, Xu Z, Zhang Y, Evert M, Calvisi DF, Chen X. β-Catenin signaling in hepatocellular carcinoma. J Clin Invest. 2022; 132:e154515. https://doi.org/10.1172/JCI154515 [PubMed]
- 16. Haibe Y, Kreidieh M, El Hajj H, Khalifeh I, Mukherji D, Temraz S, Shamseddine A. Resistance Mechanisms to Anti-angiogenic Therapies in Cancer. Front Oncol. 2020; 10:221. https://doi.org/10.3389/fonc.2020.00221 [PubMed]
- 17. Cai C, Wang X, Fu Q, Chen A. The VEGF expression associated with prognosis in patients with intrahepatic cholangiocarcinoma: a systematic review and meta-analysis. World J Surg Oncol. 2022; 20:40. https://doi.org/10.1186/s12957-022-02511-7 [PubMed]
- 18. Khodabakhsh F, Merikhian P, Eisavand MR, Farahmand L. Crosstalk between MUC1 and VEGF in angiogenesis and metastasis: a review highlighting roles of the MUC1 with an emphasis on metastatic and angiogenic signaling. Cancer Cell Int. 2021; 21:200. https://doi.org/10.1186/s12935-021-01899-8 [PubMed]
- 19. Arciero CA, Sigurdson ER. Liver-directed therapies for hepatocellular carcinoma. J Natl Compr Canc Netw. 2006; 4:768–74. https://doi.org/10.6004/jnccn.2006.0067 [PubMed]
- 20. Jácome AA, Castro AC, Vasconcelos JP, Silva MH, Lessa MA, Moraes ED, Andrade AC, Lima FM, Farias JP, Gil RA, Prolla G, Garicochea B. Efficacy and Safety Associated With Immune Checkpoint Inhibitors in Unresectable Hepatocellular Carcinoma: A Meta-analysis. JAMA Netw Open. 2021; 4:e2136128. https://doi.org/10.1001/jamanetworkopen.2021.36128 [PubMed]
- 21. Syed YY. Ramucirumab: A Review in Hepatocellular Carcinoma. Drugs. 2020; 80:315–22. https://doi.org/10.1007/s40265-020-01263-6 [PubMed]
- 22. Liu Y, Li Y, Wang Y, Lin C, Zhang D, Chen J, Ouyang L, Wu F, Zhang J, Chen L. Recent progress on vascular endothelial growth factor receptor inhibitors with dual targeting capabilities for tumor therapy. J Hematol Oncol. 2022; 15:89. https://doi.org/10.1186/s13045-022-01310-7 [PubMed]
- 23. Nuti M, Zizzari IG, Botticelli A, Rughetti A, Marchetti P. The ambitious role of anti angiogenesis molecules: Turning a cold tumor into a hot one. Cancer Treat Rev. 2018; 70:41–46. https://doi.org/10.1016/j.ctrv.2018.07.016 [PubMed]
- 24. Jiang X, Xu Y, Chen D, Wang M, Qiu M, Xiong L, Zhang L, Yu H, Xiong Z. A Novel Angiogenesis-Related Prognostic Signature Associated with the Hepatocellular Carcinoma Immune Microenvironment and Survival Outcome. Int J Gen Med. 2022; 15:311–23. https://doi.org/10.2147/IJGM.S349210 [PubMed]
- 25. Ci H, Wang X, Shen K, Du W, Zhou J, Fu Y, Dong Q, Jia H. An Angiogenic Gene Signature for Prediction of the Prognosis and Therapeutic Responses of Hepatocellular Carcinoma. Int J Mol Sci. 2023; 24:3324. https://doi.org/10.3390/ijms24043324 [PubMed]
- 26. Yang Y, Wu G, Li Q, Zheng Y, Liu M, Zhou L, Chen Z, Wang Y, Guo Q, Ji R, Zhou Y. Angiogenesis-Related Immune Signatures Correlate With Prognosis, Tumor Microenvironment, and Therapeutic Sensitivity in Hepatocellular Carcinoma. Front Mol Biosci. 2021; 8:690206. https://doi.org/10.3389/fmolb.2021.690206 [PubMed]
- 27. Zhen Z, Shen Z, Hu Y, Sun P. Screening and identification of angiogenesis-related genes as potential novel prognostic biomarkers of hepatocellular carcinoma through bioinformatics analysis. Aging (Albany NY). 2021; 13:17707–33. https://doi.org/10.18632/aging.203260 [PubMed]
- 28. Ansari MJ, Bokov D, Markov A, Jalil AT, Shalaby MN, Suksatan W, Chupradit S, Al-Ghamdi HS, Shomali N, Zamani A, Mohammadi A, Dadashpour M. Cancer combination therapies by angiogenesis inhibitors; a comprehensive review. Cell Commun Signal. 2022; 20:49. https://doi.org/10.1186/s12964-022-00838-y [PubMed]
- 29. Bolstad BM, Irizarry RA, Astrand M, Speed TP. A comparison of normalization methods for high density oligonucleotide array data based on variance and bias. Bioinformatics. 2003; 19:185–93. https://doi.org/10.1093/bioinformatics/19.2.185 [PubMed]
- 30. Ritchie ME, Phipson B, Wu D, Hu Y, Law CW, Shi W, Smyth GK. limma powers differential expression analyses for RNA-sequencing and microarray studies. Nucleic Acids Res. 2015; 43:e47. https://doi.org/10.1093/nar/gkv007 [PubMed]
- 31. Miller RG, Jackson CE, Kasarskis EJ, England JD, Forshew D, Johnston W, Kalra S, Katz JS, Mitsumoto H, Rosenfeld J, Shoesmith C, Strong MJ, Woolley SC, and Quality Standards Subcommittee of the American Academy of Neurology. Practice parameter update: the care of the patient with amyotrophic lateral sclerosis: multidisciplinary care, symptom management, and cognitive/behavioral impairment (an evidence-based review): report of the Quality Standards Subcommittee of the American Academy of Neurology. Neurology. 2009; 73:1227–33. https://doi.org/10.1212/WNL.0b013e3181bc01a4 [PubMed]
- 32. Swets JA. Measuring the accuracy of diagnostic systems. Science. 1988; 240:1285–93. https://doi.org/10.1126/science.3287615 [PubMed]
- 33. Ciardullo C, Aptullahoglu E, Woodhouse L, Lin WY, Wallis JP, Marr H, Marshall S, Bown N, Willmore E, Lunec J. Non-genotoxic MDM2 inhibition selectively induces a pro-apoptotic p53 gene signature in chronic lymphocytic leukemia cells. Haematologica. 2019; 104:2429–42. https://doi.org/10.3324/haematol.2018.206631 [PubMed]
- 34. Bindea G, Mlecnik B, Tosolini M, Kirilovsky A, Waldner M, Obenauf AC, Angell H, Fredriksen T, Lafontaine L, Berger A, Bruneval P, Fridman WH, Becker C, et al. Spatiotemporal dynamics of intratumoral immune cells reveal the immune landscape in human cancer. Immunity. 2013; 39:782–95. https://doi.org/10.1016/j.immuni.2013.10.003 [PubMed]
- 35. Finotello F, Mayer C, Plattner C, Laschober G, Rieder D, Hackl H, Krogsdam A, Loncova Z, Posch W, Wilflingseder D, Sopper S, Ijsselsteijn M, Brouwer TP, et al. Molecular and pharmacological modulators of the tumor immune contexture revealed by deconvolution of RNA-seq data. Genome Med. 2019; 11:34. https://doi.org/10.1186/s13073-019-0638-6 [PubMed]
- 36. Hänzelmann S, Castelo R, Guinney J. GSVA: gene set variation analysis for microarray and RNA-seq data. BMC Bioinformatics. 2013; 14:7. https://doi.org/10.1186/1471-2105-14-7 [PubMed]
- 37. Xu FQ, Dong MM, Wang ZF, Cao LD. Metabolic rearrangements and intratumoral heterogeneity for immune response in hepatocellular carcinoma. Front Immunol. 2023; 14:1083069. https://doi.org/10.3389/fimmu.2023.1083069 [PubMed]
- 38. Fang JH, Zhou HC, Zhang C, Shang LR, Zhang L, Xu J, Zheng L, Yuan Y, Guo RP, Jia WH, Yun JP, Chen MS, Zhang Y, Zhuang SM. A novel vascular pattern promotes metastasis of hepatocellular carcinoma in an epithelial-mesenchymal transition-independent manner. Hepatology. 2015; 62:452–65. https://doi.org/10.1002/hep.27760 [PubMed]
- 39. Zheng N, Zhang S, Wu W, Zhang N, Wang J. Regulatory mechanisms and therapeutic targeting of vasculogenic mimicry in hepatocellular carcinoma. Pharmacol Res. 2021; 166:105507. https://doi.org/10.1016/j.phrs.2021.105507 [PubMed]
- 40. Yang S, Yang C, Yu F, Ding W, Hu Y, Cheng F, Zhang F, Guan B, Wang X, Lu L, Rao J. Endoplasmic reticulum resident oxidase ERO1-Lalpha promotes hepatocellular carcinoma metastasis and angiogenesis through the S1PR1/STAT3/VEGF-A pathway. Cell Death Dis. 2018; 9:1105. https://doi.org/10.1038/s41419-018-1134-4 [PubMed]
- 41. Xue X, Gao W, Sun B, Xu Y, Han B, Wang F, Zhang Y, Sun J, Wei J, Lu Z, Zhu Y, Sato Y, Sekido Y, et al. Vasohibin 2 is transcriptionally activated and promotes angiogenesis in hepatocellular carcinoma. Oncogene. 2013; 32:1724–34. https://doi.org/10.1038/onc.2012.177 [PubMed]
- 42. Ribatti D, Djonov V. Intussusceptive microvascular growth in tumors. Cancer Lett. 2012; 316:126–31. https://doi.org/10.1016/j.canlet.2011.10.040 [PubMed]
- 43. Lin J, Cao S, Wang Y, Hu Y, Liu H, Li J, Chen J, Li P, Liu J, Wang Q, Zheng L. Long non-coding RNA UBE2CP3 enhances HCC cell secretion of VEGFA and promotes angiogenesis by activating ERK1/2/HIF-1α/VEGFA signalling in hepatocellular carcinoma. J Exp Clin Cancer Res. 2018; 37:113. https://doi.org/10.1186/s13046-018-0727-1 [PubMed]
- 44. Lim KC, Chow PK, Allen JC, Chia GS, Lim M, Cheow PC, Chung AY, Ooi LL, Tan SB. Microvascular invasion is a better predictor of tumor recurrence and overall survival following surgical resection for hepatocellular carcinoma compared to the Milan criteria. Ann Surg. 2011; 254:108–13. https://doi.org/10.1097/SLA.0b013e31821ad884 [PubMed]
- 45. Erstad DJ, Tanabe KK. Prognostic and Therapeutic Implications of Microvascular Invasion in Hepatocellular Carcinoma. Ann Surg Oncol. 2019; 26:1474–93. https://doi.org/10.1245/s10434-019-07227-9 [PubMed]
- 46. Sun X, Yang Z, Mei J, Lyu N, Lai J, Chen M, Zhao M. The guiding value of microvascular invasion for treating early recurrent small hepatocellular carcinoma. Int J Hyperthermia. 2021; 38:931–38. https://doi.org/10.1080/02656736.2021.1937715 [PubMed]
- 47. Li T, Peng J, Li Q, Shu Y, Zhu P, Hao L. The Mechanism and Role of ADAMTS Protein Family in Osteoarthritis. Biomolecules. 2022; 12:959. https://doi.org/10.3390/biom12070959 [PubMed]
- 48. Kumar S, Rao N, Ge R. Emerging Roles of ADAMTSs in Angiogenesis and Cancer. Cancers (Basel). 2012; 4:1252–99. https://doi.org/10.3390/cancers4041252 [PubMed]
- 49. Kim HJ, Jeong HY, Batara DC, Moon C, Lee S, Lee SJ, Park SI, Choi MC, Kim SH. Downregulation of ADAMTS3 Suppresses Stemness and Tumorigenicity in Glioma Stem Cell. CNS Neurosci Ther. 2023; 29:682–90. https://doi.org/10.1111/cns.14052 [PubMed]
- 50. She S, Ren L, Chen P, Wang M, Chen D, Wang Y, Chen H. Functional Roles of Chemokine Receptor CCR2 and Its Ligands in Liver Disease. Front Immunol. 2022; 13:812431. https://doi.org/10.3389/fimmu.2022.812431 [PubMed]
- 51. Fein MR, He XY, Almeida AS, Bružas E, Pommier A, Yan R, Eberhardt A, Fearon DT, Van Aelst L, Wilkinson JE, Dos Santos CO, Egeblad M. Cancer cell CCR2 orchestrates suppression of the adaptive immune response. J Exp Med. 2020; 217:e20181551. https://doi.org/10.1084/jem.20181551 [PubMed]
- 52. Hammerich L, Tacke F. Hepatic inflammatory responses in liver fibrosis. Nat Rev Gastroenterol Hepatol. 2023; 20:633–46. https://doi.org/10.1038/s41575-023-00807-x [PubMed]
- 53. Bartneck M, Schrammen PL, Möckel D, Govaere O, Liepelt A, Krenkel O, Ergen C, McCain MV, Eulberg D, Luedde T, Trautwein C, Kiessling F, Reeves H, et al. The CCR2+ Macrophage Subset Promotes Pathogenic Angiogenesis for Tumor Vascularization in Fibrotic Livers. Cell Mol Gastroenterol Hepatol. 2019; 7:371–90. https://doi.org/10.1016/j.jcmgh.2018.10.007 [PubMed]
- 54. Li X, Wu X, Luo P, Xiong L. Astrocyte-specific NDRG2 gene: functions in the brain and neurological diseases. Cell Mol Life Sci. 2020; 77:2461–72. https://doi.org/10.1007/s00018-019-03406-9 [PubMed]
- 55. Wang J, Liu M, Hou W, Hou M, Zhang L, Sun M, Liu S, Yang H, Guo H, Zhang X, Xie F, Liu Y, Ma Y. N-myc Downstream-Regulated Gene 2 (Ndrg2): A Critical Mediator of Estrogen-Induced Neuroprotection Against Cerebral Ischemic Injury. Mol Neurobiol. 2022; 59:4793–804. https://doi.org/10.1007/s12035-022-02877-5 [PubMed]
- 56. Kloten V, Schlensog M, Eschenbruch J, Gasthaus J, Tiedemann J, Mijnes J, Heide T, Braunschweig T, Knüchel R, Dahl E. Abundant NDRG2 Expression Is Associated with Aggressiveness and Unfavorable Patients’ Outcome in Basal-Like Breast Cancer. PLoS One. 2016; 11:e0159073. https://doi.org/10.1371/journal.pone.0159073 [PubMed]
- 57. Li SJ, Wang WY, Li B, Chen B, Zhang B, Wang X, Chen CS, Zhao QC, Shi H, Yao L. Expression of NDRG2 in human lung cancer and its correlation with prognosis. Med Oncol. 2013; 30:421. https://doi.org/10.1007/s12032-012-0421-7 [PubMed]
- 58. Lee DC, Kang YK, Kim WH, Jang YJ, Kim DJ, Park IY, Sohn BH, Sohn HA, Lee HG, Lim JS, Kim JW, Song EY, Kim DM, et al. Functional and clinical evidence for NDRG2 as a candidate suppressor of liver cancer metastasis. Cancer Res. 2008; 68:4210–20. https://doi.org/10.1158/0008-5472.CAN-07-5040 [PubMed]
- 59. Wang J, Li T, Ma L, Liu G, Wang G, Kang J. NDRG2 inhibition facilitates angiogenesis of hepatocellular carcinoma. Open Med (Wars). 2021; 16:742–48. https://doi.org/10.1515/med-2021-0268 [PubMed]
- 60. Jia S, Meng A. TGFβ family signaling and development. Development. 2021; 148:dev188490. https://doi.org/10.1242/dev.188490 [PubMed]
- 61. Wu Y, Du K, Guan W, Wu D, Tang H, Wang N, Qi J, Gu Z, Yang J, Ding J. A novel definition of microvessel density in renal cell carcinoma: Angiogenesis plus vasculogenic mimicry. Oncol Lett. 2020; 20:192. https://doi.org/10.3892/ol.2020.12054 [PubMed]
- 62. Hong X, Wen B, Zhang H, Li Y, Wu H, Zhao W, Luo X. Biological effects of NODAL on endometrial cancer cells and its underlying mechanisms. Exp Ther Med. 2021; 21:402. https://doi.org/10.3892/etm.2021.9833 [PubMed]
- 63. Kong B, Wang W, Esposito I, Friess H, Michalski CW, Kleeff J. Increased expression of Nodal correlates with reduced patient survival in pancreatic cancer. Pancreatology. 2015; 15:156–61. https://doi.org/10.1016/j.pan.2015.02.001 [PubMed]
- 64. Sun C, Sun L, Jiang K, Gao DM, Kang XN, Wang C, Zhang S, Huang S, Qin X, Li Y, Liu YK. NANOG promotes liver cancer cell invasion by inducing epithelial-mesenchymal transition through NODAL/SMAD3 signaling pathway. Int J Biochem Cell Biol. 2013; 45:1099–108. https://doi.org/10.1016/j.biocel.2013.02.017 [PubMed]
- 65. Giraud J, Chalopin D, Blanc JF, Saleh M. Hepatocellular Carcinoma Immune Landscape and the Potential of Immunotherapies. Front Immunol. 2021; 12:655697. https://doi.org/10.3389/fimmu.2021.655697 [PubMed]
- 66. Oura K, Morishita A, Tani J, Masaki T. Tumor Immune Microenvironment and Immunosuppressive Therapy in Hepatocellular Carcinoma: A Review. Int J Mol Sci. 2021; 22:5801. https://doi.org/10.3390/ijms22115801 [PubMed]
- 67. Ma J, Kuang L, Zhao R. Establishing a signature based on immunogenic cell death-related gene pairs to predict immunotherapy and survival outcomes of patients with hepatocellular carcinoma. Aging (Albany NY). 2022; 14:9699–714. https://doi.org/10.18632/aging.204419 [PubMed]
- 68. Arvanitakis K, Koletsa T, Mitroulis I, Germanidis G. Tumor-Associated Macrophages in Hepatocellular Carcinoma Pathogenesis, Prognosis and Therapy. Cancers (Basel). 2022; 14:226. https://doi.org/10.3390/cancers14010226 [PubMed]
- 69. Yeung OW, Lo CM, Ling CC, Qi X, Geng W, Li CX, Ng KT, Forbes SJ, Guan XY, Poon RT, Fan ST, Man K. Alternatively activated (M2) macrophages promote tumour growth and invasiveness in hepatocellular carcinoma. J Hepatol. 2015; 62:607–16. https://doi.org/10.1016/j.jhep.2014.10.029 [PubMed]
- 70. Ho DW, Tsui YM, Chan LK, Sze KM, Zhang X, Cheu JW, Chiu YT, Lee JM, Chan AC, Cheung ET, Yau DT, Chia NH, Lo IL, et al. Single-cell RNA sequencing shows the immunosuppressive landscape and tumor heterogeneity of HBV-associated hepatocellular carcinoma. Nat Commun. 2021; 12:3684. https://doi.org/10.1038/s41467-021-24010-1 [PubMed]
- 71. Wesch D, Kabelitz D, Oberg HH. Tumor resistance mechanisms and their consequences on γδ T cell activation. Immunol Rev. 2020; 298:84–98. https://doi.org/10.1111/imr.12925 [PubMed]
- 72. Zhang X, Xie J, He D, Yan X, Chen J. Cell Pair Algorithm-Based Immune Infiltrating Cell Signature for Improving Outcomes and Treatment Responses in Patients with Hepatocellular Carcinoma. Cells. 2023; 12:202. https://doi.org/10.3390/cells12010202 [PubMed]
- 73. He Q, Yang J, Jin Y. Development and Validation of TACE Refractoriness-Related Diagnostic and Prognostic Scores and Characterization of Tumor Microenvironment Infiltration in Hepatocellular Carcinoma. Front Immunol. 2022; 13:869993. https://doi.org/10.3389/fimmu.2022.869993 [PubMed]
- 74. Hinshaw DC, Shevde LA. The Tumor Microenvironment Innately Modulates Cancer Progression. Cancer Res. 2019; 79:4557–66. https://doi.org/10.1158/0008-5472.CAN-18-3962 [PubMed]
- 75. Rotte A. Combination of CTLA-4 and PD-1 blockers for treatment of cancer. J Exp Clin Cancer Res. 2019; 38:255. https://doi.org/10.1186/s13046-019-1259-z [PubMed]
- 76. Caronni N, Savino B, Recordati C, Villa A, Locati M, Bonecchi R. Cancer and Chemokines. Methods Mol Biol. 2016; 1393:87–96. https://doi.org/10.1007/978-1-4939-3338-9_8 [PubMed]
- 77. Wang T, Chen B, Meng T, Liu Z, Wu W. Identification and immunoprofiling of key prognostic genes in the tumor microenvironment of hepatocellular carcinoma. Bioengineered. 2021; 12:1555–75. https://doi.org/10.1080/21655979.2021.1918538 [PubMed]
- 78. Zhang Y, Xu J, Zhang N, Chen M, Wang H, Zhu D. Targeting the tumour immune microenvironment for cancer therapy in human gastrointestinal malignancies. Cancer Lett. 2019; 458:123–35. https://doi.org/10.1016/j.canlet.2019.05.017 [PubMed]
- 79. Wang X, Wu Y, Wen D, Wu LY, Zhao Y, He Y, Yang H. An Individualized Immune Prognostic Index is a Superior Predictor of Survival of Hepatocellular Carcinoma. Med Sci Monit. 2020; 26:e921786. https://doi.org/10.12659/MSM.921786 [PubMed]