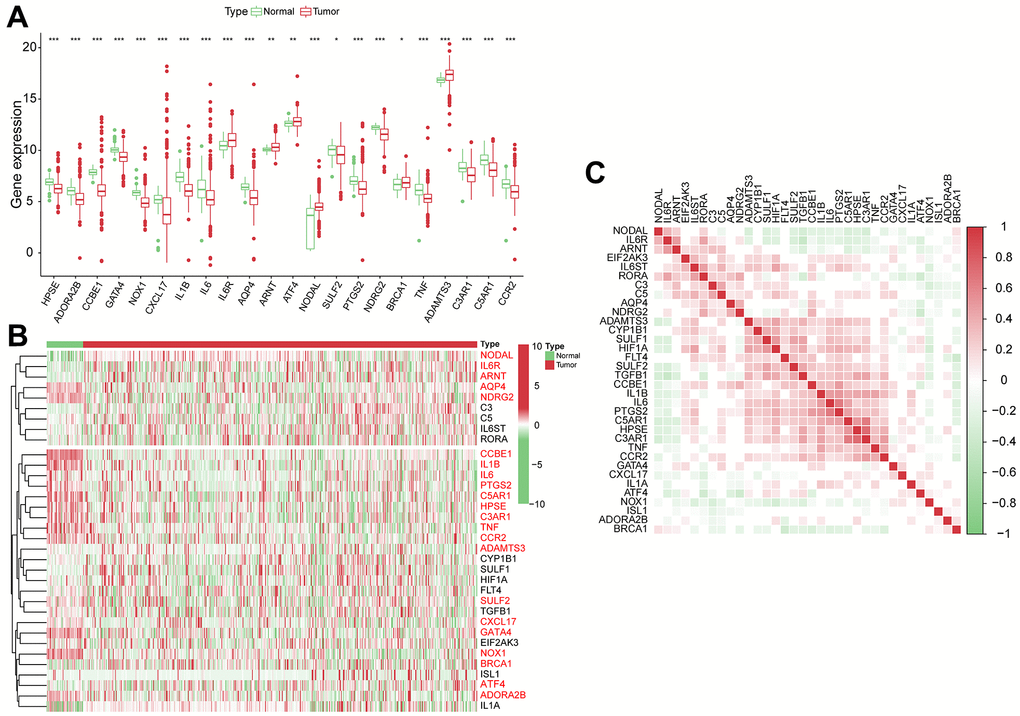
Figure 1.The genomic characterization of VPRGs. (A) Boxplot for differentially expressed VPRGs. (B) Heatmap for differentially expressed VPRGs; genes with red color are significantly differently expressed between normal liver tissues and HCC tissues. (C) Correlation plot for VPRGs; red and green squares indicate positive and inverse correlation respectively. ***p < 0.001, **p < 0.001, *p < 0.05.