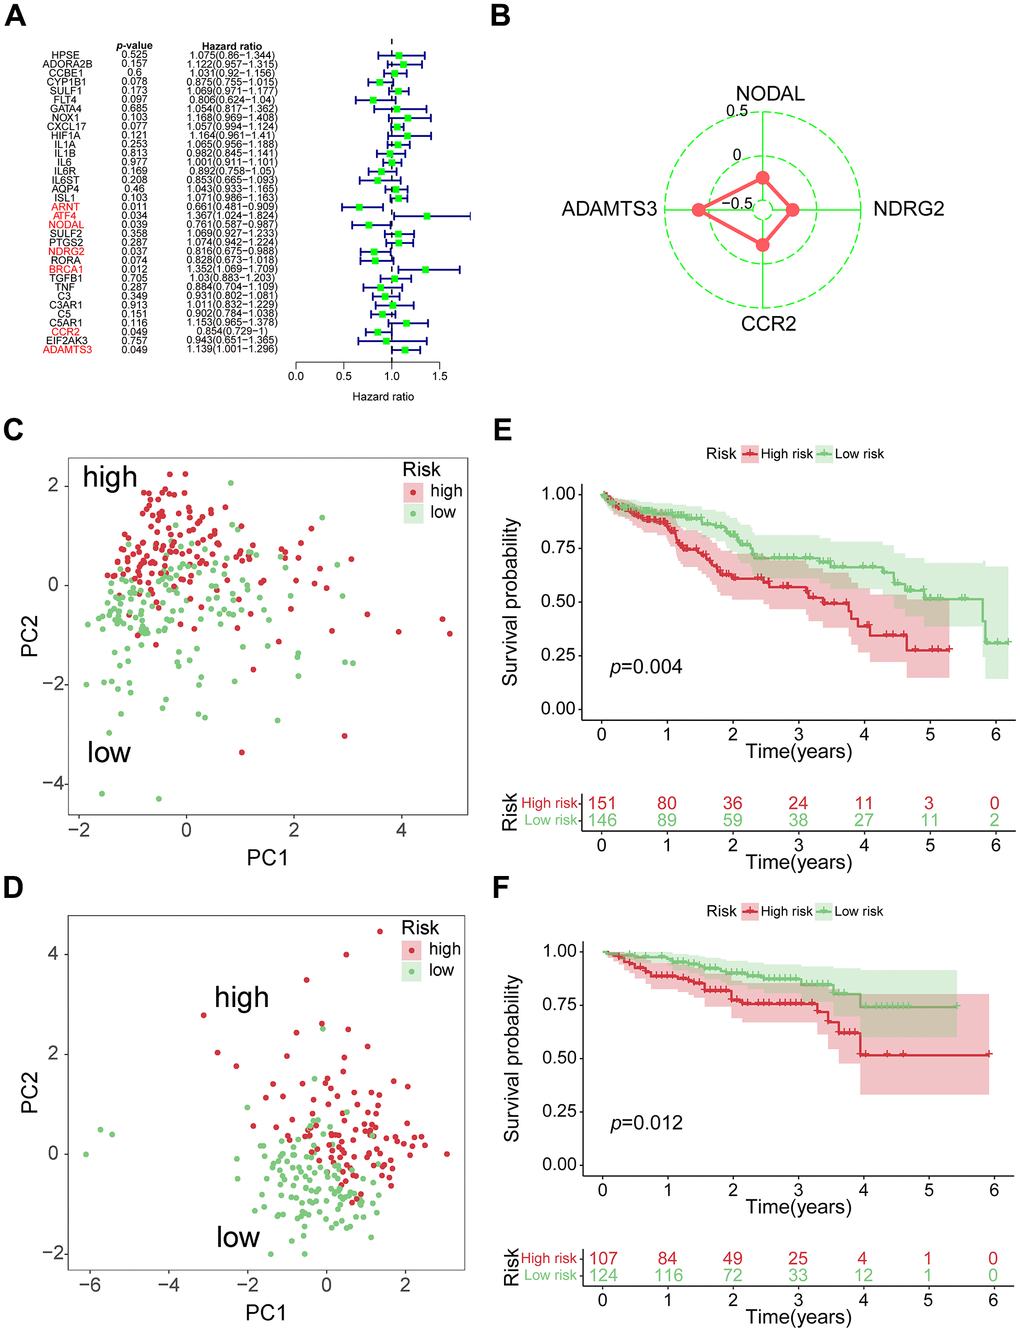
Figure 2.Construction of 4-genes VPRS. (A) Forest plot for the survival analysis of HCC patients with a univariate Cox model after adjustment for VPRGs; red color represents p < 0.05. (B) Radar diagram of efficiency of the 4 genes in VPRS; the closer the red dot is to the outside, the greater the value it represents. (C) PCA of HCC samples in TCGA; dots in red and green represent samples in high-risk and low-risk groups respectively. (D) Overall survival analysis of risk score for HCC patients in TCGA. (E) PCA in ICGC-HCC. (F) Survival analysis in ICGC-HCC.