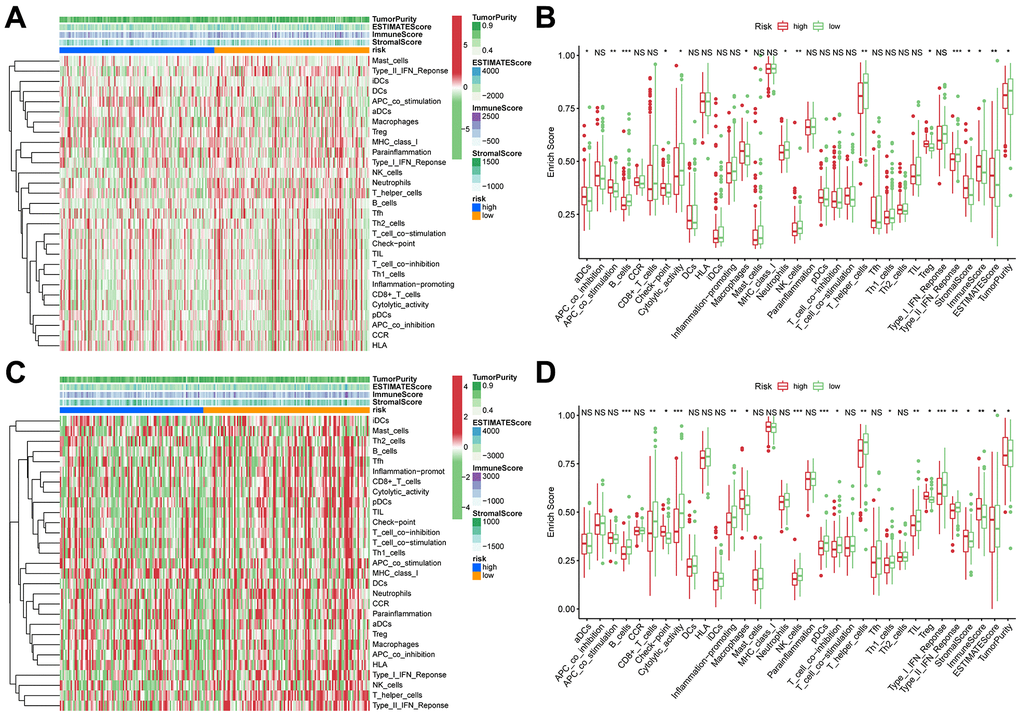
Figure 6.ssGSEA of immune hallmarks. (A) Heatmap of ssGSEA scores among high- and low-risk groups in training sets (green = negative, red = positive). (B) Boxplot of ssGSEA scores, immune score, stromal score, ESTIMATE score, and tumor purity among high- and low-risk groups in TCGA cohorts. (C) Heatmap of ssGSEA scores among high- and low-risk groups in validation sets (green = negative, red = positive). (D) Boxplot of ssGSEA scores, immune score, stromal score, ESTIMATE score, and tumor purity among high- and low-risk groups in ICGC cohorts. ***p < 0.001, **p < 0.001, *p < 0.05.