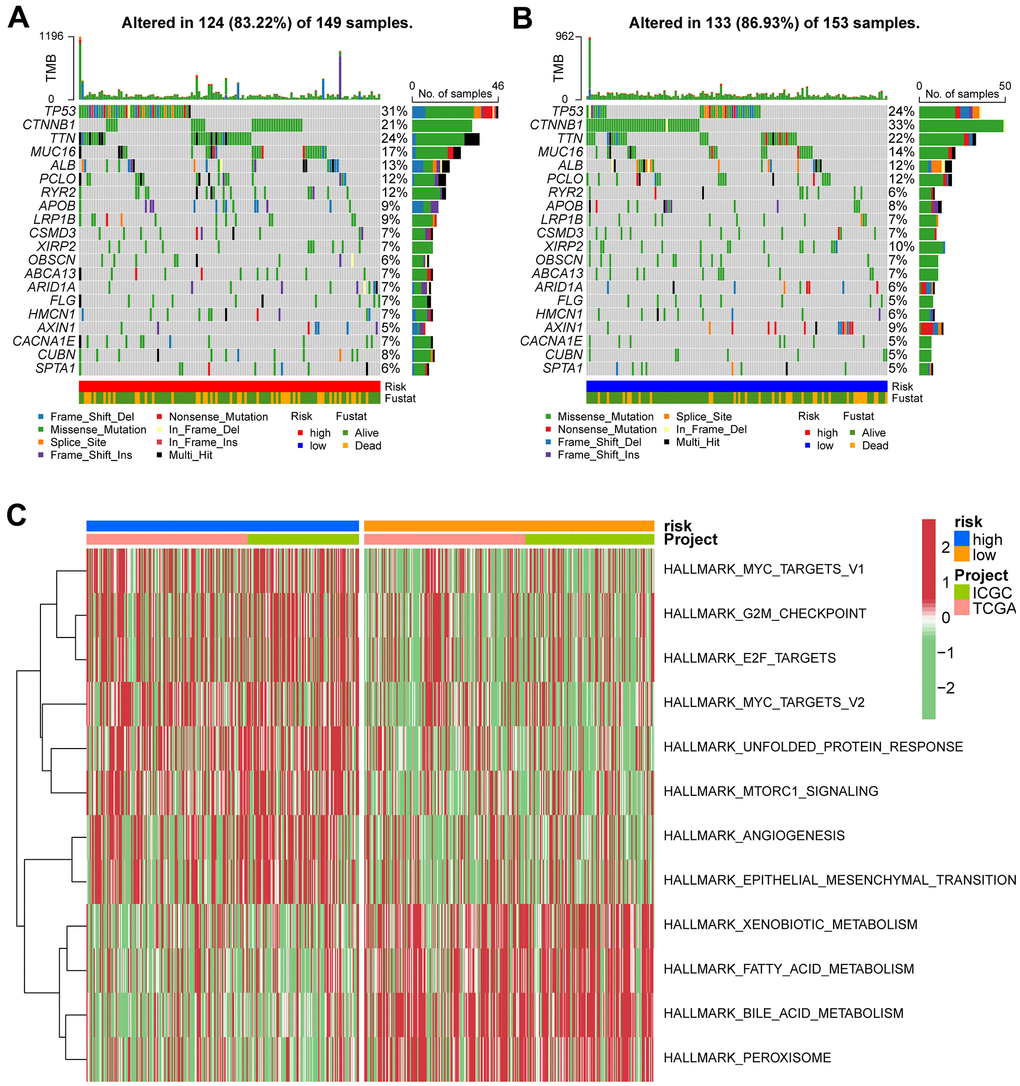
Figure 8.Gene set variation analysis and correlation between mutation and risk subtype. (A) Top 20 highly mutated genes in HCC high-risk group. (B) Top 20 highly mutated genes in HCC low-risk group. (C) Heatmap for the contribution of GSVA scores of hallmarks in high- and low-risk groups. The red color represents up-regulated terms in the high-risk group, green color shows the down-regulated terms in the low-risk group.