


Introduction
Glioblastoma (GBM), characterized by rapid proliferation, aggressiveness, a high recurrence rate, and a poor prognosis, is one of the most deadly and recalcitrant solid tumors [1–3]. Despite intensive efforts, a 5-year survival rate of 5% has only been achieved in the United States [4]. An effective strategy for anti-glioma therapy remains a challenge worldwide [5].
Recent studies highlight the importance of cancer-initiating cells in the malignant process of gliomas [6–8]. These cells have been referred to as glioma stem cells (GSCs) because they share similar characteristics to normal neural stem cells (NSCs) in the brain. A number of studies have demonstrated that GSCs have the capacity to repopulate tumors and mediate radio- and chemo-resistance [9–11]. A rare GSC population initiates, maintains, and recapitulates the phenotype of original gliomas [12, 13]. When GSCs are eliminated from the bulk tumor mass, tumor growth is inhibited. Therefore, targeting GSCs could be a rationale strategy for glioma therapy; however, the mechanism by which GSCs maintain their immature stem-like state or become committed to differentiation is poorly understood.
The Notch signaling pathway is an intercellular signaling pathway that plays an important role in most multicellular processes, such as neural differentiation, proliferation, survival, angiogenesis, and stemness [14–16]. Notch contains an extracellular domain responsible for ligand recognition, a transmembrane domain, and an intracellular domain involved in transcriptional regulation [17, 18]. To date, four Notch receptors (Notch1-4) and five ligands (Jagged1, Jagged2, and Delta-like 1, 3, and 4) have been identified in humans. When extracellular ligand binds to Notch, γ-secretase at the transmembrane region activates the Notch intracellular domain (NICD), which latter translocates to the nucleus and facilitates the transcription of genes, including Hes/Hey family members, by binding to the targeted protein [19, 20]. These pathways in turn contribute to maintaining the stem cell program in several cell types; however, the specific functions of Notch signaling in gliomas remain elusive [21–23].
Twist1, a member of the basic helix–loop–helix (bHLH) family, plays a pivotal role in determining cell fate in the mesoderm [24], as well as in tumorigenesis, through inhibition of p53-mediated apoptosis in rodent fibroblasts [25–27] and cancer cells [28–29]. The anti-apoptotic effect of Twist1 suggests that Twist1 can function as an oncogene in tumor progression. In addition, other studies have demonstrated that Twist1 increases cell migration by promoting epithelial mesenchymal transition (EMT) and inducing cell motility [30]. Therefore, elevation of Twist1 mRNA is an ideal strategy for anticancer treatment, which has been thoroughly studied in several cancers, including gliomas [31, 32].
Given the importance of the Notch pathway and Twist1 in carcinogenesis and metastasis of GBM [12, 33], we determined the potential relationship between the Notch signaling pathway and Twist1 in maintaining biological functions of GSCs, thus providing a new treatment modality with which to block glioma progression. First, the stemness property of GSCs derived from primary and recurrent glioma patients was verified, and the Notch signaling pathway-related genetic alterations were identified, including Twist1, by gene Chip analysis. Then, we increased/decreased the level of Notch and Twist1 expression in GSCs by treatment with NICD lentivirus, Notch antagonist, or Twist1-shRNA. Cell proliferation, neurosphere formation, and migration assay confirmed the Notch/Twist1 effect on GSC biological processes. In addition, an orthotopic glioma mouse model was developed to evaluate the effect of Notch/Twist1 in vivo. Furthermore, luciferase reporter and chromatin immunoprecipitation assays were performed to investigate the exact binding site of NICD and Twist1 in GSCs. Taken together, our data showed that Notch/Twist1 promotes tumor progression vis-a-vis direct targeting of NCID to Twist1 promoter in GSCs derived from primary and recurrent glioblastomas.
Results
Formation of neurosphere-like colonies derived from primary and recurrent GBM patients
First, neurosphere-like colonies were obtained from GBM patients. Ten GBM specimens from 5 patients with primary and recurrent GBMs were collected in this study. Tumor tissues were mechanically dissociated into single cell suspensions and cultured in serum-free DMEM/F12 medium supplemented with EGF, bFGF, and B-27 supplement. Results from microscopic observations confirmed that three primary GBMs (GSC2, GSC3, and GSC5) and four recurrent GBMs (GSC1R, GSC2R, GSC3R, and GSC5R) showed proliferating tumor spheres, and the typical morphology of neurospheres, as shown in Figure 1A (indicated by cyan arrows). Therefore, we studied the proliferative potential and in vitro tumorigenicity experiments on these sever GSC lines. Neurospheres derived from recurrent GBMs were noted within 24 h of culturing, which was significantly more rapid than neurospheres derived from primary GBMs (within 72 h; Figure 1B); owever, all cell lines showed similar exponential growth patterns within 7 days, while GSC3 cells exhibited a slightly slower growth rate (data not shown).
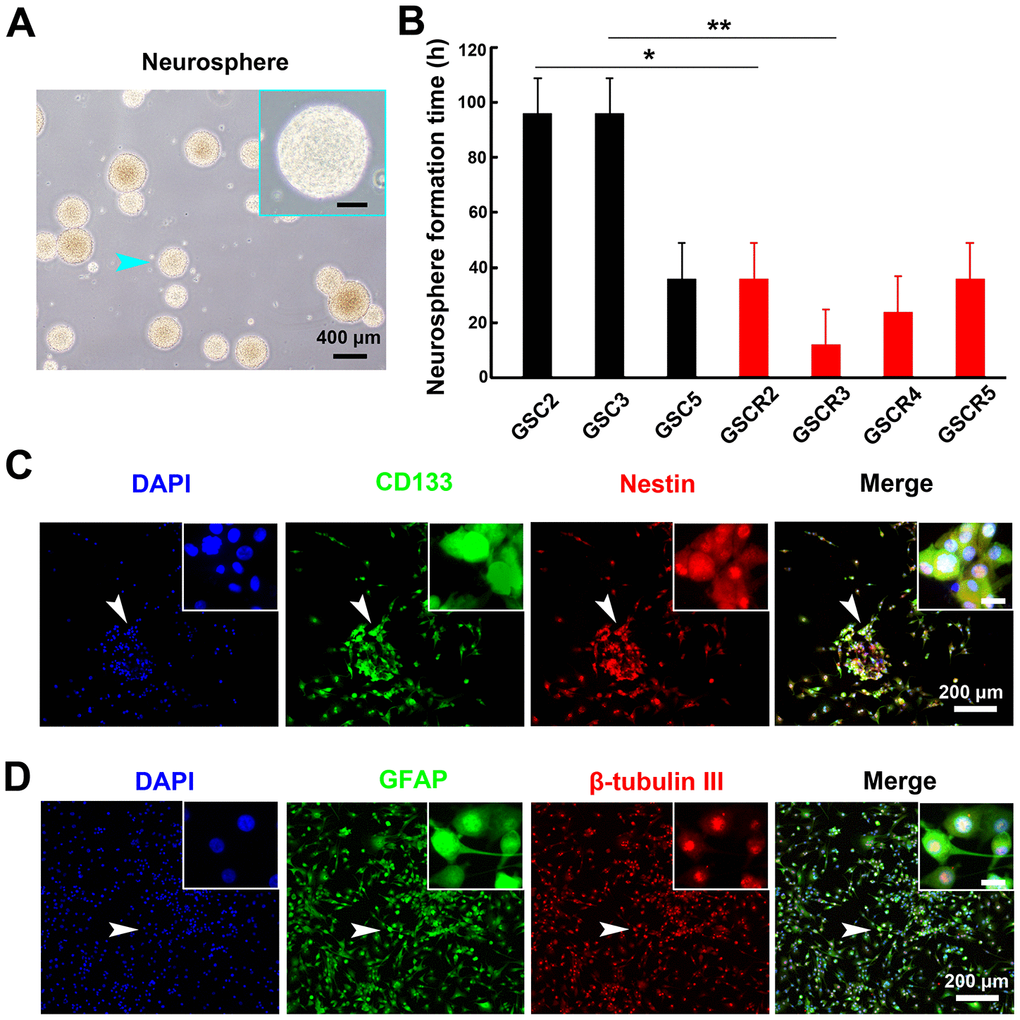
Figure 1. Patient glioma-derived stem cells formed neurosphere-like colonies and demonstrated characteristics of NSCs. (A) Morphology of typical primary neuorspheres derived from GBM tissues. The scale bar in high-magnification images (cyan arrow pointed region in low-magnification image) represent 50 μm. (B) The neurosphere formation time on different GSCs. Five primary and paired recurrent GBM tissues were obtained and cultured for at least 7 d. Neurospheres from 4 recurrent and 3 primary GBMs were formed. The recurrent GSCs showed higher formation ability compared with the primary GSCs (*: P < 0.05 and **: P < 0.01). (C) Immunofluorescent staining of primary tumor spheres with stem cell markers (CD133 [green]) and Nestin [red]) confirmed stemness of neurospheres. (D) The neurospheres were cultured in differentiation medium for 7 d, and differentiation markers (GFAP [green] and beta-tubulin III [red]) were immunofluorescence-stained. The obtained neurospheres maintained the typical multipotency ability. The scale bar in high-magnification images (white arrow in low-magnification images) represents 20 μm.
To further confirm whether the tumor spheres-maintained neuro stem cell (NSC) characteristics, the NSC specific markers, CD133 and Nestin, were measured using immunofluorescence. As shown in Figure 1C, the primary tumor spheres had a high level of CD 133 (green) and Nestin (red) expression, which suggested that these cells were NSCs. Then, a differentiation assay was performed to determine the multipotency of these GBM-derived neurospheres. After treatment with differentiation-inducing medium for 7 d, different molecular markers on neurospheres were verified. The astrocyte-specific marker, GFAP, as well as the neuron-specific marker, beta-tubulin III, were observed under fluorescence microscopy (Figure 1D), demonstrating that neurospheres differentiated into astrocytes and neurons under the differentiation conditions. Because only a few neuronal markers were studied, further investigations with additional neuronal markers or glioblastoma cells as controls to compare with neurospheres are warranted. It should be noted that these tumor spheres obtained from mechanical dissociation could be cultured for at least 5 generations (approximately 5 weeks), and the tumor spheres will maintain stemness and multipotency in serum-free medium in the presence of growth factors (data not shown).
Upregulation of Notch and Twist1 genes in neurospheres from primary or recurrent GBM
After verifying the stemness and multipotency of GBM-derived neurospheres, the global gene expression on these GSCs was evaluated using an Affymetrix 133 plus 2.0 microarray. In general, there were 1527 genes with significant transcriptional changes in primary and recurrent GSCs, of which 673 genes were upregulated and 854 were downregulated. Specifically, the genes associated with glioma development, including Notch, NF-kB, TGF-β, STAT3, and HIF1-α, were prominently up- or down-regulated in GSCs (Supplementary Information 1 and 2). Notch signaling-associated genes, such as Notch1, Notch3, Notch4, DLL3, Jagged1, Hes1, and RBPJ, were significantly enriched. In addition, the Twist1 gene, an important member in the HLH family related to glioma invasion, was also upregulated (Figure 2A). It is notable that the levels of Notch1, Jagged1, Twist1, and Hes1 mRNA expression in recurrent GSCs were significantly higher than primary GSCs (Figure 2B–2E). The other Notch signaling molecules investigated were not statistically different between primary and recurrent GSCs.
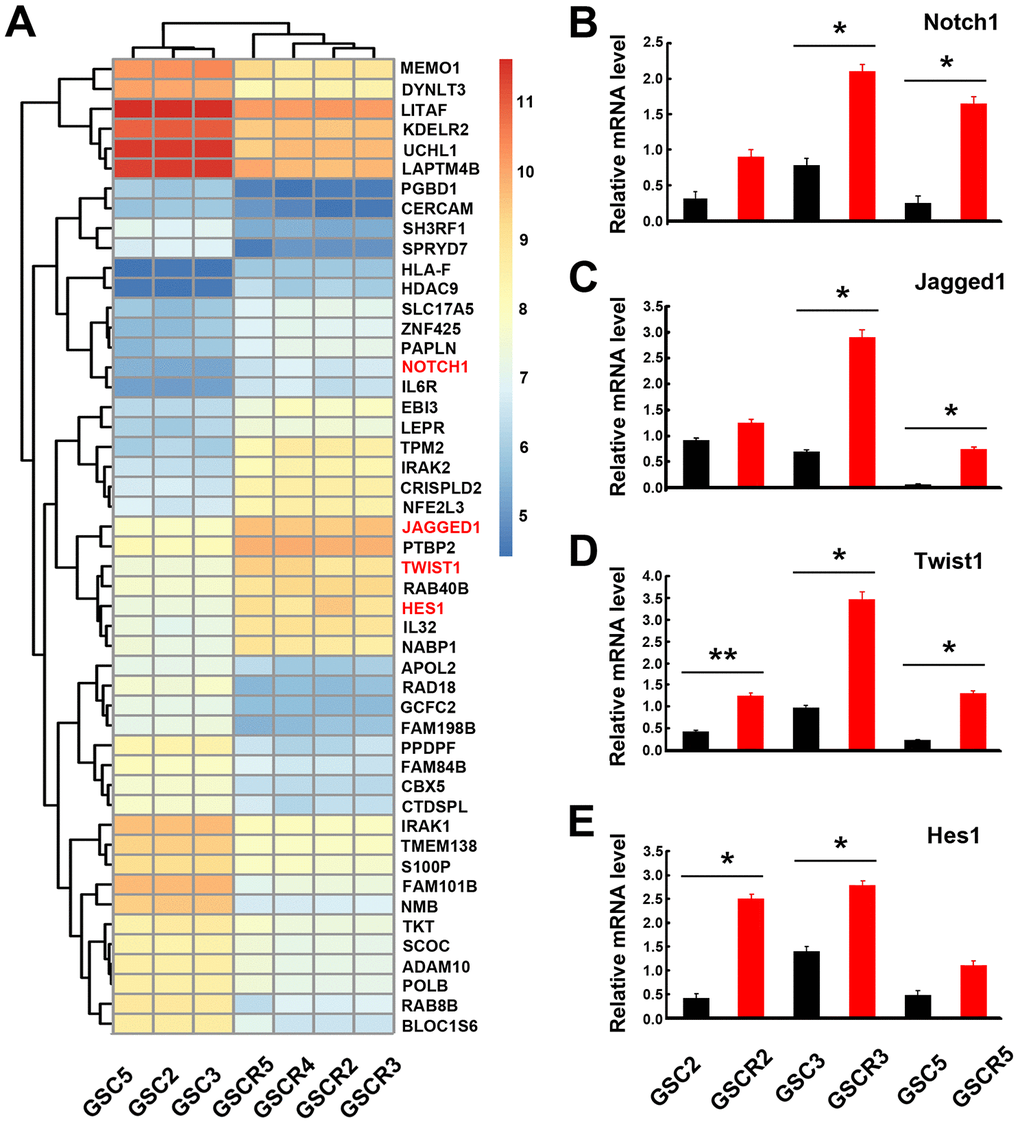
Figure 2. Global gene expression profiles in GSCs from primary and recurrent gliomas. (A) Global gene expression was assayed using the Affymetrix 133 plus 2.0 microarray. The Notch signaling-related and Twist1 genes were notably upregulated. (B–E) Notch signaling-related genes and Twist1 had significant differences in mRNA levels between primary and recurrent GSC lines. Data are presented as the mean ± SD. *: P < 0.05 and **: P < 0.01.
Twist1 is in positive correlation with Notch activation in GSCs
Because Notch and Twist1 genes were significantly upregulated in GSCs, we then investigated the relationship between Notch and Twist by modulating the level of Notch intracellular domain (NICD) expression in GSCs. GSCs were transduced with NICD-lentivirus to induce NICD expression or treated with the Notch antagonist, DAPT, to block Notch signaling. DAPT is a typical Notch signaling pathway inhibitor that has been used in many cell types, including glioblastomas [34]. Twist1 expression was then determined by RT-PCR and Western blot analysis. As shown in Figure 3A and 3B, and Supplementary Figure 1, Twist1 protein and mRNA levels were increased in GSCs on day 2 after NICD transduction, and maintained a high level of expression up to day 7. In contrast, when GSCs were treated with the Notch antagonist, DAPT, for 2 days, Twist1 expression was significantly decreased because the Notch signal pathway was significantly blocked by DAPT (Figure 3C and 3D, and Supplementary Figure 2). Interestingly, the level of Twist1 protein expression in GSCs maintained the original level of expression on day 1 of NICD transduction or DAPT treatment, then increased (NICD transduction) or decreased (DAPT treatment) expression (Figure 3A and 3C). This finding may be due to a delayed response of Twist upon Notch signaling regulation. Moreover, the data indicated that Twist1 was positively correlated with activation of Notch signaling in GSCs.
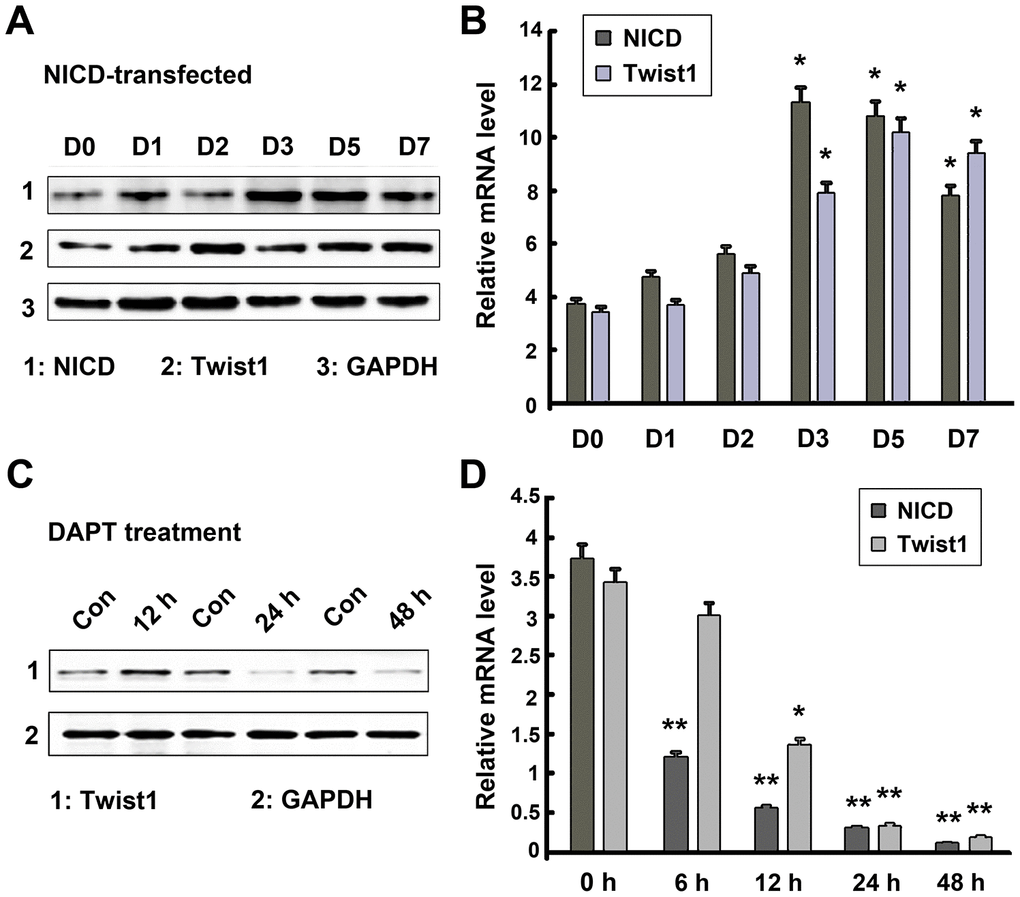
Figure 3. Regulatory relationship of Notch and Twist1 in GSCs. (A, B) Twist1 protein and mRNA levels were significantly increased following NICD lentiviral transduction from day 2-7, while NICD expression level was induced from day 1-7. (C, D) A significant decrease in the levels of NICD and Twist1 protein and mRNA expression in GSCs after treatment with DAPT. Data are presented as the mean ± SD. *: P < 0.05 and **: P < 0.01.
Notch/Twist1 promotes GSCs proliferation and migration
Having verified that Twist1 was positively correlated with activation of Notch in GSCs, the specific effects of Notch/Twist1 on GSCs biological functions were further studied. Because Notch signaling is associated with cell proliferation and migration, cell proliferation, colony formation, and cell migration assays were performed on GSCs with NICD transduction or DAPT treatment. The results showed that the GSC growth and neurosphere formation rates were significantly enhanced after NICD transduction (Figure 4A and 4B), while there was notable suppression after DAPT treatment (Figure 4D and 4E). Moreover, inducing NICD expression in GSCs significantly increased the number of GSCs invading the chamber inserts (Figure 4C), while blocking Notch signaling in GSCs strongly inhibited cell migration (Figure 4F), which was consistent with the cell proliferation data.
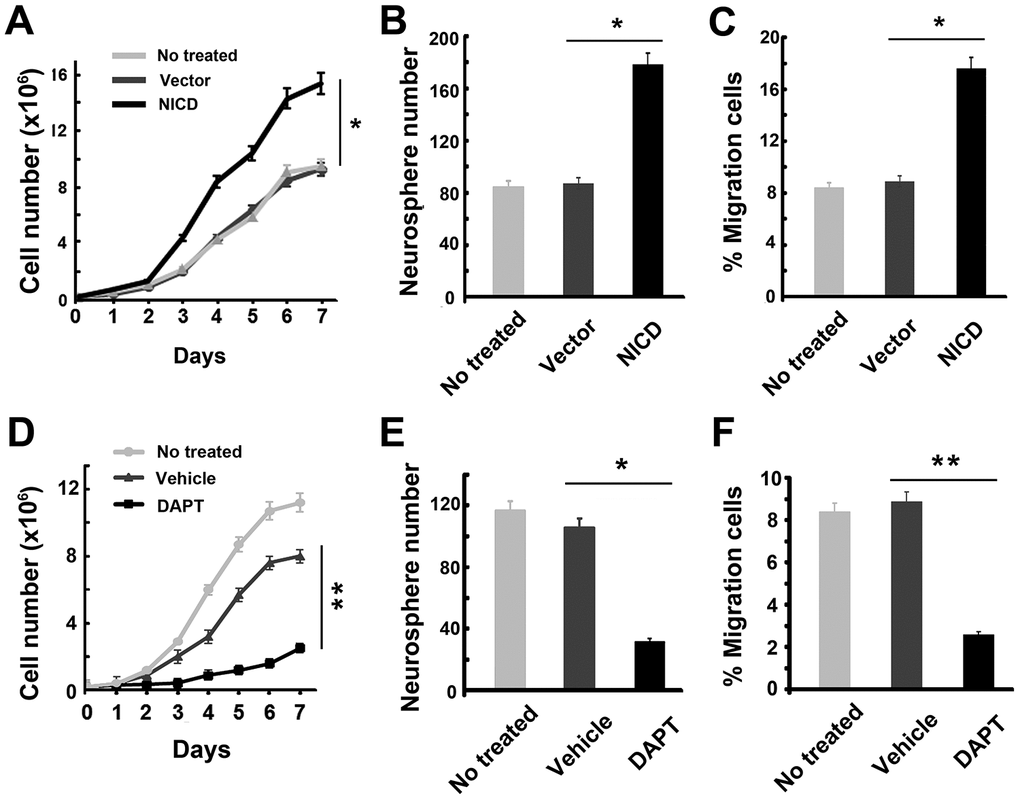
Figure 4. Effect of up- or down-regulation of NICD on cell proliferation and migration ability in GSCs. (A–C) Upregulated NICD promoted cell proliferation, neurosphere formation, and invasion ability of GSCs. The * represents a significant difference from vector-transduced GSCs to NICD-transduced GSCs. (D–F) DAPT suppressed the cell proliferation, neurosphere formation, and invasion ability of GSCs by the transwell assay. Data are presented as the mean ± SD. *: P < 0.05 and **: P < 0.01.
The Notch/Twist1 effects on GSC biological functions were also investigated using Twist1-downregulated or -upregulated recurrent GSCs. After transducing GSCs with Twist1-shRNA (shTwist1), the Twist levels of mRNA and protein expression were significantly decreased in recurrent GSCs (Figure 5A and 5B, and Supplementary Figure 3). After confirming Twist1 silencing in these cells, the transduced cells were re-plated and counted every day for 7 d with renewed NSC medium. As expected, the GSC growth rate was significantly inhibited after transduction of shTwist1 in GSCs (Figure 5D). Interestingly, the promoting effect of NICD on the cell growth rate by NICD-lentivirus transduction completely yielded to shTwist1 inhibition because there was no significant difference in the level of Twist1 expression in cells between shTwist1-alone transduction, and NICD and shTwist1 co-transduction (Figure 5C). Similarly, colony formation and cell migration exhibited a notable decrease in shTwist1-treated GSCs (Figure 5E and 5F), as well as cells co-transduced with NICD and shTwist1. Cell proliferation and migration were significantly increased after overexpression of Twist1 on GSCs by lentivirus transduction; however, these promoting effects of Twist1 were completely suppressed by Notch antagonist DAPT treatment (Supplementary Figure 4). These findings further indicated that regulation of Notch/Twist1 strongly mediates GCA cell biological abilities, such as cell proliferation and migration.
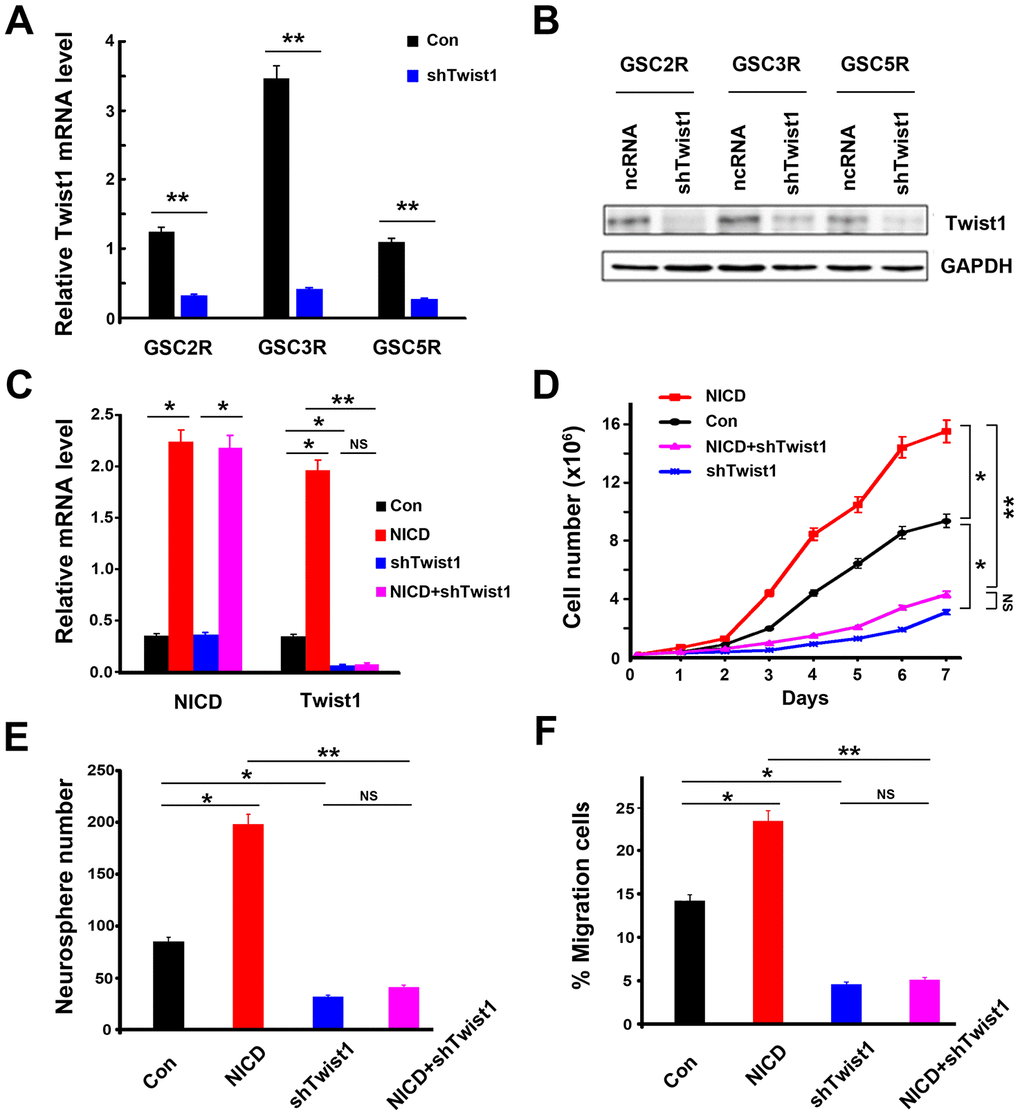
Figure 5. Suppression of Twist1 in GSCs inhibited cell proliferation and migration ability in GSCs. (A) The levels of mRNA expression and (B) protein expression in shTwist1 treated-GSCs. (C) NICD and Twist1 mRNA expression, (D) cell proliferation ability, (E) neurosphere formation, and (F) cell migration ability in GSCs after transduction with NICD lentivirus or/and shTwist1. Data are presented as the mean ± SD. *: P < 0.05 and **: P < 0.01. NS represents no significance.
Notch/Twist1 suppresses the orthotopic glioma growth in xenografted mice
Because in vitro findings confirmed the Notch/Twist1 effects on GSC proliferation, colony formation, and cell migration, Notch/Twist1 were further evaluated in a glioma mouse model. Nude mice were injected intracranially with NICD-transduced GSC3R or NICD-shTwist1-transduced GSC3R, and tumor size was monitored by bioluminescence imaging. As shown in Figure 6A, the luminescence intensity was much lower in NICD-shTwist1-treated group when compared with the NICD alone-treated group, which demonstrated that downregulation of Twist1 inhibited glioma growth. A significantly prolonged survival was observed in mice with NICD-shTwist1 GSCs injection when compared with mice injected with NICD GSCs (Figure 6B). This finding was potentially attributed to the lower Twist1 mRNA level of mouse tumors in the NICD-shTwist1 group compared to the NICD group (Figure 6C). These in vivo data clearly demonstrated that regulation of Notch/Twist1 can significantly mediate tumor growth in tumor-bearing mice, which supports the in vitro data shown above.
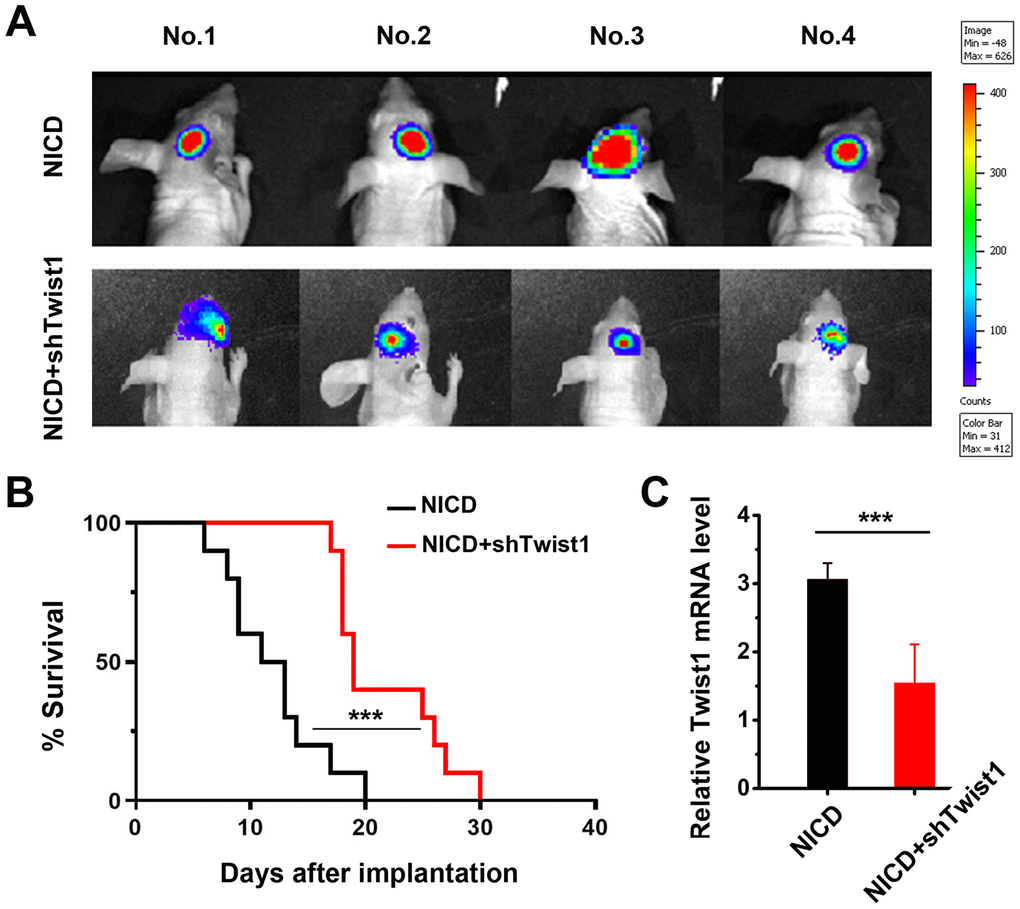
Figure 6. Effect of Notch/Twist1 on orthotopic glioma tumor-bearing mice. (A) Representative bioluminescent images showed tumor growth 8 d after tumor implantation in mice. (B) The survival of mice in different groups. The curve was quantified with a Kaplan-Meier survival curve using Graphpad Prism 8 software. (C) The tumors were collected after mice were sacrificed, and Twist1 mRNA levels in the different groups were measured by RT-qPCR. Data are presented as the mean ± SD. ***: P < 0.001.
Twist1 is directly regulated by Notch signaling
To confirm whether Twist1 serves as a potential direct downstream target of Notch signaling in GSCs, a luciferase reporter driven by a fragment containing one potential NICD/RBPJK-binding-site sequence in the Twist1 promoter as wild type was constructed (Figure 7A). The mutant type with two nucleotide mutations in the binding site was used as a control. Then, the GSCs were co-transfected with NICD and wild or mutant type. The cells were then harvested for luciferase activity measurement. As shown in Figure 7B, a 7-fold increase in luciferase activity in cells with a wild type NICD/RBPJK binding site after NICD transfection when compared with vector transfection; however, there was no significant difference in cells with a mutant type NICD/RBPJK binding site between NICD transfection and vector transfection, suggesting that the NICD/RBPJK binding site is necessary for inducing Twist1 promoter activity.
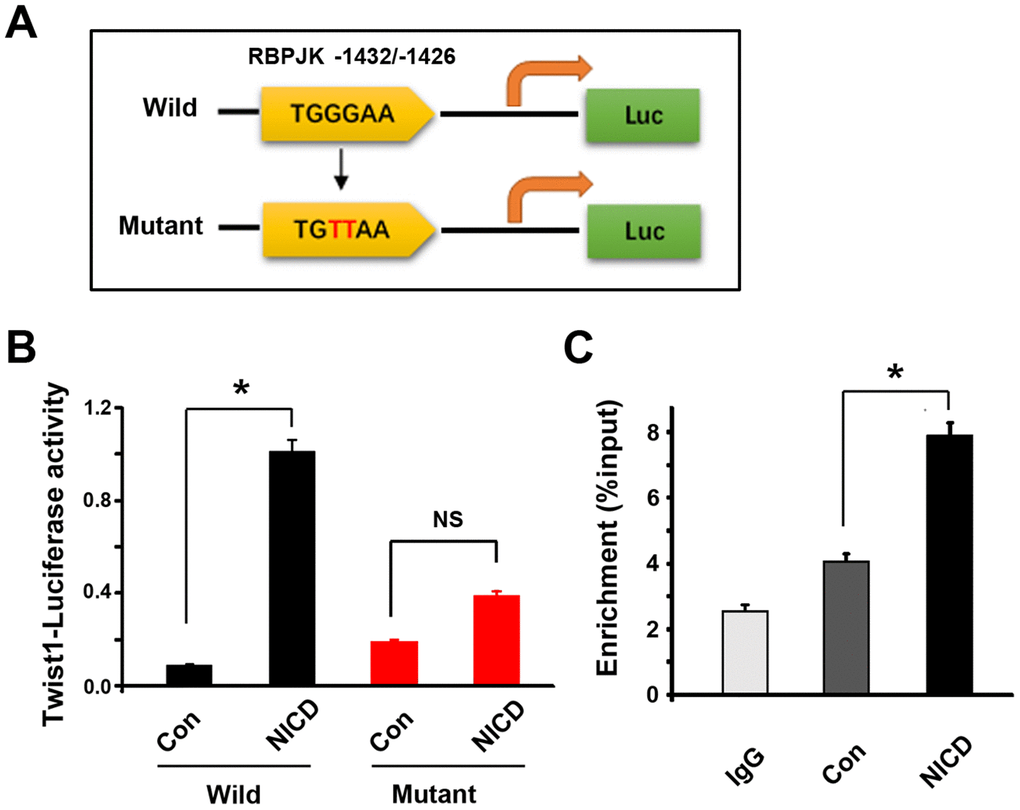
Figure 7. RBPJK binding site in Twist1 promoter is required for molecular interaction with NICD. (A) One possible evolutionary-conserved NICD/RBPJK binding site in Twist1 promotor was revealed using bioinformatic analyses, and mutations of the binding site which are highlighted in red (GG→TT). (B) Measurement of co-transfected firefly luciferase activity in GSCs after co-transfected NICD and wild- or mutant-type Twist1 promoter by bioluminescence assay. The luciferase activity was calculated with an absolute value of the bioluminescent intensity. (C) CHIP assay showed NICD/RBPJK-precipitated fragment binding site. IgG was used as a negative control. Data are shown as the mean ± SD. *: P < 0.05; NS represents no significance.
To further determine whether NICD directly binds to the putative RBPJK binding site in Twist1 promoter, a chromatin immunoprecipitation (CHIP) assay was performed. Soluble chromatin from GSC cells transduced with or without NICD lentivirus was extracted and anti-NICD antibody was used to immunoprecipitate chromatin. Then, the chromatin complex was analyzed by semi-quantitative PCR using primers flanking the RBPJK binding site in Twist1 promoter. In the NICD-upregulated cells, the RBPJK mRNA was significantly enhanced when compared with vector transduction (Figure 7C), indicating a sequence-specific association of NICD with RBPJK in the Twist1 promoter of GSCs. These results suggested that NICD directly bound to the Twist1 promoter, and thus regulated GSC function.
Discussion
The growing body of evidence has shown the significant importance of stem cell-like tumor stem cells in development and recurrence of malignant tumors, including gliomas [10, 35]. Therefore, targeted therapy involving key genes in cancer stem cells (CSCs) has been proposed to improve treatment outcomes in multiple cancers, which has prompted researchers to elucidate the key signaling pathways in CSCs. For example, Notch signaling, which is frequently activated in a variety of cancers [14, 15, 36], such as hematopoietic and solid tumors to maintain the stem cell phenotype, can be regarded as a target for anti-tumor therapy [18, 23]. Moreover, it has been demonstrated that Notch signaling maintains the glioma patient-derived CSCs by promoting self-renewal and inhibiting differentiation [37–40]. Preclinical models have shown inhibition of Notch signaling with γ-secretase inhibitors (DAPT) decreases the number of GSCs and/or tumorigenicity [34]. Despite the well-known Notch effect on GSCs, the molecular mechanism underlying Notch signaling in GSCs has not been fully clarified. In the present study we evaluated Notch signaling in GSCs derived from primary and recurrent glioblastoma patients and demonstrated that a potential Notch signaling target, Twist1, was positively correlated with Notch activation. Twist1 can be significantly enhanced by NICD overexpression, but suppressed by DAPT treatment in GSCs. By examining the effects of Notch/Twist1 on cell function, Notch/Twist1 was shown to play a crucial role in promoting GSC proliferation, colony formation, and cell migration, which collectively facilitate tumor progression and recurrence. Indeed, this is the first report showing a linkage of Notch signaling and the Twist1 axis in regulation of glioma progression.
Twist1 is an essential regulator of mesodermal development [41–43]. Current evidence indicates that Twist1 functions as an oncogene by promoting cell survival by inhibiting p53-mediated apoptosis [25, 44] and enhancing tumor cell migration, as well as invasion [45]. The ability of Twist1 to foster cell survival facilitates tumor progression by inducing resistance to cytotoxic therapies, as well as endogenous cytotoxic stressors, such as reactive oxygen free radicals, generated in the process of increased cellular proliferation [46, 47]. Specifically, it has been reported that Twist1 is amplified in glioma tissues and patient-derived cells and can contribute to glial tumorigenesis and glioma tumor invasion [48]. Alternatively, Hes-1, another target gene of Notch signaling, could be promoted by Twist1 [16, 49]. Therefore, it is suggested that Hes-1 is upregulated by Notch1 signaling through Twist1 in GSCs, which synergistically promotes stem cell functions (Supplementary Figure 5).
In this study we showed that Twist1 was highly expressed in both primary and recurrent glioma patient-derived GSCs. Meanwhile the level of expression was highly correlated with NICD overexpression in GSCs. Furthermore, the Twist1 level in recurrent GSCs was significantly higher than primary GSCs, suggesting that Twist1 may be required for NICD-mediated glioma recurrence. Considering that Twist1 upregulation in GSCs induced by NICD transduction was observed as early as 12 h, Notch signaling was suggested to be an upstream mediator for Twist1. Consequently, silencing of Twist1 by shRNA successfully eliminated the accelerating effect of Notch signaling by NICD transduction on GSCs. The in vivo results further reaffirmed that NICD-enhanced tumor growth in orthotopic glioma mice was significantly suppressed by Twist1 knockdown, which led to a significantly prolonged survival.
Because NICD can translocate to the nucleus and directly bind to promoters to facilitate the transcription of targeted genes, we screened NICD-targeted genes and found a NICD/RBPJK binding site in the Twist1 promoter. Importantly, there multiple pieces of evidence have shown that Notch regulates Twist1 transcription vie the NICD/RBPJK binding element, as in gastric cancer cells [50], mesenchymal progenitor cells [51], melanoma cells [52], and human vascular cells [53], but such has not been demonstrated in glioma cancer types. In this study, we elucidated the correlation between Notch signaling and Twist1 using single-point mutation and CHIP assays based on DNA/protein binding affinity measurement. The Notch intracellular domain bound to RBPJK in the Twist1 promoter of GSCs, which later triggered cascades of downstream expression and mediated cellular events, such as cell proliferation and migration, in GSCs. Therefore, it is reasonable to conclude that the molecular mechanism underlying these cell behaviors are obtained by activating the Notch/Twist1 axis in GSCs. Thus, targeting Notch and Twist1 can potentially serve as a synergistic strategy for anti-GBM treatment.
Taken together, this study presents a new mechanism by which Notch induced Twist1 to promote GSCs maintenance via direct binding of Notch-NICD/RBPJK to the promoter region. These findings provide additional support for the potential treatment of cartilage defects and osteoarthritis by locally manipulating Notch signaling in GSCs. In addition, our work suggests that Notch/Twist1 signaling would be effective in targeting gliomas, as well minimizing glioma recurrence. The clinical evaluation of Twist1 in malignancies and other disorders associated with constitutively-activated Notch signaling may be a valuable diagnostic option.
Materials and Methods
Patient specimens and cell culture
This study was approved by the Ethics Committee of the Sixth Medical Center (Chinese PLA General Hospital, city, China) and conducted with informed consent from all patients. The specimens were obtained from five patients with primary and recurrent gliomas and undergoing surgical operations in the Department of Neurosurgery at the Sixth Medical Center. The glioma stem cells (GSCs) were derived from glioma tissues and cultured, as described previously [7, 13] Briefly, the glioma tissues were mechanically-dissociated with a 200-μL pipette tip. The neurosphere-forming cells were then obtained and cultured in serum-free Dulbecco’s modified Eagle’s medium (DMEM)/F12 medium (Invitrogen, Carlsbad, CA, USA) supplemented with 20 ng/ml of epidermal growth factor (EGF; Peprotech, Rocky Hill, NJ, USA), 20 ng/ml of basic fibroblast growth factor (bFGF; Peprotech), and B-27 supplement (1:50; Gibco, Gaithersburg, MD, USA). The GSCs were designated GSC1, GSC2, GSC3, GSC4, and GSC5 when derived from primary glioma tissues, and GSC1R, GSC2R, GSC3R, GSC4R, and GSC5R when derived from recurrent glioma tissues.
Neurosphere formation and immunofluorescent analysis
The dissociated cells were seeded at 1000 cells/well in 96-well plates in 100 μL of stem cell medium and cultured for 7 days. The number of neurospheres was manually counted under a dissection microscope with 4×4 objective magnification. The expression of stem cell markers (CD133 and Nestin) and differentiation markers (the astrocyte-specific marker, glial fibrillary acidic protein (GFAP), and the neuron-specific marker, beta-tubulin III) on the GSC neurospheres were analyzed using an immunofluorescence assay. Briefly, neurospheres were placed into cell inserts (Millipore, city, state, USA) and fixed with 0.4% paraformaldehyde (PFA; Solarbio, city, China) at 4 °C for 10 min. After thrice-rinsing with PBS, the neurospheres were incubated with mouse anti-CD133 (1:500; Abcam, city, UK) or mouse anti-Nestin (1:500; Abcam) overnight at 4 °C. For detection of cell differentiation, neurospheres were cultured in DMEM/F12 medium containing 10% fetal bovine serum (FBS) for 7 d. Then, the neurospheres were collected and fixed with 0.4% PFA. After rinsing with PBS, the neurospheres were incubated with mouse anti-GFAP (1:500; Sigma, St. Louis, MO, USA) or rabbit anti-beta-tubulin III (1:1000; Sigma) overnight at 4 °C, and Cy3-conjugated goat anti-rabbit IgG (1:500; Jackson ImmunoResearch, West Grove, PA, USA) or FITC-conjugated goat anti-mouse IgG (1:200; Chemicon, Temecula, CA, USA) as secondary antibodies. Then, the neurospheres were stained with DAPI solution (Solarbio) and fluorescently-imaged with a fluorescence microscope (BX-41; Olympus, city, Japan).
Gene-expression mcroarray analysis
Affymetrix 133 Plus 2.0 CEL files were processed using the MAS5 algorithm and probe sets were converted to a refseq transcript ID using a custom chip description file (CDF). To identify differentially-expressed genes between primary and recurrent GBM-derived GSCs, gene set enrichment analysis (GSEA) was performed. The resulting P values were corrected using the method of Benjamini and Hochberg for conversion to a false discovery rate.
RNA isolation and real-time quantitative polymerase chain reaction (RT-qPCR)
Total RNA was extracted using TRIzol reagent (Invitrogen, city, state, USA), and reverse-transcribed into cDNA using the Reverse Transcription cDNA Kit (Osaka, city, Japan) according to the manufacturer’s protocol. The RT-qPCR kit (SYBR Premix EX Taq; Takara Dalian, Dalian, China) was performed on an ABI Prism 7500 real time PCR system (Applied Biosystems, Life Technologies, Carlsbad, CA, USA). Human GAPDH was used as a reference control. The PCR primers are listed in Supplementary Table 1. After the reaction, the collected PCR products were analyzed by 1% agarose gel electrophoresis. The images of Twist1 and GAPDH DNA running on the gel after the gel electrophoresis assay are shown in Supplementary Figure 6. Twist1 DNA (length = 225 bp) and GAPDH (length = 200 bp) were successfully separated by gel electrophoresis with good resolution. Basically, only one band was shown in each lane after PCR processing, which demonstrated the high reliability of qPCR assay performance and choosing GAPDH as the housekeeping gene in this study. In addition, our data are also consistent with other report results.
Notch antagonist assay
The dissociated cells were seeded at a density of 5 × 10⁴ cell/well in 24-well plates, and subsequently cultured for 7 d by renewing fresh medium supplemented with the Notch antagonist, N-[N-(3,5-difluorophenacetyl)-1-alanyl]-S-phenylglycine t-butyl ester (DAPT, 10 μM [a γ-secretase inhibitor], Selleck Chemicals, Houston, TX, USA) every 3 d. Because DAPT was dissolved in dimethyl sulfoxide (DMSO; Sigma), the cells treated with the indicated concentration of DMSO were set as controls. Then, the cells were collected for Western blot analysis.
Lentivirus transduction of cells with the NICD gene
The cDNAs encoding the notch intracellular domain (NICD) gene was cloned into the EF.v-CMV lentiviral vector according to the manufacturer’s instructions. The primer sequences for gene amplification are listed in Supplementary Table 2. After the construction, a total of 10,000 GSC cells were seeded in 12-well plates and incubated for 2 h at 37 °C prior to introduction with NICD-lentivirus in the medium containing 5 μg/mL of polybrene. Lentivirus vector-treated or non-treated cells were used as controls.
Lentivirus transduction of cells with Twist1 gene
The human Twist1 cDNA clone (GenBank ID BC036704) was purchased from the ATCC (city, state, USA). The open reading frame (ORF) was amplified with PCR primers: 5‘-cgccaccatgatgcaggacgtgtccagctcg-3’; and 5’-actagtgggacgcggacatggaccag-3’. The coding region of the full-length human Twist1 was inserted into pLenti-GFP to construct pLenti-Twist1. Viral packaging service was provided by Genechem (Shanghai, China). Lentivirus infection was performed using a kit (Genechem) according to the manufacturer’s instructions. Then, GSCs were co-cultured with viral suspensions for 48 h and cultured in normal medium for further analysis.
Cell transduction with Twist1-shRNA
Transduction of Twist1 short hairpin RNA (shRNA) sequences were designed using online RNAi design software. The non-coding RNA (ncRNA) with the same bases served as controls. The shRNA and ncRNA oligos are listed in Supplementary Table 3. Construction of the lentiviral vector, pLKO.1, with Twist1-shRNA or ncRNA was performed according to the manufacturer’s instructions. Human embryonic kidney cells (HEK293FT) were co-transfected with the shRNA lentiviral plasmid (pLKO.1-puro) and Vira Power Lentiviral packaging mix (pLP1, pLP2, pLP-VSV-G; Life Technologies) using Lipofectamine 2000 (Invitrogen). After transfection for 48 h, the lentiviruses were harvested, tittered, and stored at −80°C. GSC2, GSC2R, GSC3, GSC3R, GSC4, and GSC4R were transduced with Twist1-shRNA or ncRNA lentiviruses. Tumor spheres were dissociated into single cells to increase the transduction efficiency and uniformity. After transduction with lentivirus for 24 h, cells were washed and cultured for an additional 2 d with NSC medium. The resulting cells were collected and analyzed for Twist expression by RT-PCR analysis and Western blotting assays.
Cell proliferation assay
Primary or treated neurospheres were harvested and mechanically dissociated into single cells. The Twist1 lentivirus-transduced GSCs were treated with DAPT for 72 h before performing the cell proliferation assay. Briefly, the cells were seeded at 5 × 10⁴ cells/well in 24-well plates and cultured for a total of 7 d. The cell number was counted every day using a hemocytometer. The experiment was performed in triplicate. The cell doubling time was calculated using GraphPad Prism 8 software with exponential equations and exponential growth patterns, and the data are shown in the supporting information (Supplementary Figures 7 and 8).
Transwell invasion assay
The transwell invasion assay was performed using 24-well transwell inserts (diameter 8 mm; Corning, NY, USA) precoated with Matrigel (60-80 μL; Corning) on the upper surface of the polycarbonic membrane (pore size, 8 μm). Briefly, the dissociated cells were seeded at a density of 5 × 10⁴ cells/insert in the upper chambers in 200 μL of EC medium. The lower compartments were filled with 500 μL of NSC medium, as indicated. After incubation for 48 h at 37°C, the cells migrating to the lower chambers were harvested and counted under a microscope (Nikon, Tokyo, Japan).
Western blot analysis
Cells were collected and lysed in RIPA buffer on ice for 30 min. The total protein concentration was determined using the BCA Protein Assay Kit (Solarbio). Equal proteins were loaded and separated by gel electrophoresis, and transferred to PVDF membranes (Millipore), The membranes were incubated with the indicated primary antibodies overnight at 4 °C. The following primary antibodies were used: anti-NICD1 (NOTCH intracellular domain 1; Cell Signaling and Technology, Boston, MA, USA); anti-HES1 (Abcam, Cambridge, MA, USA); anti-Twist1 (Abcam); and anti-β-Actin (Zhongshan Golden Bridge Biotechnology, city, China). Then, horseradish peroxidase (HRP)-conjugated goat anti-mouse or anti-rabbit IgG antibodies (1:2000; Zhongshan Golden Bridge Biotechnology) were added and incubated for additional 2 h. The immunocomplex on the membrane was visualized under an Image Quant LAS 4000 mini (GE, city, state, USA) with HRP substrate luminol reagent and peroxide solution.
Luciferase reporter construction
The full-length Twist1 promoter was amplified from the genomic Twist1 plasmid using the forward primer, 5′-TGCCACGTTTTGTTTCCAAG-3′, and reverse primer, 5′-AGGTGTCTGAGAGTTGGGC-3′. Then, the PCR product was digested with enzymes (NheI and HindIII) and constructed into the pGL-3 vector with firefly luciferase reporter gene (Promega, city, state, country). The positive clone was designated as the Twist1-luc reporter plasmid. To generate the Twist1 −1432/−1426 mutant, the forward primer, 5′-AAGGTCCTCAGCTTG TTAACAGGGCAGGAGTTCGAGACGC-3′, and reverse primer, 5′-GCGTCTCGAACTCCTGCCCTGTTAACAAGCTGAGGACCTT-3′, were used. Site-directed mutagenesis was performed using the QuickChange Site-directed Mutagenesis Kit (Stratagene, La Jolla, CA, USA). All constructed plasmids were subjected to DNA sequencing to confirm that no PCR artifacts were generated.
Plasmid transfection and luciferase assay
The GSC3R cells were prepared at a density of 5×10³ cells/well in 12-well plates and co-transfected with Twist1-luc reporter plasmids (500 ng/well) and 3XFlag NICD expression plasmid by Lipofectamine 2000. After 48 h of transfection, the cells were lysed, washed twice with ice-cold PBS, and resuspended with a lysis buffer (Promega). The firefly luciferase activity in the lysed solution was determined by luminescence measurement with luciferin, and obtained as an absolute value of the bioluminescent intensity.
Chromatin immunoprecipitation (CHIP) assay
The CHIP assay was performed using a kit (Millipore) according to the manufacturer’s protocol. The primer sequences for Twist1 promoter were as follows: forward, 5′-ACCCAGAAAGGGGCACTTG-3′; and reverse, 5′-GGCAATTCTGGGTCC GGA-3′. The 180-bp PCR product was quantified by real time PCR, as previously described [51].
Intracranially glioma-xenografted mouse model
Four-week old female immunocompromised nude mice were maintained in the Experimental Animal Center at the Sixth Medical Center (Chinese PLA General Hospital) in a specific pathogen-free environment. All of the animal experiments reported herein were carried out in accordance with the approved guidelines and approved by the Committee on the Animal Care and Use of Sixth Medical Center (Chinese PLA General Hospital). Mice were anaesthetized, placed in a stereotactic frame (RWD Life Science, city, China). Then, 5 ×10⁵ luciferase-NICD- or luciferase-NICD-shTwist1-transfected GSC3R in 10 μL of PBS were injected intracranially into the caudate nucleus of mice at a rate of 0.5 μL/min using a guide-screw system (n = 10 for each group). Follow the injection, the needle remained at the injection site for at least 5 min before removal. Bioluminescence monitoring of tumor growth in mice was performed 8 d after tumor implantation by intraperitoneal injection of 15 mg/mL of D-luciferin into anesthetized mice and imaging on the IVIS Spectrum Live Imaging System (Tianjin Medical University, city, China). Images were analyzed using Live Image 4.4 software. After the mice were sacrificed, the tumors were collected and the Twist1 mRNA levels were detected using RT-qPCR.
Statistical analysis
All experiments were carried out at least in triplicate and data in this study are presented as the mean ± SD. Independent two-tailed Student’s t-test or a two-way analysis of variance (ANOVA) was used to assess statistical significance of the results (*: P < 0.05, **: P < 0.01, and ***: P < 0.001).
Supplementary Materials
Conflicts of Interest
The authors declare no conflicts of interest.
Funding
This work was supported by grants from the National Natural Science Foundation of China (81572899) and Innovation Cultivating Foundation of The Sixth Medical Center of PLA General Hospital (CXPY201907).
References
- 1. Phillips HS, Kharbanda S, Chen R, Forrest WF, Soriano RH, Wu TD, Misra A, Nigro JM, Colman H, Soroceanu L, Williams PM, Modrusan Z, Feuerstein BG, Aldape K. Molecular subclasses of high-grade glioma predict prognosis, delineate a pattern of disease progression, and resemble stages in neurogenesis. Cancer Cell. 2006; 9:157–73. https://doi.org/10.1016/j.ccr.2006.02.019 [PubMed]
- 2. Belhadj Z, Zhan C, Ying M, Wei X, Xie C, Yan Z, Lu W. Multifunctional targeted liposomal drug delivery for efficient glioblastoma treatment. Oncotarget. 2017; 8:66889–900. https://doi.org/10.18632/oncotarget.17976 [PubMed]
- 3. Bi WL, Beroukhim R. Beating the odds: extreme long-term survival with glioblastoma. Neuro Oncol. 2014; 16:1159–60. https://doi.org/10.1093/neuonc/nou166 [PubMed]
- 4. Ostrom QT, Gittleman H, Fulop J, Liu M, Blanda R, Kromer C, Wolinsky Y, Kruchko C, Barnholtz-Sloan JS. CBTRUS Statistical Report: Primary Brain and Central Nervous System Tumors Diagnosed in the United States in 2008-2012. Neuro Oncol. 2015; 17 Suppl 4:iv1–iv62. https://doi.org/10.1093/neuonc/nov189 [PubMed]
- 5. Messaoudi K, Clavreul A, Lagarce F. Toward an effective strategy in glioblastoma treatment. Part I: resistance mechanisms and strategies to overcome resistance of glioblastoma to temozolomide. Drug Discov Today. 2015; 20:899–905. https://doi.org/10.1016/j.drudis.2015.02.011 [PubMed]
- 6. Galli R, Binda E, Orfanelli U, Cipelletti B, Gritti A, De Vitis S, Fiocco R, Foroni C, Dimeco F, Vescovi A. Isolation and characterization of tumorigenic, stem-like neural precursors from human glioblastoma. Cancer Res. 2004; 64:7011–21. https://doi.org/10.1158/0008-5472.CAN-04-1364 [PubMed]
- 7. Hemmati HD, Nakano I, Lazareff JA, Masterman-Smith M, Geschwind DH, Bronner-Fraser M, Kornblum HI. Cancerous stem cells can arise from pediatric brain tumors. Proc Natl Acad Sci USA. 2003; 100:15178–83. https://doi.org/10.1073/pnas.2036535100 [PubMed]
- 8. Reya T, Morrison SJ, Clarke MF, Weissman IL. Stem cells, cancer, and cancer stem cells. Nature. 2001; 414:105–11. https://doi.org/10.1038/35102167 [PubMed]
- 9. Gao F, Zhang Q, Zheng MH, Liu HL, Hu YY, Zhang P, Zhang ZP, Qin HY, Feng L, Wang L, Han H, Ju G. Transcription factor RBP-J-mediated signaling represses the differentiation of neural stem cells into intermediate neural progenitors. Mol Cell Neurosci. 2009; 40:442–50. https://doi.org/10.1016/j.mcn.2008.12.008 [PubMed]
- 10. Riddick G, Kotliarova S, Rodriguez V, Kim HS, Linkous A, Storaska AJ, Ahn S, Walling J, Belova G, Fine HA. A core regulatory circuit in glioblastoma stem cells links MAPK activation to a transcriptional program of neural stem cell identity. Sci Rep. 2017; 7:43605. https://doi.org/10.1038/srep43605 [PubMed]
- 11. Bao S, Wu Q, McLendon RE, Hao Y, Shi Q, Hjelmeland AB, Dewhirst MW, Bigner DD, Rich JN. Glioma stem cells promote radioresistance by preferential activation of the DNA damage response. Nature. 2006; 444:756–60. https://doi.org/10.1038/nature05236 [PubMed]
- 12. Angelopoulou E, Piperi C. Emerging role of plexins signaling in glioma progression and therapy. Cancer Lett. 2018; 414:81–87. https://doi.org/10.1016/j.canlet.2017.11.010 [PubMed]
- 13. Singh SK, Clarke ID, Terasaki M, Bonn VE, Hawkins C, Squire J, Dirks PB. Identification of a cancer stem cell in human brain tumors. Cancer Res. 2003; 63:5821–28. [PubMed]
- 14. Fortini ME. Notch signaling: the core pathway and its posttranslational regulation. Dev Cell. 2009; 16:633–47. https://doi.org/10.1016/j.devcel.2009.03.010 [PubMed]
- 15. Kopan R, Ilagan MX. The canonical notch signaling pathway: unfolding the activation mechanism. Cell. 2009; 137:216–33. https://doi.org/10.1016/j.cell.2009.03.045 [PubMed]
- 16. Su G, Chen H, Sun X. Baicalein suppresses non small cell lung cancer cell proliferation, invasion and notch signaling pathway. Cancer Biomark. 2018; 22:13–18. https://doi.org/10.3233/CBM-170673 [PubMed]
- 17. Lendahl U. A growing family of notch ligands. Bioessays. 1998; 20:103–07. https://doi.org/10.1002/(SICI)1521-1878(199802)20:2<103::AID-BIES1>3.0.CO;2-U [PubMed]
- 18. Liu J, Sato C, Cerletti M, Wagers A. Notch signaling in the regulation of stem cell self-renewal and differentiation. Curr Top Dev Biol. 2010; 92:367–409. https://doi.org/10.1016/S0070-2153(10)92012-7 [PubMed]
- 19. Schroeter EH, Kisslinger JA, Kopan R. Notch-1 signalling requires ligand-induced proteolytic release of intracellular domain. Nature. 1998; 393:382–86. https://doi.org/10.1038/30756 [PubMed]
- 20. Tamura K, Taniguchi Y, Minoguchi S, Sakai T, Tun T, Furukawa T, Honjo T. Physical interaction between a novel domain of the receptor notch and the transcription factor RBP-J kappa/Su(H). Curr Biol. 1995; 5:1416–23. https://doi.org/10.1016/s0960-9822(95)00279-x [PubMed]
- 21. Louvi A, Artavanis-Tsakonas S. Notch signalling in vertebrate neural development. Nat Rev Neurosci. 2006; 7:93–102. https://doi.org/10.1038/nrn1847 [PubMed]
- 22. Noisa P, Lund C, Kanduri K, Lund R, Lähdesmäki H, Lahesmaa R, Lundin K, Chokechuwattanalert H, Otonkoski T, Tuuri T, Raivio T. Notch signaling regulates the differentiation of neural crest from human pluripotent stem cells. J Cell Sci. 2014; 127:2083–94. https://doi.org/10.1242/jcs.145755 [PubMed]
- 23. Reedijk M, Odorcic S, Zhang H, Chetty R, Tennert C, Dickson BC, Lockwood G, Gallinger S, Egan SE. Activation of notch signaling in human colon adenocarcinoma. Int J Oncol. 2008; 33:1223–29. https://doi.org/10.3892/ijo_00000112 [PubMed]
- 24. Isenmann S, Arthur A, Zannettino AC, Turner JL, Shi S, Glackin CA, Gronthos S. TWIST family of basic helix-loop-helix transcription factors mediate human mesenchymal stem cell growth and commitment. Stem Cells. 2009; 27:2457–68. https://doi.org/10.1002/stem.181 [PubMed]
- 25. Hjiantoniou E, Iseki S, Uney JB, Phylactou LA. DNazyme-mediated cleavage of Twist transcripts and increase in cellular apoptosis. Biochem Biophys Res Commun. 2003; 300:178–81. https://doi.org/10.1016/s0006-291x(02)02804-8 [PubMed]
- 26. Liu X, Ma Y, Li R, Guo D, Wang N, Zhao Y, Yin J, Ren Q, Lin Y, Ma X. Niche TWIST1 is critical for maintaining normal hematopoiesis and impeding leukemia progression. Haematologica. 2018; 103:1969–79. https://doi.org/10.3324/haematol.2018.190652 [PubMed]
- 27. Lee KW, Yeo SY, Sung CO, Kim SH. Twist1 is a key regulator of cancer-associated fibroblasts. Cancer Res. 2015; 75:73–85. https://doi.org/10.1158/0008-5472.CAN-14-0350 [PubMed]
- 28. Maestro R, Dei Tos AP, Hamamori Y, Krasnokutsky S, Sartorelli V, Kedes L, Doglioni C, Beach DH, Hannon GJ. Twist is a potential oncogene that inhibits apoptosis. Genes Dev. 1999; 13:2207–17. https://doi.org/10.1101/gad.13.17.2207 [PubMed]
- 29. Valsesia-Wittmann S, Magdeleine M, Dupasquier S, Garin E, Jallas AC, Combaret V, Krause A, Leissner P, Puisieux A. Oncogenic cooperation between h-twist and n-myc overrides failsafe programs in cancer cells. Cancer Cell. 2004; 6:625–30. https://doi.org/10.1016/j.ccr.2004.09.033 [PubMed]
- 30. Goodnough LH, Chang AT, Treloar C, Yang J, Scacheri PC, Atit RP. Twist1 mediates repression of chondrogenesis by β-catenin to promote cranial bone progenitor specification. Development. 2012; 139:4428–38. https://doi.org/10.1242/dev.081679 [PubMed]
- 31. Mikheev AM, Mikheeva SA, Tokita M, Severs LJ, Rostomily RC. Twist1 mediated regulation of glioma tumorigenicity is dependent on mode of mouse neural progenitor transformation. Oncotarget. 2017; 8:107716–29. https://doi.org/10.18632/oncotarget.22593 [PubMed]
- 32. Mikheeva SA, Mikheev AM, Petit A, Beyer R, Oxford RG, Khorasani L, Maxwell JP, Glackin CA, Wakimoto H, González-Herrero I, Sánchez-García I, Silber JR, Horner PJ, Rostomily RC. TWIST1 promotes invasion through mesenchymal change in human glioblastoma. Mol Cancer. 2010; 9:194. https://doi.org/10.1186/1476-4598-9-194 [PubMed]
- 33. Elias MC, Tozer KR, Silber JR, Mikheeva S, Deng M, Morrison RS, Manning TC, Silbergeld DL, Glackin CA, Reh TA, Rostomily RC. TWIST is expressed in human gliomas and promotes invasion. Neoplasia. 2005; 7:824–37. https://doi.org/10.1593/neo.04352 [PubMed]
- 34. Saito N, Fu J, Zheng S, Yao J, Wang S, Liu DD, Yuan Y, Sulman EP, Lang FF, Colman H, Verhaak RG, Yung WK, Koul D. A high notch pathway activation predicts response to γ secretase inhibitors in proneural subtype of glioma tumor-initiating cells. Stem Cells. 2014; 32:301–12. https://doi.org/10.1002/stem.1528 [PubMed]
- 35. Hu YY, Zheng MH, Cheng G, Li L, Liang L, Gao F, Wei YN, Fu LA, Han H. Notch signaling contributes to the maintenance of both normal neural stem cells and patient-derived glioma stem cells. BMC Cancer. 2011; 11:82. https://doi.org/10.1186/1471-2407-11-82 [PubMed]
- 36. Kageyama R, Ohtsuka T. The notch-hes pathway in mammalian neural development. Cell Res. 1999; 9:179–88. https://doi.org/10.1038/sj.cr.7290016 [PubMed]
- 37. Teodorczyk M, Schmidt MH. Notching on cancer’s door: notch signaling in brain tumors. Front Oncol. 2015; 4:341. https://doi.org/10.3389/fonc.2014.00341 [PubMed]
- 38. Bazzoni R, Bentivegna A. Role of notch signaling pathway in glioblastoma pathogenesis. Cancers (Basel). 2019; 11:292. https://doi.org/10.3390/cancers11030292 [PubMed]
- 39. Wu X, Fleming A, Ricketts T, Pavel M, Virgin H, Menzies FM, Rubinsztein DC. Autophagy regulates notch degradation and modulates stem cell development and neurogenesis. Nat Commun. 2016; 7:10533. https://doi.org/10.1038/ncomms10533 [PubMed]
- 40. Zhang XP, Zheng G, Zou L, Liu HL, Hou LH, Zhou P, Yin DD, Zheng QJ, Liang L, Zhang SZ, Feng L, Yao LB, Yang AG, et al. Notch activation promotes cell proliferation and the formation of neural stem cell-like colonies in human glioma cells. Mol Cell Biochem. 2008; 307:101–08. https://doi.org/10.1007/s11010-007-9589-0 [PubMed]
- 41. Howard TD, Paznekas WA, Green ED, Chiang LC, Ma N, Ortiz de Luna RI, Garcia Delgado C, Gonzalez-Ramos M, Kline AD, Jabs EW. Mutations in TWIST, a basic helix-loop-helix transcription factor, in saethre-chotzen syndrome. Nat Genet. 1997; 15:36–41. https://doi.org/10.1038/ng0197-36 [PubMed]
- 42. Kalluri R, Weinberg RA. The basics of epithelial-mesenchymal transition. J Clin Invest. 2009; 119:1420–28. https://doi.org/10.1172/JCI39104 [PubMed]
- 43. Yang J, Mani SA, Donaher JL, Ramaswamy S, Itzykson RA, Come C, Savagner P, Gitelman I, Richardson A, Weinberg RA. Twist, a master regulator of morphogenesis, plays an essential role in tumor metastasis. Cell. 2004; 117:927–39. https://doi.org/10.1016/j.cell.2004.06.006 [PubMed]
- 44. Zhu QQ, Ma C, Wang Q, Song Y, Lv T. The role of TWIST1 in epithelial-mesenchymal transition and cancers. Tumour Biol. 2016; 37:185–97. https://doi.org/10.1007/s13277-015-4450-7 [PubMed]
- 45. Xu Y, Qin L, Sun T, Wu H, He T, Yang Z, Mo Q, Liao L, Xu J. Twist1 promotes breast cancer invasion and metastasis by silencing Foxa1 expression. Oncogene. 2017; 36:1157–66. https://doi.org/10.1038/onc.2016.286 [PubMed]
- 46. Mahmoud MM, Kim HR, Xing R, Hsiao S, Mammoto A, Chen J, Serbanovic-Canic J, Feng S, Bowden NP, Maguire R, Ariaans M, Francis SE, Weinberg PD, et al. TWIST1 integrates endothelial responses to flow in vascular dysfunction and atherosclerosis. Circ Res. 2016; 119:450–62. https://doi.org/10.1161/CIRCRESAHA.116.308870 [PubMed]
- 47. Mammoto T, Jiang A, Jiang E, Mammoto A. Role of Twist1 phosphorylation in angiogenesis and pulmonary fibrosis. Am J Respir Cell Mol Biol. 2016; 55:633–44. https://doi.org/10.1165/rcmb.2016-0012OC [PubMed]
- 48. Kubelt C, Hattermann K, Sebens S, Mehdorn HM, Held-Feindt J. Epithelial-to-mesenchymal transition in paired human primary and recurrent glioblastomas. Int J Oncol. 2015; 46:2515–25. https://doi.org/10.3892/ijo.2015.2944 [PubMed]
- 49. Hu J, Shi B, Liu X, Jiang M, Yuan C, Jiang B, Song Y, Zeng Y, Wang G. The activation of toll-like receptor 4 reverses tumor differentiation in human glioma U251 cells via notch pathway. Int Immunopharmacol. 2018; 64:33–41. https://doi.org/10.1016/j.intimp.2018.08.019 [PubMed]
- 50. Hsu KW, Hsieh RH, Huang KH, Fen-Yau Li A, Chi CW, Wang TY, Tseng MJ, Wu KJ, Yeh TS. Activation of the Notch1/STAT3/twist signaling axis promotes gastric cancer progression. Carcinogenesis. 2012; 33:1459–67. https://doi.org/10.1093/carcin/bgs165 [PubMed]
- 51. Tian Y, Xu Y, Fu Q, Chang M, Wang Y, Shang X, Wan C, Marymont JV, Dong Y. Notch inhibits chondrogenic differentiation of mesenchymal progenitor cells by targeting Twist1. Mol Cell Endocrinol. 2015; 403:30–8. https://doi.org/10.1016/j.mce.2015.01.015 [PubMed]
- 52. Bonyadi Rad E, Hammerlindl H, Wels C, Popper U, Ravindran Menon D, Breiteneder H, Kitzwoegerer M, Hafner C, Herlyn M, Bergler H, Schaider H. Notch4 signaling induces a mesenchymal-epithelial-like transition in melanoma cells to suppress Malignant behaviors. Cancer Res. 2016; 76:1690–97. https://doi.org/10.1158/0008-5472.CAN-15-1722 [PubMed]
- 53. Nurnberg ST, Guerraty MA, Wirka RC, Rao HS, Pjanic M, Norton S, Serrano F, Perisic L, Elwyn S, Pluta J, Zhao W, Testa S, Park Y, et al. Genomic profiling of human vascular cells identifies TWIST1 as a causal gene for common vascular diseases. PLoS Genet. 2020; 16:e1008538. https://doi.org/10.1371/journal.pgen.1008538 [PubMed]