


Introduction
With the aging of society, the prevalence of chronic inflammatory diseases, including degenerative disc disease, is increasing [1]. Intervertebral disc degeneration (IDD) is closely associated with age, load-bearing, trauma, genetics, inflammation, and tissue injury induced by oxidative stress [2]. IDD is an important factor in lower back pain, which is a common clinical condition that causes long-term pain and, potentially, the inability to work; it seriously affects life quality, and increases a major social and economic strain on families and economy [3, 4]. Existing drugs serving as suggested treatments for the management of IDD don’t focus on its pathogenesis but the symptoms, and some side effects are triggered for long-term use causing frequent recurrence and gradual aggravation [5]. Therefore, clinical management of IDD is still lacking. It is indispensable and critical to find new prognostic factors and therapeutic targets for IDD so as to early recognize individuals who are at an elevated risk of IDD. There is growing proof from the numerous advancements in IDD study that it is a complex, highly heterogeneous disorder that includes genetic changes [6]. It follows that early detection and effective avoidance of high-risk individuals from a genetic viewpoint will have a significant impact on the epidemiological management of IDD.
Cuproptosis is a copper-triggered way of mitochondrial cell death depending on mitochondrial respiration, which happens through copper combining directly with the lipoylated components of the tricarboxylic acid (TCA) cycle, and then results in the aggregation of lipoylated proteins and the subsequent loss of iron-sulphur cluster proteins, resulting in proteotoxic stress and ultimately cell death [7]. As a distinct cell death mechanism, cuproptosis needs numerous copper-regulatory proteins including FDX1, DBT, GCSH, LIPT1, DLST, LIAS, DLD, DLAT, ATP7A, ATP7B, MTF1, GLS, PDHA1, PDHB, SLC31A1, and CDKN2A to cooperate together [7, 8]. Abnormalities in copper metabolism can trigger multiple disorders such as obesity [9], glioblastoma [10], acute myeloid leukaemia [11], type 2 diabetes [12], and various malignancies [13]. With the further study on copper, researchers have found that the concentration of copper element shows significant differences between the tissues of IDD and normal controls [14], and copper could result in severe disc degeneration [15]. Therefore, we hypothesize that cuproptosis may influence the pathogenesis of IDD by modifying the transcript level of genes related to cuproptosis. To date, there exist no research on the roles of cuproptosis modulators in IDD.
On the basis of the GSE124272 [16] and GSE150408 [17] datasets, we conducted a thorough assessment of the functions of cuproptosis regulators in the identification of IDD subtypes and diagnostic biomarkers in this research. Based on eight important cuproptosis modulators, including LIPT1, GCSH, DLST, DLAT, PDHB, ATP7A, ATP7B, and MTF1, we created an IDD susceptibility prediction gene model. We discovered that the model was helpful for offering patients predictive value clinically. These cuproptosis regulators were further confirmed by our RT-qPCR assessments, which showed compatible expression levels with the bioinformatics findings. Thereafter, we identified two different cuproptosis patterns that were closely correlated with activated CD4 T cell, activated B cell, activated CD8 T cell, natural killer cell, immature B cell, and T follicular helper cell immunity, demonstrating that cuproptosis patterns may be employed to recognize IDD and offer following therapy plans. Figure 1 displayed the flowchart of study design and process.
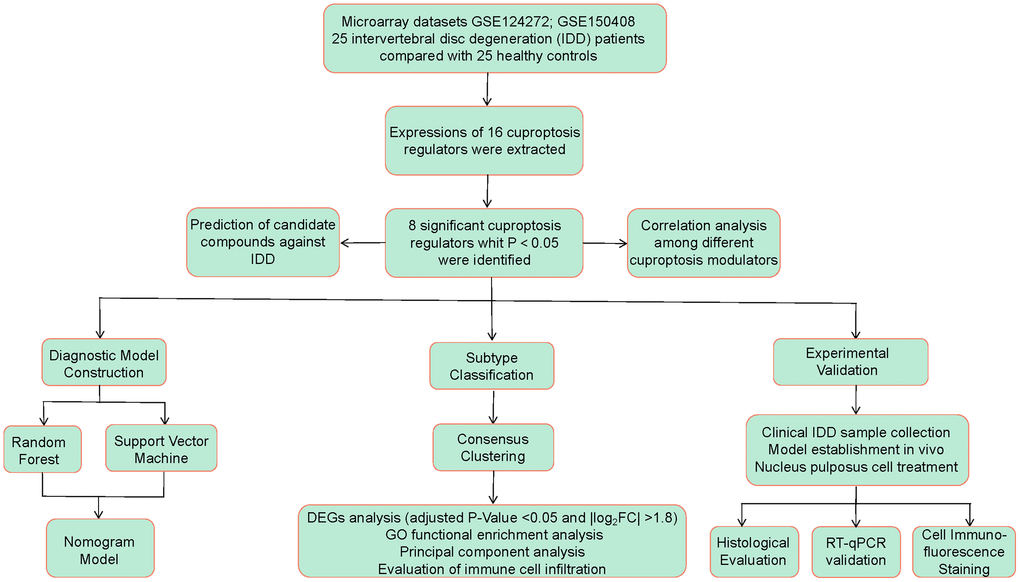
Figure 1. Flow chart of the study design.
Materials and Methods
Bioinformatics analysis
Retrieval of IDD samples
Using the GEO database (http://www.ncbi.nlm.nih.gov/geo/), we obtained whole blood samples of IDD patients. “Intervertebral Disc Degeneration”, “Whole Blood”, “Gene expression”, “Microarray” were the search phrases, and the datasets were chosen according to the eligibility principles: the dataset has at least 10 samples, containing at least 5 cases respectively in the control and IDD groups, which also provides both raw data and series matrix file available to download. Finally, the datasets, GSE124272 [16] and GSE150408 [17] were selected, which fully satisfied our requirements. We selected 8 cases of control group and 8 cases of IDD group from the dataset of GSE124272 as well as 17 cases of IDD and 17 controls in GSE150408 dataset.
Data collection
To convert microarray probes to symbols, we utilized the annotated R package (v4.1.2) downloaded from Bioconductor (http://bioconductor.org/). Following data preparation, the two datasets were merged via removing bath effects in virtue of SVA package using ComBat function. Thereafter, we obtained the final dataset containing 25 controls and 25 IDD cases. A difference analysis of control and IDD cases was conducted using Limma package to determine differential cuproptosis regulators. Significant cuproptosis regulators were selected based on the following screening criteria: P-Value < 0.05 and |log2 fold change (FC)| >0 [18]. We then analyzed the enrichment results of GO and KEGG using the R package “clusterProfiler” with the adjusted P-value threshold of 0.05 so as to investigate the possible mechanism of the cuproptosis modulators in IDD.
Model establishment
To analyze the occurrence of IDD, we constructed random forest (RF) and support vector machine (SVM) models as training models, which were determined by “Reverse cumulative distribution of residual”, and “Boxplots of residual”. We built an RF model using the R package of “RandomForest” to select putative cuproptosis regulators with importance score (Mean Decrease Gini) >1. The number n in SVM model represented the number of cuproptosis regulators and every data dot was shown as a dot in an n-dimensional space. We then chose an ideal hyperplane that differentiated between the two groups of control and IDD [19]. Thereafter, the R package of “rms” was utilized to construct a nomogram model to evaluate the prevalence of IDD patients based on selective candidate cuproptosis regulators. Calibration curves were employed to determine how well the prediction values matched reality. Decision curve analysis (DCA) was performed to establish a clinical impact curve and determine if decisions based on the model benefited patients [20].
Subtype identification
Using consensus clustering relying on resampling algorithm, each member and its subcluster number were identified, validating the rationality of the clusters [20]. Based on significant cuproptosis regulators, the R package of “ConsensusClusterPlus” was utilized to identify different cuproptosis patterns using a consensus clustering approach [21].
GO enrichment analysis of differentially expressed genes between different cuproptosis clusters
Using the Limma package, we screened differentially expressed genes (DEGs) between different cuproptosis clusters according to a threshold of adjusted P-Value <0.05 and |log2FC| >1.8. Thereafter, GO analysis was conducted using the R package of “clusterProfiler” as to elucidate the underlying mechanism of DEGs in the process of IDD [22].
Cuproptosis score assessment
The cuproptosis score for each sample was calculated using principal component analysis (PCA), aiming to quantify the cuproptosis patterns. The cuproptosis score system was established according to the following formula: cuproptosis score = PC1i, where PC1 represented principal component 1, and i represented cuproptosis gene expression [23].
Immune cell infiltration assessment
The quantity of immune cell infiltration in IDD group samples was assessed using single sample gene set enrichment analysis (ssGSEA). To begin, ssGSEA was used to sequence the gene expression levels in the samples in order to generate a gene expression ranking. Thereafter, the expression levels of the significant cuproptosis modulators were then summed in the input dataset. We obtained the amount of immune cells in each sample based on the above analysis [24].
Prediction of candidate compounds against IDD
Protein-compound interaction prediction or candidate compound identification is one of the important elements of this study. Based on the significant cuproptosis genes, candidate compounds were screened via Enrichr [25] by searching DSigDB database [26], which has 22527 gene sets according to its accessible way through Enrichr under the Diseases/Drugs function [27].
Experimental validation
IDD model establishment
This experimental study was approved by the Ethics Committee of The First Affiliated Hospital of Guangzhou University of Chinese Medicine (No. TCMF1-2021026). All the experiments were performed in accordance with relevant ethical guidelines and regulations. Above study is reported in accordance with ARRIVE guidelines. We bought randomly divided 3-month-old wild type C57BL/6 mice into two groups: control (Con, n = 6), and IDD (n = 6). The animals were kept in a sterile environment with consistent light (12 hours/day), temperature (21~26°C), and humidity (41~70%) conditions, and were provided with adequate water and food. After 24 months, we obtained an IDD model of naturally aging mice according to a previous report [28].
Histological evaluation
Serial sections from L4/5 intervertebral discs of 5 μm thickness were taken from the midsagittal region for histological analysis. We performed hematoxylin-eosin (HE) and safranin O/green staining of the slices to observe histological changes in the intervertebral disc tissues from the different groups.
Nucleus pulposus tissue acquisition
The human nucleus pulposus (NP) tissues were collected from patients undergoing spine operations at our hospital. The relatively normal human lumbar NP tissues without severe IDD were collected from 3 patients (grade II), while the degenerated NP tissues were collected from 3 patients (grade V). The degenerated degree of the disc was graded by the Pfirrmann classification [29]. All study procedures were approved by the Ethics Committee of The First Affiliated Hospital of Guangzhou University of Chinese Medicine (No. JY2022-122). The informed consents were obtained from patients. All methods were carried out in accordance with the Declaration of Helsinki for human participants.
Mice from the two groups were sacrificed after anesthesia, and then soaked in 75% ethanol for 5 min. Mice were placed in a prone position on an ultra-clean table with skin cut along the midline of the back, muscle tissue stripped off, and spine exposed. After the removal of surrounding tissues including muscle, spinal cord and nerve tissue, the vertebral body and posterior complex structure were separated. The L4/5 vertebrae-disc structure was soaked in sterile HBSS liquid and then nucleus pulposus tissue was isolated according to the morphological difference of the cells with sterile microforceps and scalpels under microscope [30].
Mouse NP cell culture and treatment
We obtained nucleus pulposus tissues from mice via digestion of 0.25% trypsin (Gibco, Waltham, MA, USA) for half an hour and 0.25% type II collagenase (Sigma, St. Louis, MO, USA) for 8 hours at 37°C. After centrifugation, NP cells were harvested and incubated in complete DMEM/F12 medium with 1% penicillin-streptomycin and 15% fetal bovine serum, under hypoxic conditions (5% CO2 in a humidified incubator at 37°C). Second-generation NP cells were collected for subsequent experiments to prevent their differentiation [30, 31].
Cell counting Kit-8 assay
The mouse NP cells were treated with tert-butyl hydrogen peroxide (TBHP, Macklin, Shanghai, China) in the concentration gradients of 0, 50, 100, 150, 200, and 250 μmol/L for 2, 4, and 6 h to establish the IDD cell model in vitro. Then, Cell Counting Kit-8 (GK10001, GlpBio, Montclair, CA, USA) assay was conducted to detect cell viability in different groups.
Cell immunofluorescence staining
Mouse NP cells were cultured in 24-well plates (4 × 10⁴ cells/well) and fixed for 15–20 min with 4% paraformaldehyde. After washing with PBS containing 0.1% Tween-20 (PBST), the samples were incubated with 0.2% Triton X-100 for 15 min and then blocked with QuickBlock™ Blocking Buffer for Immunol Staining (P0260) for 30–60 min. ACAN (13880-1-AP) was purchased from Proteintech (Wuhan, China). The cells were treated with primary antibodies against ACAN (1:100) overnight at 4°C. Secondary antibodies Goat Anti-Mouse IgG H&L (Alexa Fluor® 488) (ab150113) coupled with fluorescein isothiocyanate were then incubated at 37°C for 1 h. Fluorescence images were obtained by fluorescence microscopy (Leica Microsystems, Inc., Buffalo Grove, IL, USA).
RNA extraction and RT-qPCR validation
Human NP tissues as well as mouse NP tissues and cells in this study were collected, and then total RNA from the samples was extracted by TRIzol reagent. Subsequently, a cDNA synthesis kit (Takara Inc., Shiga, Japan) was used to finish retrotranscription of 1 μg total RNA. 20 μL SYBR Green qPCR SuperMix (Takara Inc.) was adopted for detecting cuproptosis gene cDNAs by RT-qPCR machine (QuantStudio 3 and 5 Real-Time PCR Systems). The final gene amplification was performed under the thermal cycling conditions: 95°C for 30 s, 40 cycles of 95°C for 5 s, and a final step of 60°C for 30 s. Quantitative analysis was conducted using the 2ΔΔCT method for calculation of the relative expression of each gene. The gene-related detection primers of cuproptosis modulators were supplied by Shanghai Sangon Biotechnology Co., Ltd., (Shanghai, China), as shown in Supplementary Table 1.
Statistical analysis
Linear regression analysis was used to evaluate the correlations among the significant cuproptosis genes. In bioinformatics analysis, Kruskal-Wallis tests were used to calculate the differences between groups, while Student’s t-tests were used for RT-qPCR analysis. All parametric data were estimated using two-tailed tests, with P-value of 0.05 being deemed statistically significant. The mean ± standard deviations were used to describe all results.
Availability of data and materials
All the data from the present study can be obtained from the first author on reasonable request. The datasets generated and analyzed during the current study are available in the Gene Expression Omnibus (GEO) repository, (GSE124272 and GSE150408).
Results
Identification of the 16 cuproptosis modulators in IDD
A total of 16 cuproptosis regulators (FDX1, DLD, LIAS, LIPT1, DLST, DLAT, DBT, GCSH, PDHA1, ATP7A, ATP7B, PDHB, SLC31A1, MTF1, GLS, CDKN2A) were screened according to difference analysis between the control and IDD groups. We finally filtrated 8 vital cuproptosis modulators (LIPT1, DLAT, PDHB, GCSH, DLST, ATP7A, ATP7B and MTF1), which were plotted in a heat map (Figure 2A). We noticed that the expressions of ATP7A, ATP7B and MTF1 were increased in IDD cases compared to controls, while the other significant cuproptosis regulators exhibited the opposite results (Figure 2B–2I). Moreover, we carried out GO and KEGG enrichment analyses to excavate the role of these vital cuproptosis modulators in IDD (Figure 2J, 2K). We observed that GO enrichment results including biological process (tricarboxylic acid metabolic process), cellular component (mitochondrial matrix), molecular function (ATPase activity) were the mainly enriched entries. Notably, KEGG enrichment analysis showed that Citrate cycle (TCA cycle) was one of the mainly enriched pathways. The detailed information of GO and KEGG enrichment analysis was shown in Supplementary Tables 2, 3.
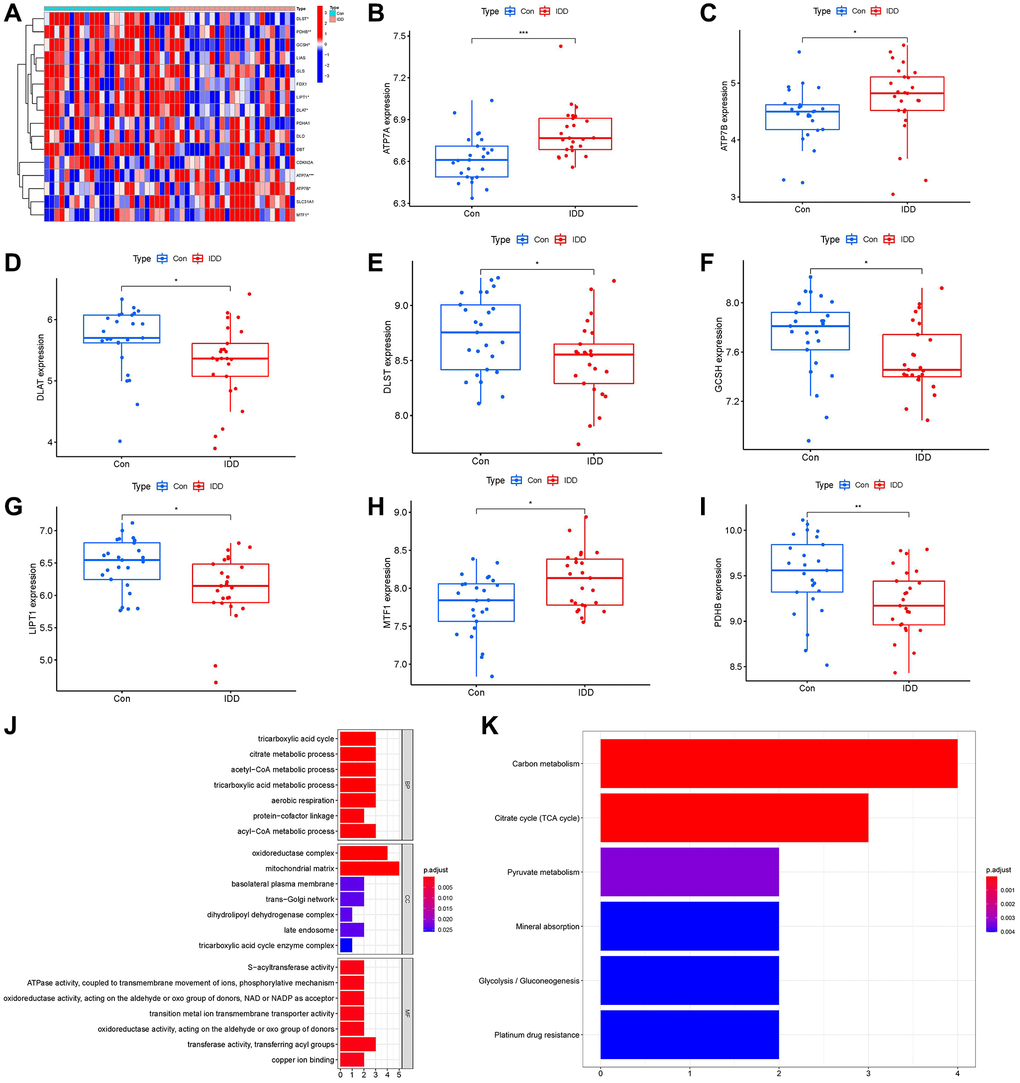
Figure 2. Identification of the 16 cuproptosis modulators in IDD. (A) Expression heat map of the 16 cuproptosis modulators in controls and IDD cases. (B–I) Differential expression boxplots of 8 significant cuproptosis modulators identified between controls and IDD cases. (J, K) GO and KEGG enrichment analysis based on the 8 significant cuproptosis modulators. *p < 0.05, **p < 0.01, and ***p < 0.001.
Correlation among cuproptosis regulators in IDD
We utilized linear regression analyses to investigate whether gene expression levels of cuproptosis modulators in IDD exhibit correlation with each other. There existed significantly positive correlations in the gene expression levels of MTF1-ATP7B, PDHB-DLAT, PDHB-DLST, DLAT-DLST, DLAT-GCSH, DLST-GCSH, PDHB-GCSH, DLAT-LIPT1, DLST-LIPT1, GCSH-LIPT1, and PDHB-LIPT1 in IDD cases (Figure 3A–3K), while the gene expression levels of ATP7B-DLST in IDD cases exhibited significantly negative correlation (Figure 3L). Thus, we demonstrated different correlations between different cuproptosis modulators in IDD.
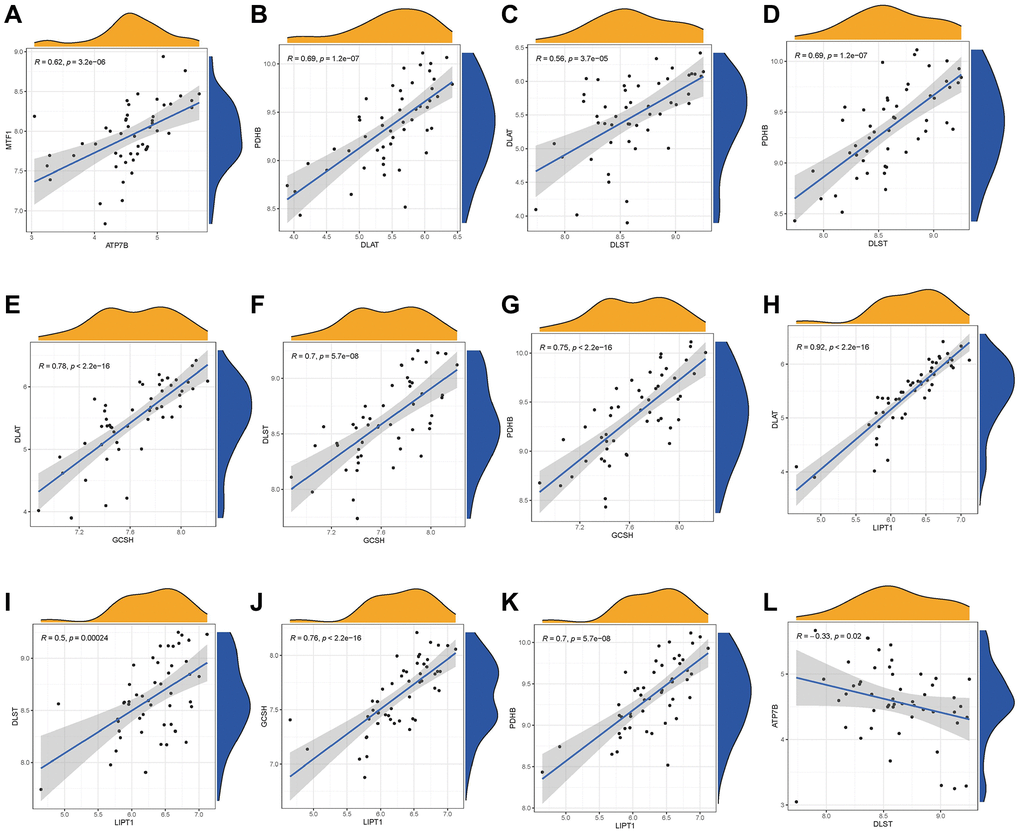
Figure 3. Correlation among cuproptosis modulators in IDD. There existed significantly positive correlations in the gene expression levels of MTF1-ATP7B, PDHB-DLAT, PDHB-DLST, DLAT-DLST, DLAT-GCSH, DLST-GCSH, PDHB-GCSH, DLAT-LIPT1, DLST-LIPT1, GCSH-LIPT1, and PDHB-LIPT1 in IDD cases (A–K), while the gene expression levels of ATP7B-DLST in IDD cases exhibited significantly negative correlation (L).
Establishment of the RF and SVM models
As shown in Figure 4A, 4B, reverse cumulative distribution of residual and boxplots of residual confirmed that the RF model had the smallest residuals. The majority of samples from the RF model had smaller residuals, which suggested that the RF model was superior to the SVM model. Thereafter, we determined the RF model to be the most suitable model for the prediction of IDD occurrence. Finally, we presented these 8 significant cuproptosis regulators after ranking them in order of importance score (Mean Decrease Gini) and selected 5 cuproptosis regulators (ATP7B, DLAT, MTF1, PDHB, GCSH) with importance score >1 as the candidate genes (Figure 4C).
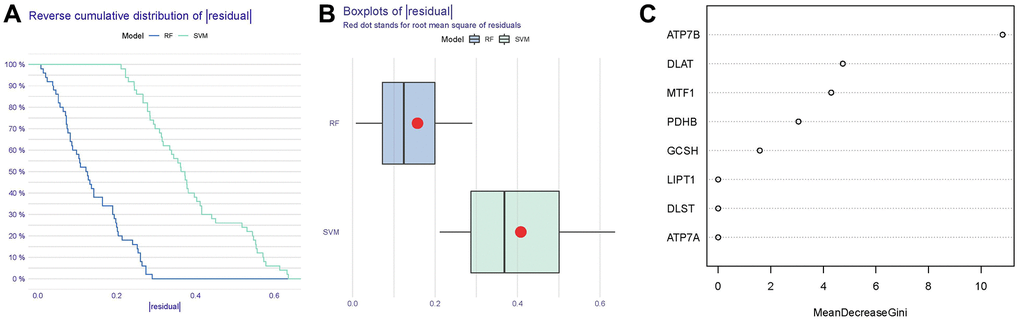
Figure 4. Establishment of the RF and SVM models. (A) Reverse cumulative distribution of residual was constructed to display the residual distribution of RF and SVM models. (B) Boxplots of residual were constructed to display the residual distribution of RF and SVM models. (C) The importance of the 8 cuproptosis modulators on the basis of the RF model.
Nomogram model construction
For the purpose of predicting the prevalence of IDD patients, we constructed a nomogram model of the five candidate cuproptosis regulators using the “rms” package in R (Figure 5A). We found that the nomogram model demonstrated high prediction accuracy based on calibration curves (Figure 5B). From 0 to 1, the red line in the DCA curve continued to be higher than the gray and black lines, indicating that IDD patients may benefit from judgments made using the nomogram model (Figure 5C). Additionally, we observed that the predictive capacity of the nomogram model was remarkable on the basis of the clinical impact curve (Figure 5D).
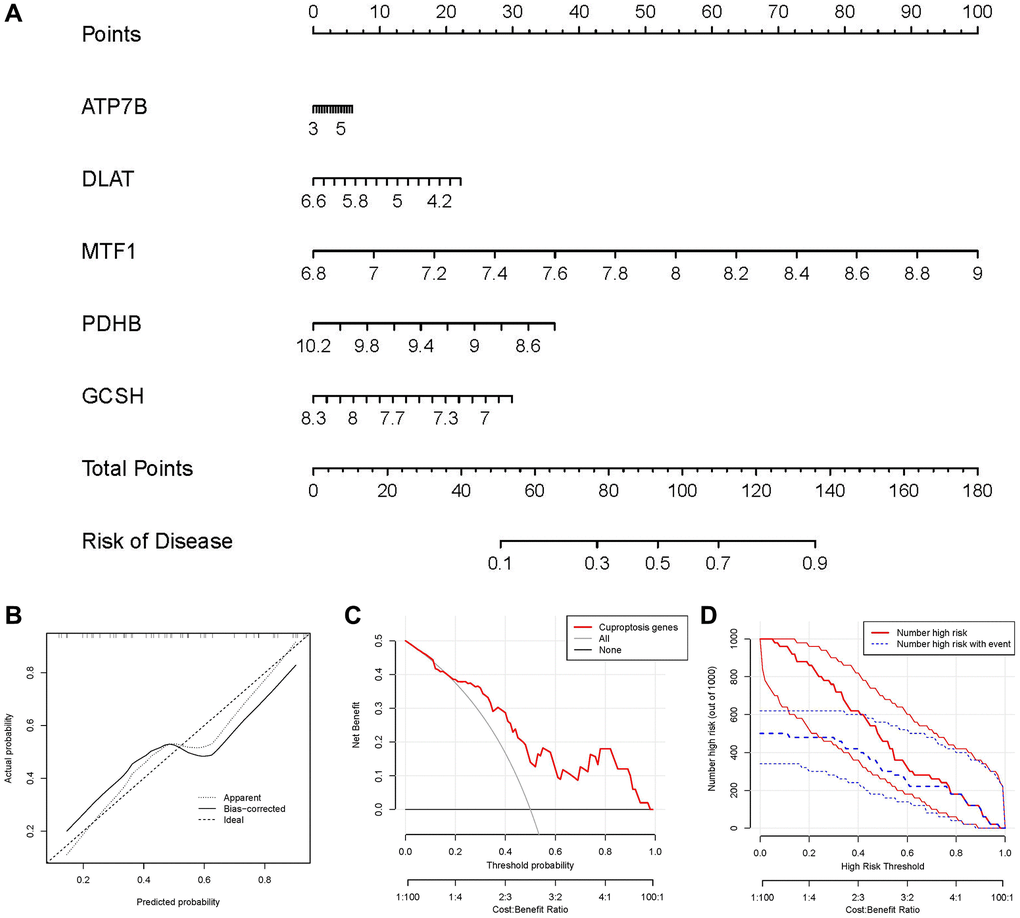
Figure 5. Establishment of the nomogram model. (A) The nomogram model was established on the basis of the 5 candidate cuproptosis modulators. (B) The calibration curve was utilized to evaluate the predictive accuracy of the nomogram model. (C) Decisions on the basis of this nomogram model may be beneficial to IDD patients. (D) The clinical impact curve was used to assess clinical impact of the nomogram model.
Recognition of two different cuproptosis clusters
Using the R package of “ConsensusClusterPlus”, we discovered two cuproptosis patterns (clusterA and clusterB) based on the 8 important cuproptosis regulators (Figure 6A–6D). ClusterA contained 19 samples, whereas clusterB had 6 samples. Thereafter, the differential expression levels of the 8 important cuproptosis modulators between the two clusters were clearly demonstrated in the heat map and boxplot. We noticed that the expression levels of LIPT1, GCSH, DLST, DLAT and PDHB in clusterA were higher than those in clusterB (Figure 6E, 6F). We screened totally 163 cuproptosis-associated DEGs between the two cuproptosis patterns, and we carried out GO enrichment analysis to excavate the role of these DEGs in IDD (Figure 6G). The detailed information of GO enrichment analysis was shown in Supplementary Table 4. Specifically, biological progresses included response to metal ion, notochord development, response to lead ion, regulation of syncytium formation by plasma membrane fusion and response to iron ion, etc. Cellular components included intermediate filament, intermediate filament cytoskeleton, rough endoplasmic reticulum, etc. Molecular functions included structural constituent of cytoskeleton, neuropeptide hormone activity, chloride channel inhibitor activity, structural molecule activity and conferring elasticity, etc.
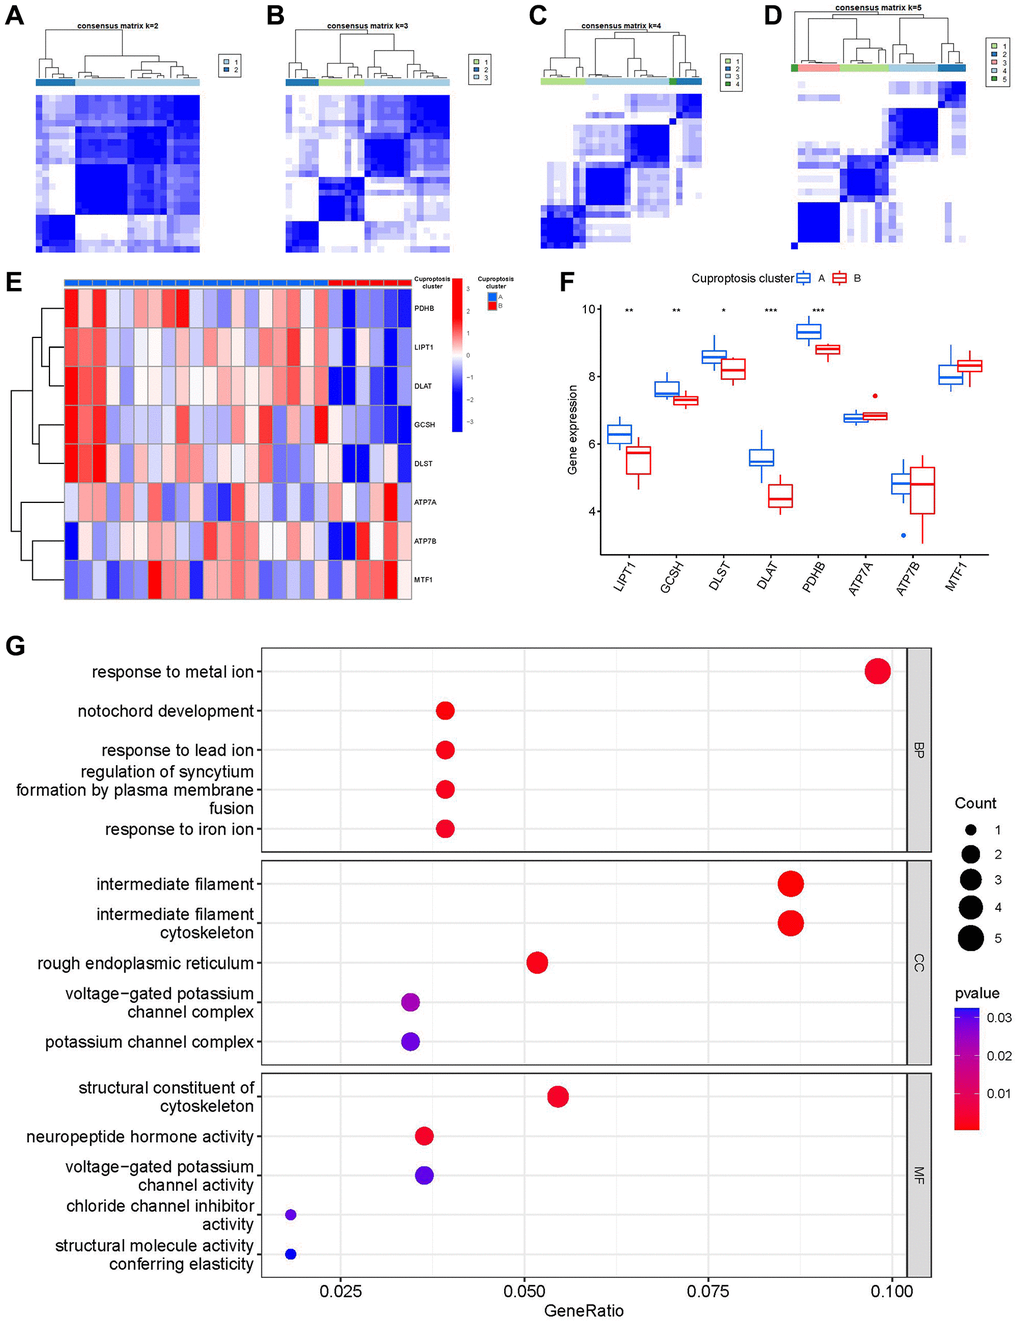
Figure 6. Consensus clustering of the 8 significant cuproptosis modulators in IDD. (A–D) Consensus matrices of the 8 significant cuproptosis modulators for k = 2–5. (E) Expression heat map of the 8 significant cuproptosis modulators in clusterA and clusterB. (F) Differential expression boxplot of the 8 significant cuproptosis modulators in clusterA and clusterB. (G) GO analysis that explores the potential mechanism underlying the effect of the 163 cuproptosis-related DEGs on the occurrence and development of IDD. *p < 0.05, **p < 0.01, and ***p < 0.001.
Then, we investigated the links between immune cells and 8 important cuproptosis regulators using ssGSEA to determine the immune cell abundance in IDD samples. We noticed a positive correlation between LIPT1 and many immune cells (Figure 7A). Between patients with high and low LIPT1 expressions, we examined the variations in immune cell infiltration. The findings revealed that patients with high LIPT1 expression intended to have a higher enhanced immune cell infiltration than patients with low LIPT1 expression (Figure 7B). We discovered that clusterA was correlated with activated B cell, activated CD8 T cell, activated CD4 T cell, immature B cell, natural killer T cell and T follicular helper cell immunity, while clusterB was linked to the immunity of natural killer cell (Figure 7C).
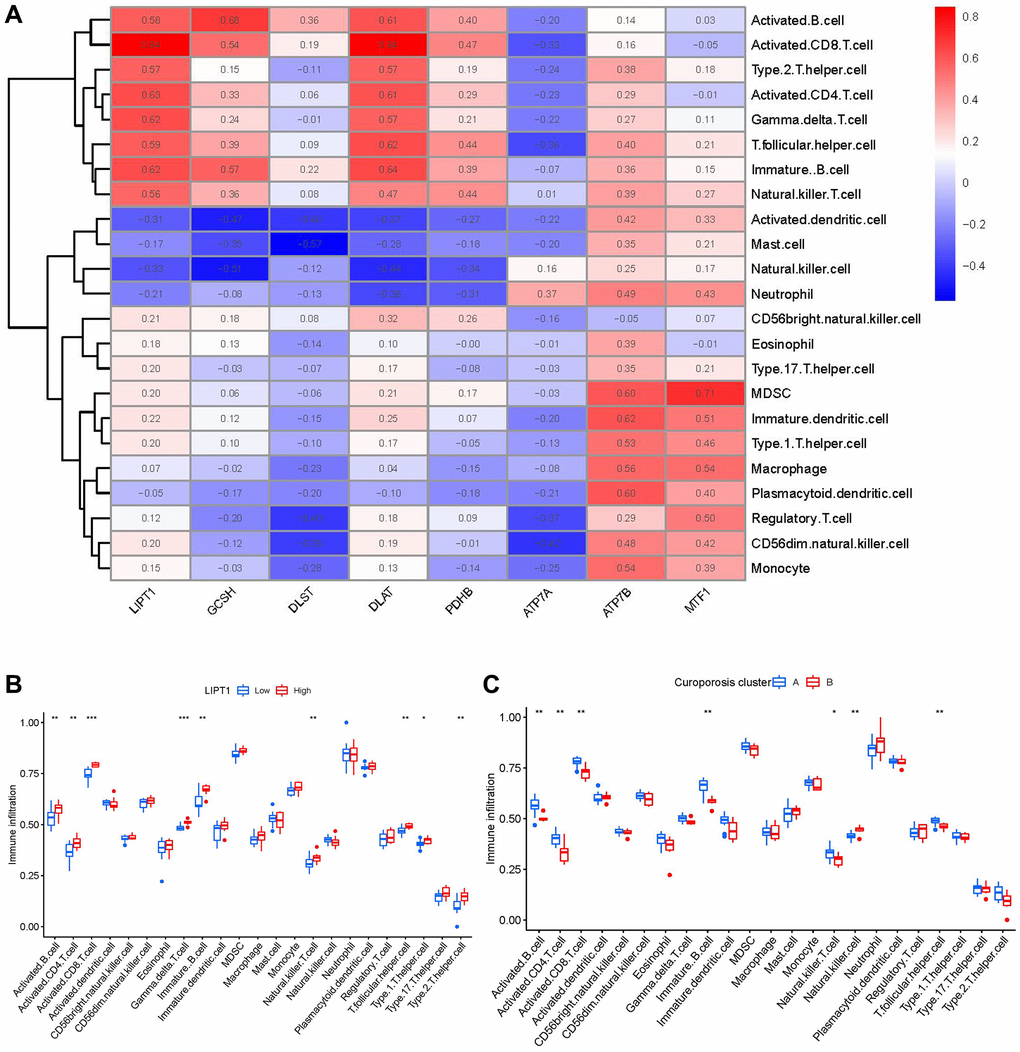
Figure 7. Single sample gene set enrichment analysis. (A) Correlation between immune cell infiltration and the 8 significant cuproptosis modulators. (B) Difference in the abundance of infiltrating immune cells between high and low LIPT1 protein expression groups. (C) Differential immune cell infiltration between clusterA and clusterB. *p < 0.05, **p < 0.01, and ***p < 0.001.
Cuproptosis gene signature establishment through two distinct cuproptosis gene clusters
On the basis of the 163 cuproptosis-associated DEGs, we classified the IDD cases into different genomic subtypes using a consensus clustering technique in order to illuminate the cuproptosis patterns. We discovered two unique cuproptosis gene patterns (gene clusterA and gene clusterB), which matched the sectionalization of cuproptosis patterns (Figure 8A–8D). The expression levels of the 163 cuproptosis-associated DEGs in gene clusterA and gene clusterB were shown in Figure 8E. The immune cell infiltration levels and the 8 important cuproptosis regulators between gene clusterA and gene clusterB were also analogous to those in the cuproptosis patterns (Figure 8F, 8G). The accuracy of our sectionalization by the consensus clustering method was once again confirmed by these results. PCA techniques were used to quantify the cuproptosis patterns by calculating the cuproptosis scores for each sample between the two different cuproptosis patterns. We discovered that the clusterB displayed higher cuproptosis score than clusterA (Figure 8H). Finally, we plotted a Sankey diagram to exhibit the relationships among cuproptosis scores, cuproptosis patterns, and cuproptosis gene patterns (Figure 8I).
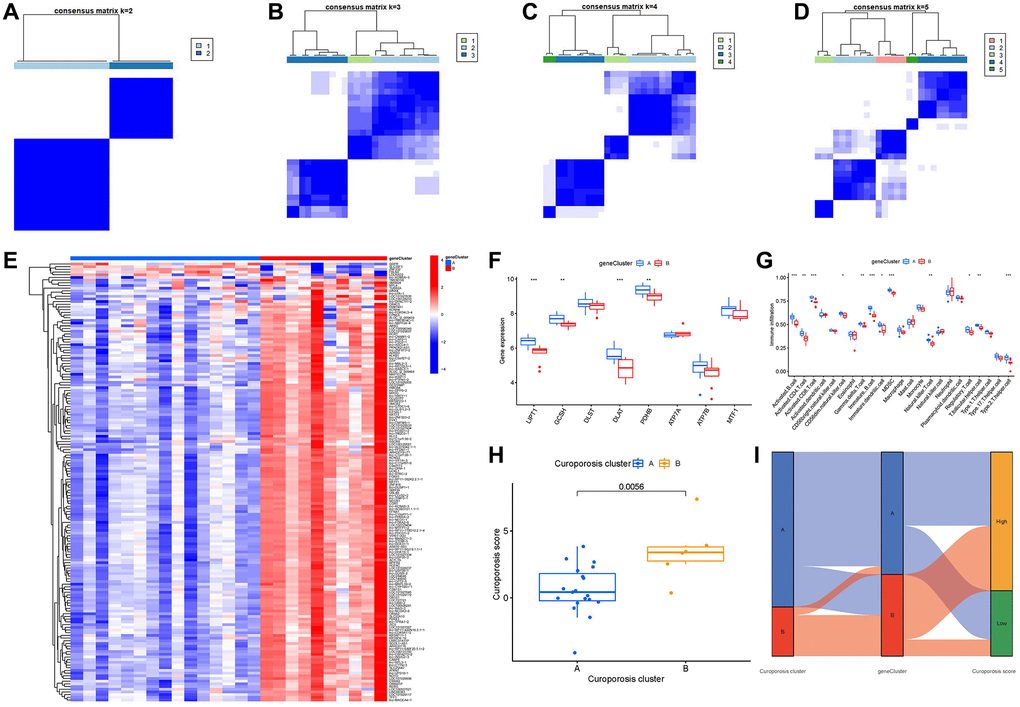
Figure 8. Consensus clustering of the 163 cuproptosis-associated DEGs in IDD. (A–D) Consensus matrices of the 163 cuproptosis-associated DEGs for k = 2–5. (E) Expression heat map of the 163 cuproptosis-associated DEGs in gene clusterA and gene clusterB. (F) Differential expression boxplot of the 8 significant cuproptosis modulators in gene clusterA and gene clusterB. (G) Differential immune cell infiltration between gene clusterA and gene clusterB. (H) Differences in cuproptosis score between clusterA and clusterB. (I) Sankey diagram showing the relationship between cuproptosis patterns, cuproptosis gene patterns, and cuproptosis scores. *p < 0.05, **p < 0.01, and ***p < 0.001.
Identification of candidate compounds against IDD
In the aspects of 8 significant cuproptosis genes as potential drug targets of IDD, we screened the top 10 compounds based on their P-value in the DSigDB database, as shown in Figure 9A and Supplementary Table 5. Then we visualized a compound-target network (Figure 9B) via Cytoscape (v3.7.2) software, which shows the relationships between effective compounds and 8 significant cuproptosis genes.
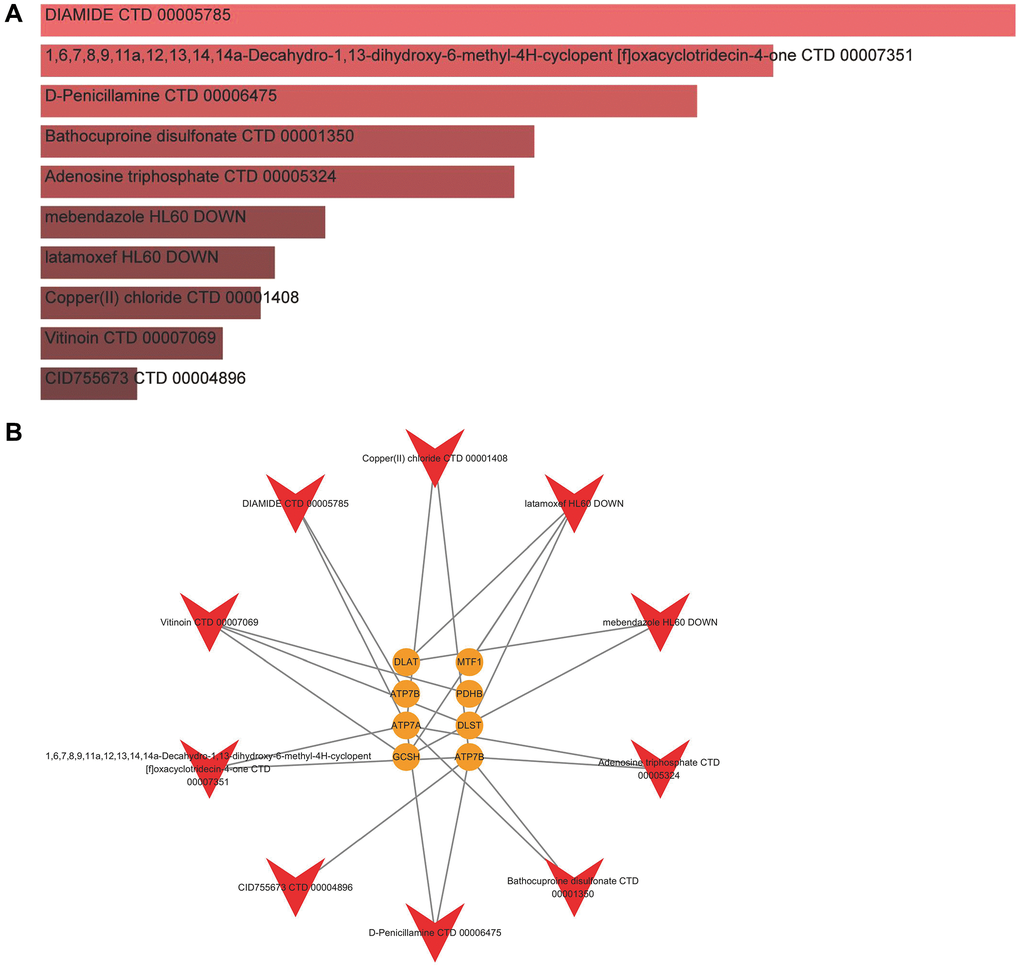
Figure 9. Identification of candidate compounds against IDD. (A) The top 10 effective compounds from the DSigDB database for 8 significant cuproptosis genes. (B) Compound-target network.
Clinical sample validation
In order to understand the presence of cuproptosis during IDD, we collected NP tissue samples from patients. The T2-weight images of Magnetic Resonance exhibited degenerated discs of different degrees with varied signal intensity (Figure 10A).
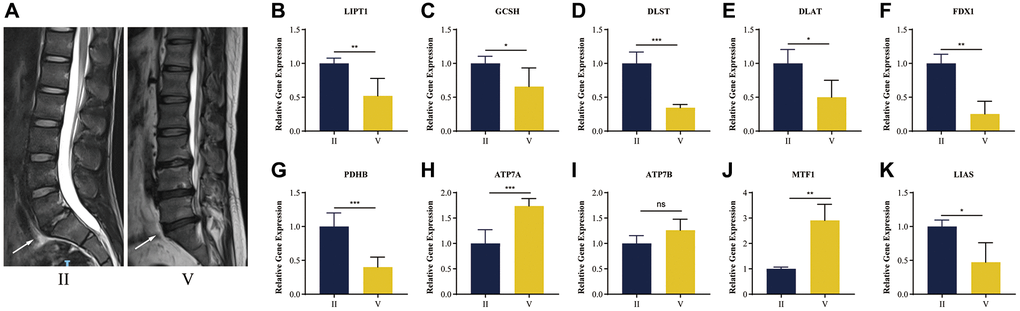
Figure 10. RT-qPCR validation of human NP tissue. (A) Typical human MR T2-weighted images of grade II and grade IV. The degenerated discs were indicated by white arrows. (B–K) Cuproptosis genes FDX1, LIAS, LIPT1, GCSH, DLST, DLAT, PDHB, exhibited significantly lower expression levels in IDD NP samples than controls, while ATP7A, ATP7B and MTF1 displayed the opposite results. All results were expressed as mean ± standard deviation. *p < 0.05; **p < 0.01; ***p < 0.001.
It was verified that cuproptosis genes FDX1, LIAS, LIPT1, GCSH, DLST, DLAT, PDHB, exhibited significantly lower expression levels in IDD NP samples than controls, while ATP7A, ATP7B and MTF1 displayed the opposite results (Figure 10B–10K), which was consistent with the bioinformatics results.
Histological staining analysis and RT-qRCR validation in vivo
Figure 11A, 11B show the results of HE and safranin O/green staining. It is clear that the intervertebral discs in the IDD group exhibited greater degeneration compared to the control group, such as disappearance of the nucleus pulposus, which was replaced by disorganized annulus fibrosus; also, the orderly arrangement of the annulus fibrosus was destroyed and the endplate partly disappeared. This indicates successful establishment of an IDD model of naturally aging mice.
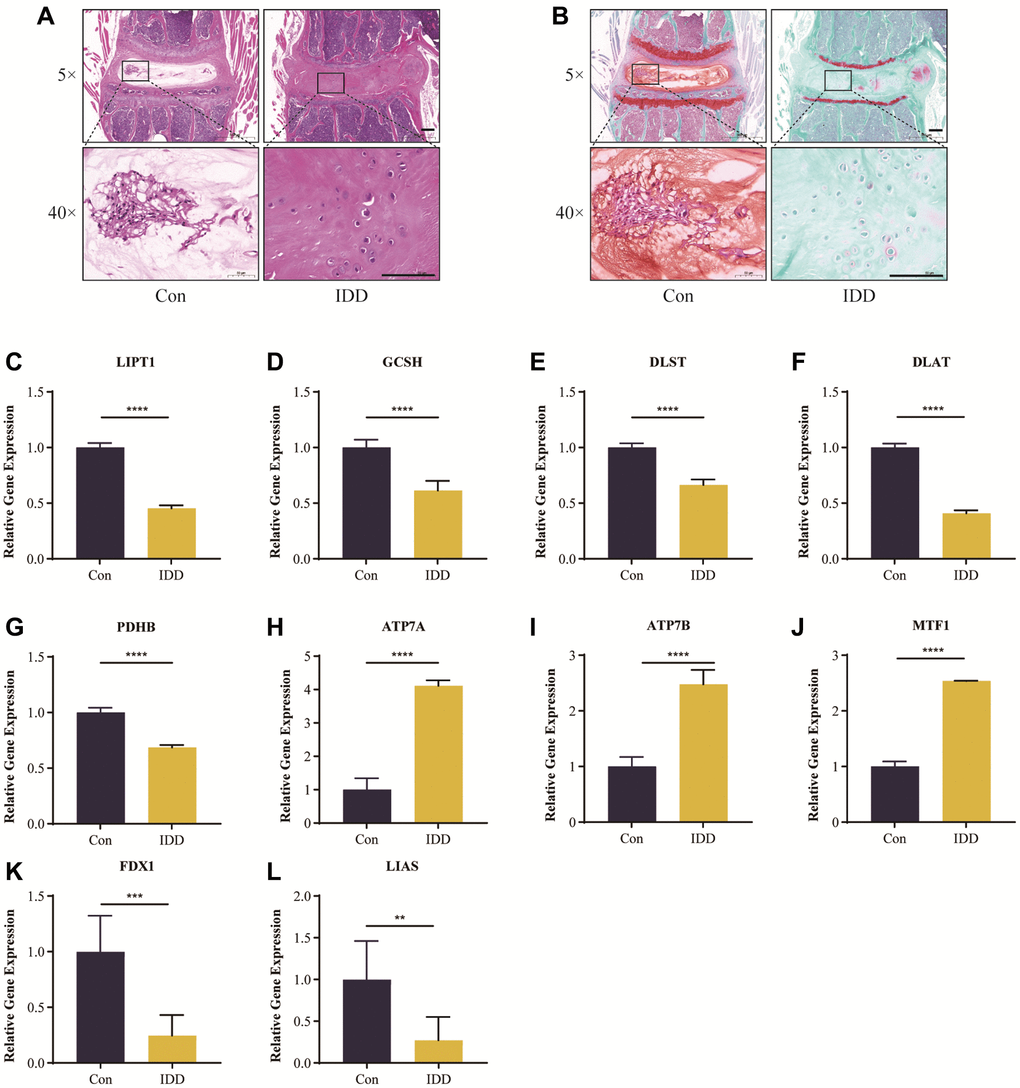
Figure 11. Histological staining analysis and RT-qRCR validation in vivo. Representative HE (A) and safranin O/green-stained (B) images of intervertebral discs in the control and IDD groups. (C–L) Cuproptosis genes FDX1, LIAS, LIPT1, GCSH, DLST, DLAT, and PDHB exhibited significantly lower expression levels in IDD NP samples than controls, while ATP7A, ATP7B and MTF1 displayed the opposite results. All results were expressed as mean ± standard deviation. **p < 0.01; ***p < 0.001; ****p < 0.0001.
It was verified that cuproptosis genes FDX1, LIAS, LIPT1, GCSH, DLST, DLAT, PDHB, exhibited significantly lower expression levels in IDD NP samples than controls, while ATP7A, ATP7B and MTF1 displayed the opposite results (Figure 11C–11L), which was consistent with the bioinformatics results.
Immunofluorescence analysis and RT-qRCR validation in vitro
The assay concentrations of TBHP were 0, 50, 100, 150, 200 and 250 μmol/L (μM). The THBP concentration at 100 μM after 4 h suppressed the proliferation of NP cells (Supplementary Figure 1); in turn, this induced inflammation and oxidative stress, thereby contributing to the pathogenesis of IDD as reported previously [32, 33]. Thus, a THBP concentration of 100 μM (after 4 h) was selected for subsequent experiments. Importantly, NP-specific anabolic gene ACAN, have important functions in the pathological process of IDD [34]. Therefore, we also detected the protein expression of ACAN using immunofluorescence assays. As Figure 12A shows, fluorescence intensity of ACAN was reduced after TBHP treatment, which demonstrated the successful establishment of IDD cell model in vitro.
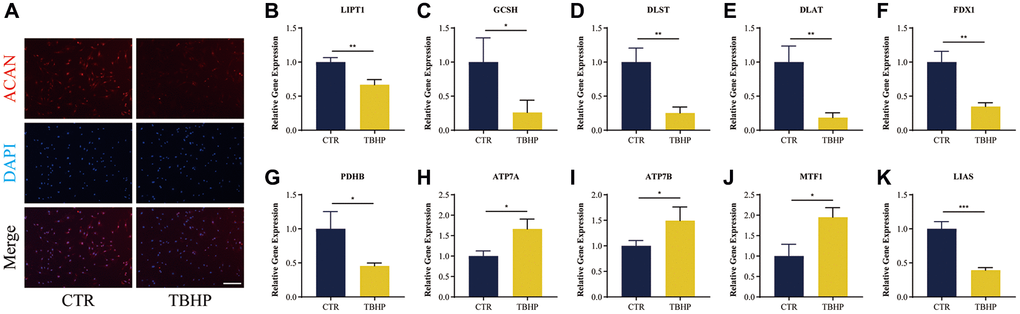
Figure 12. Immunofluorescence analysis and RT-qRCR validation in vitro. (A) Representative immunofluorescence images of ACAN in NP cells photographed by fluorescence microscopy; Scale bar = 100 μm. (B–K) Cuproptosis genes FDX1, LIAS, LIPT1, GCSH, DLST, DLAT, and PDHB exhibited significantly lower expression levels in IDD NP cell samples than controls, while ATP7A, ATP7B and MTF1 displayed the opposite results. All results were expressed as mean ± standard deviation. *p < 0.05; **p < 0.01; ***p < 0.001. Abbreviations: CTR: control; TBHP: tert-butyl hydrogen peroxide.
It was verified that cuproptosis genes FDX1, LIAS, LIPT1, GCSH, DLST, DLAT, PDHB, exhibited significantly lower expression levels in IDD NP cells indued by TBHP than controls, while ATP7A, ATP7B and MTF1 displayed the opposite results (Figure 12B–12K), which was consistent with the bioinformatics results.
Discussion
IDD results from the structure and function disorders of intervertebral discs, which impairs the maintenance of spinal stability causing low back pain, increasing a major financial and social burden throughout the world [35, 36]. In addition, the clinical treatment of IDD doesn’t focus on its pathogenesis but the symptoms, which can’t prevent its vicious circle process fundamentally [36]. Gene targeted therapies can delay or even reverse IDD at the genetic level by suppressing inflammatory cell death and inflammatory response, which may be a therapeutic strategy for IDD [37]. Cuproptosis is a copper-triggered manner of mitochondrial cell death [38]. Mounting evidence has revealed that copper metabolism plays an important role in multiple biological processes of IDD [14, 39]. It has been verified that copper complexes exert a toxic and immunogenic effect on intervertebral discs [15], suggesting that cuproptosis may exist in the pathological process of IDD. However, the role of cuproptosis modulators in IDD stays unclear due to scanty research. Our present study has revealed that these vital cuproptosis modulators in IDD show close correlations with cuproptosis-related mechanisms, which are mainly enriched in biological process (tricarboxylic acid metabolic process), cellular component (mitochondrial matrix), and molecular function (ATPase activity), while their KEGG enrichment analysis showed that Citrate cycle (TCA cycle) was one of the mainly enriched pathways (Figure 2J, 2K).
Firstly, a total of 8 significant cuproptosis modulators were screened from 16 cuproptosis modulators via differential expression analysis between controls and IDD cases, which were selected as diagnostic cuproptosis modulators (LIPT1, DLAT, PDHB, GCSH, DLST, ATP7A, ATP7B and MTF1) based on an established RF model to predict the occurrence of IDD. Then, we set up a nomogram model on the basis of the five candidate cuproptosis modulators (ATP7B, DLAT, MTF1, PDHB, GCSH), which has been evaluated via the DCA curve to produce benefit to IDD patients in virtue of decisions on the basis of the nomogram model.
Lipoic acid genes encoding components of the lipoic acid pathway are critical modulators of cuproptosis, and the synthesis of lipoic acid occurs in mitochondria under the catalysis of LIPT1, DLAT, LIAS and PDHB [7]. Lipoic acid can not only act synergistically with different types of heavy metals (such as copper, iron, mercury) to protect organs and tissues, but also accelerate the glucose metabolic cycle in mitochondria, enhancing the body’s metabolism and immune function [40, 41]. Lipoic acid could reverse mitochondrial apoptosis and damage caused by high glucose in cartilage endplate cells [42], and the presence of lipoic acid also affect human intervertebral disc tissue and extracellular matrix structure in vitro [43]. LIPT1 (lipolytransferase 1) is an enzyme activating 2-ketoacid dehydrogenases related to the TCA cycle [44], which has been reported to exert amidotransferase activity in disorders of human lipoate metabolism [45]. Protein targets of lipoylation are comprised of the pyruvate dehydrogenase (PDH) complex, including PDHB (pyruvate dehydrogenase E1 subunit beta) and DLAT (dihydrolipoamide S-acetyltransferase) [7, 46]. DLAT and PDHB are indispensable for immune microenvironmental conditions, which are closely correlated with carbohydrate metabolism and mitochondrial TCA cycle [47, 48]. Many studies have shown that the deficiency of PDHB leads to mitochondrial dysfunction and promotes glycolysis [49]. Existing study has confirmed that annulus fibrosus tissue highly expresses PDH, the enzyme responsible for lactate oxidative phosphorylation in the TCA cycle, which is evidence of lactate-dependent metabolic symbiosis in intervertebral discs [50]. These lipoylation targets and FDX1 are the key regulators of cuproptosis, when FDX1 knockout resulted in complete loss of protein lipoylation and triggered cuproptosis [7]. In our in vivo and in vitro experiments as well as clinical sample validation, we found that FDX1, LIAS, LIPT1, DLAT and PDHB were expressed at significantly lower level in IDD samples. It is suggested that lower expression of FDX1, LIAS, LIPT1, DLAT and PDHB may be involved in impacting lipoate metabolism and mitochondrial TCA cycle and triggering cuproptosis, which could contribute to the progression of IDD.
GCSH (glycine cleavage system protein H) and DLST (dihydrolipoamide S-succinyltransferase) serve as important enzymes activating a highly conserved lysine posttranslational modification called protein lipoylation, which are involved in metabolic complexes that regulate the entry of carbon into the TCA cycle [51, 52]. Existing evidence has confirmed that GCSH has a dual role in maintaining protein lipoylation and cell metabolism [53]. DLST has been reported to be the most importantly elevated gene in myeloid cells, and inhibition of DLST reduces expression and function of immunosuppressive markers as well as oxidative phosphorylation in myeloid cells [54]. In addition, numerous studies have confirmed that GCSH and DLST targeting glycine and glutamine metabolism have the potential to delay IDD through antioxidant effects [55–57]. In our in vivo and in vitro experiments as well as clinical sample validation, we found that GCSH and DLST were expressed at significantly lower level in IDD samples. It is suggested that lower expression of GCSH and DLST may be involved in impacting glycine and glutamine metabolism as well as antioxidant effects and thus triggering cuproptosis, which could contribute to the progression of IDD.
The mechanisms of cuproptosis involve the gene models of copper homeostasis dysregulation, including cuproptosis regulator MTF1 (metal-regulatory transcription factor 1), the copper exporters ATP7A (ATPase copper-transporting alpha) and ATP7B (ATPase copper-transporting beta), which are encoded by genes that are mutated in the copper dysregulation syndrome Wilson’s disease [58, 59]. The overexpression of ATP7A or ATP7B can lead to intracellular copper accumulation and cell death with aging-related diseases and various cancers [60, 61]. Through ATP hydrolysis, ATP7A and ATP7B are able to transport copper from the cytoplasm to the cell membrane, which have emerged as predictive markers for resistance to chemotherapy [62]. Existing report has shown that the ATPase-related subunits could enhance the anti-proliferative effect in the osmoregulatory response of nucleus pulposus cells [63]. It has been reported that the nuclear translocation of MTF1 could influence the progression of IDD in vivo [64]. In our in vivo and in vitro experiments as well as clinical sample validation, we found that ATP7A, ATP7B and MTF1 were expressed at significantly higher level in IDD samples. It is suggested that higher expression of ATP7A, ATP7B and MTF1 may be involved in copper accumulation and cell death, which could contribute to the progression of IDD.
Previous studies have shown that the number and phenotype of immune cell subpopulations in intervertebral disc tissues are closely correlated with the development and progression of IDD patients [65]. Abundant immune cells are infiltrated in the immune microenvironment of the intervertebral disc, triggering the inflammatory response of IDD, so it is considered to be a potential strategy to ameliorate IDD symptoms through immunotherapy targeting immune cells [66]. Our study demonstrated that the patients in clusterB with high-risk cuproptosis scores had a greater abundance of natural killer cell. Existing research shows that the activated natural killer cells take part in the pathological process of IDD [67]. Further study has confirmed that natural killer cells exert cytotoxic effects on nucleus pulposus cells [68]. However, the patients in clusterA with low-risk cuproptosis scores was related to activated CD4 T cell, activated B cell, etc. The adaptive immune response to IDD could be characterized by the activated subsets of T and B cells, and abnormal differentiation of T cells could trigger the overexpression of inflammatory molecules and abnormal expression of B cells, which has a significant connection with IDD [65, 69]. CD4 T cell subset has been reported to participate in regulating inflammatory response and provide immunomodulatory treatments for IDD [70]. B cells were activated to manufacture antibodies, which are involved in inflammation and immune responses of IDD [65]. Therefore, immunotherapy based on clusterA or clusterB would provide a promising therapeutic strategy against IDD.
In addition, our present study offers 10 candidate drugs against IDD from the DSigDB database for 8 significant cuproptosis genes based on the assessment of target-compound interactions, which is important to understand the structural features recommended for receptor sensitivity [27]. However, there exist some limitations to this study. Further experimental validations are necessary to confirm the specific mechanisms by which cuproptosis-related genes affect specific pathways and the immune microenvironment in IDD. To the best of our acknowledge, there exist no studies on the direct correlation between these candidate cuproptosis modulators and IDD. We expect that our present study can provide strategies for future experimental research on these cuproptosis modulators.
Conclusion
In general, our present study screened 8 prognostic cuproptosis modulators and constructed a nomogram model providing accurate prediction for the prevalence of IDD. Then, we authenticated two cuproptosis patterns based on the 8 cuproptosis modulators. Importantly, we collected clinical IDD samples and successfully established IDD model in vivo and in vitro, and then carried out RT-qPCR experiments, indicating that cuproptosis genes FDX1, LIAS, LIPT1, GCSH, DLST, DLAT, PDHB, exhibited significantly lower expression levels in IDD samples than controls, while ATP7A, ATP7B and MTF1 displayed the opposite results, which was consistent with the bioinformatics results. To our knowledge, this study is the first to report cuproptosis-related prognostic biomarkers of IDD in the subtype classification and immune microenvironment infiltration.
Author Contributions
Peng Zhang, Guangye Zhu, Hui Ren, and Xiaobing Jiang contributed to the study conception and design. Peng Zhang, Jiahui He, Yanchi Gan contributed to the bioinformatics analysis and experimental validation. Peng Zhang, Qi Shang, Honglin Chen, Jianchao Cui, Wenhua Zhao, Gengyang Shen, Yuwei Li contributed to data analysis, and drafting the manuscript. Peng Zhang, Jiahui He, Yanchi Gan have contributed equally to this work. All authors read and approved the submitted manuscript.
Acknowledgments
We show gratitude for the authors who provided the GEO public datasets. We thank Lingnan Medical Research Center of Guangzhou University of Chinese Medicine for providing the experimental facility for the successful conduct of this study.
Conflicts of Interest
The authors declare no conflicts of interest related to this study.
Ethical Statement and Consent
All study procedures were approved by the Ethics Committee of The First Affiliated Hospital of Guangzhou University of Chinese Medicine (No. JY2022-122). The informed consent was obtained from patients. All methods were carried out in accordance with the Declaration of Helsinki for human participants. The animal experimental study was approved by the Ethics Committee of The First Affiliated Hospital of Guangzhou University of Chinese Medicine (No. TCMF1-2021026). All the experiments were performed in accordance with relevant ethical guidelines and regulations. Above study is reported in accordance with ARRIVE guidelines.
Funding
The project was generously supported by the grants from National Natural Science Foundation of China (82274542, 82274615, 82205137, 82205230), Innovative Team Project of the Department of Education of Guangdong Province (2021KCXTD017), High-Level University Collaborative Innovation Team of GZUCM (2021xk57), Project of Key Laboratory of Orthopedics and Traumatology of Traditional Chinese Medicine of Jiangsu Provincial Health Commission (No. JSDW202253, SZS2022019), and Jiangsu Provincial Medical Key Discipline (Laboratory) ((2022) No. 17).
References
- 1. Bello AB, Kim Y, Park S, Muttigi MS, Kim J, Park H, Lee S. Matrilin3/TGFβ3 gelatin microparticles promote chondrogenesis, prevent hypertrophy, and induce paracrine release in MSC spheroid for disc regeneration. NPJ Regen Med. 2021; 6:50. https://doi.org/10.1038/s41536-021-00160-0 [PubMed]
- 2. Ruiz-Fernández C, Francisco V, Pino J, Mera A, González-Gay MA, Gómez R, Lago F, Gualillo O. Molecular Relationships among Obesity, Inflammation and Intervertebral Disc Degeneration: Are Adipokines the Common Link? Int J Mol Sci. 2019; 20:2030. https://doi.org/10.3390/ijms20082030 [PubMed]
- 3. Liu L, He J, Liu C, Yang M, Fu J, Yi J, Ai X, Liu M, Zhuang Y, Zhang Y, Huang B, Li C, Zhou Y, Feng C. Cartilage intermediate layer protein affects the progression of intervertebral disc degeneration by regulating the extracellular microenvironment (Review). Int J Mol Med. 2021; 47:475–84. https://doi.org/10.3892/ijmm.2020.4832 [PubMed]
- 4. Zhao K, An R, Xiang Q, Li G, Wang K, Song Y, Liao Z, Li S, Hua W, Feng X, Wu X, Zhang Y, Das A, Yang C. Acid-sensing ion channels regulate nucleus pulposus cell inflammation and pyroptosis via the NLRP3 inflammasome in intervertebral disc degeneration. Cell Prolif. 2021; 54:e12941. https://doi.org/10.1111/cpr.12941 [PubMed]
- 5. Kang L, Zhang H, Jia C, Zhang R, Shen C. Targeting Oxidative Stress and Inflammation in Intervertebral Disc Degeneration: Therapeutic Perspectives of Phytochemicals. Front Pharmacol. 2022; 13:956355. https://doi.org/10.3389/fphar.2022.956355 [PubMed]
- 6. Tu J, Li W, Yang S, Yang P, Yan Q, Wang S, Lai K, Bai X, Wu C, Ding W, Cooper-White J, Diwan A, Yang C, et al. Single-Cell Transcriptome Profiling Reveals Multicellular Ecosystem of Nucleus Pulposus during Degeneration Progression. Adv Sci (Weinh). 2022; 9:e2103631. https://doi.org/10.1002/advs.202103631 [PubMed]
- 7. Tsvetkov P, Coy S, Petrova B, Dreishpoon M, Verma A, Abdusamad M, Rossen J, Joesch-Cohen L, Humeidi R, Spangler RD, Eaton JK, Frenkel E, Kocak M, et al. Copper induces cell death by targeting lipoylated TCA cycle proteins. Science. 2022; 375:1254–61. https://doi.org/10.1126/science.abf0529 [PubMed]
- 8. Tang D, Chen X, Kroemer G. Cuproptosis: a copper-triggered modality of mitochondrial cell death. Cell Res. 2022; 32:417–8. https://doi.org/10.1038/s41422-022-00653-7 [PubMed]
- 9. Yang H, Liu CN, Wolf RM, Ralle M, Dev S, Pierson H, Askin F, Steele KE, Magnuson TH, Schweitzer MA, Wong GW, Lutsenko S. Obesity is associated with copper elevation in serum and tissues. Metallomics. 2019; 11:1363–71. https://doi.org/10.1039/c9mt00148d [PubMed]
- 10. Li X, Shao F, Sun J, Du K, Sun Y, Feng F. Enhanced Copper-Temozolomide Interactions by Protein for Chemotherapy against Glioblastoma Multiforme. ACS Appl Mater Interfaces. 2019; 11:41935–45. https://doi.org/10.1021/acsami.9b14849 [PubMed]
- 11. Hassani S, Ghaffari P, Chahardouli B, Alimoghaddam K, Ghavamzadeh A, Alizadeh S, Ghaffari SH. Disulfiram/copper causes ROS levels alteration, cell cycle inhibition, and apoptosis in acute myeloid leukaemia cell lines with modulation in the expression of related genes. Biomed Pharmacother. 2018; 99:561–9. https://doi.org/10.1016/j.biopha.2018.01.109 [PubMed]
- 12. Samadi A, Isikhan SY, Tinkov AA, Lay I, Doşa MD, Skalny AV, Skalnaya MG, Chirumbolo S, Bjørklund G. Zinc, copper, and oxysterol levels in patients with type 1 and type 2 diabetes mellitus. Clin Nutr. 2020; 39:1849–56. https://doi.org/10.1016/j.clnu.2019.07.026 [PubMed]
- 13. Michalczyk K, Cymbaluk-Płoska A. The Role of Zinc and Copper in Gynecological Malignancies. Nutrients. 2020; 12:3732. https://doi.org/10.3390/nu12123732 [PubMed]
- 14. Staszkiewicz R, Bryś K, Gładysz D, Gralewski M, Garczarek M, Gadzieliński M, Wieczorek J, Marcol W, Ostenda A, Grabarek BO. Changes in Elements and Relationships among Elements in Intervertebral Disc Degeneration. Int J Environ Res Public Health. 2022; 19:9042. https://doi.org/10.3390/ijerph19159042 [PubMed]
- 15. Tindel NL, Reiter MF, Cohen-Levy WB, Zafonte B, Banovac K, Eismont FJ. The effect of surgically implanted metallic bullet fragments on the intervertebral disc using a canine model☆. Spine J. 2019; 19:755–61. https://doi.org/10.1016/j.spinee.2018.09.008 [PubMed]
- 16. Wang Y, Dai G, Li L, Liu L, Jiang L, Li S, Liao S, Wang F, Du W, Li Y. Transcriptome signatures reveal candidate key genes in the whole blood of patients with lumbar disc prolapse. Exp Ther Med. 2019; 18:4591–602. https://doi.org/10.3892/etm.2019.8137 [PubMed]
- 17. Wang Y, Dai G, Jiang L, Liao S, Xia J. Microarray analysis reveals an inflammatory transcriptomic signature in peripheral blood for sciatica. BMC Neurol. 2021; 21:50. https://doi.org/10.1186/s12883-021-02078-y [PubMed]
- 18. Ritchie ME, Phipson B, Wu D, Hu Y, Law CW, Shi W, Smyth GK. limma powers differential expression analyses for RNA-sequencing and microarray studies. Nucleic Acids Res. 2015; 43:e47. https://doi.org/10.1093/nar/gkv007 [PubMed]
- 19. Bao X, Shi R, Zhao T, Wang Y. Mast cell-based molecular subtypes and signature associated with clinical outcome in early-stage lung adenocarcinoma. Mol Oncol. 2020; 14:917–32. https://doi.org/10.1002/1878-0261.12670 [PubMed]
- 20. Dai B, Sun F, Cai X, Li C, Liu H, Shang Y. Significance of RNA N6-Methyladenosine Regulators in the Diagnosis and Subtype Classification of Childhood Asthma Using the Gene Expression Omnibus Database. Front Genet. 2021; 12:634162. https://doi.org/10.3389/fgene.2021.634162 [PubMed]
- 21. Wilkerson MD, Hayes DN. ConsensusClusterPlus: a class discovery tool with confidence assessments and item tracking. Bioinformatics. 2010; 26:1572–3. https://doi.org/10.1093/bioinformatics/btq170 [PubMed]
- 22. Denny P, Feuermann M, Hill DP, Lovering RC, Plun-Favreau H, Roncaglia P. Exploring autophagy with Gene Ontology. Autophagy. 2018; 14:419–36. https://doi.org/10.1080/15548627.2017.1415189 [PubMed]
- 23. Zhang B, Wu Q, Li B, Wang D, Wang L, Zhou YL. m6A regulator-mediated methylation modification patterns and tumor microenvironment infiltration characterization in gastric cancer. Mol Cancer. 2020; 19:53. https://doi.org/10.1186/s12943-020-01170-0 [PubMed]
- 24. Zhang N, Zhao YD, Wang XM. CXCL10 an important chemokine associated with cytokine storm in COVID-19 infected patients. Eur Rev Med Pharmacol Sci. 2020; 24:7497–505. https://doi.org/10.26355/eurrev_202007_21922 [PubMed]
- 25. Kuleshov MV, Jones MR, Rouillard AD, Fernandez NF, Duan Q, Wang Z, Koplev S, Jenkins SL, Jagodnik KM, Lachmann A, McDermott MG, Monteiro CD, Gundersen GW, Ma'ayan A. Enrichr: a comprehensive gene set enrichment analysis web server 2016 update. Nucleic Acids Res. 2016; 44:W90–7. https://doi.org/10.1093/nar/gkw377 [PubMed]
- 26. Yoo M, Shin J, Kim J, Ryall KA, Lee K, Lee S, Jeon M, Kang J, Tan AC. DSigDB: drug signatures database for gene set analysis. Bioinformatics. 2015; 31:3069–71. https://doi.org/10.1093/bioinformatics/btv313 [PubMed]
- 27. Mahmud SMH, Al-Mustanjid M, Akter F, Rahman MS, Ahmed K, Rahman MH, Chen W, Moni MA. Bioinformatics and system biology approach to identify the influences of SARS-CoV-2 infections to idiopathic pulmonary fibrosis and chronic obstructive pulmonary disease patients. Brief Bioinform. 2021; 22:bbab115. https://doi.org/10.1093/bib/bbab115 [PubMed]
- 28. Chen X, Zhang P, Ma X. Rab7 delays intervertebral disc degeneration through the inhibition of the p38MAPK pathway. Biochem Biophys Res Commun. 2019; 514:835–41. https://doi.org/10.1016/j.bbrc.2019.04.184 [PubMed]
- 29. Pfirrmann CW, Metzdorf A, Zanetti M, Hodler J, Boos N. Magnetic resonance classification of lumbar intervertebral disc degeneration. Spine (Phila Pa 1976). 2001; 26:1873–8. https://doi.org/10.1097/00007632-200109010-00011 [PubMed]
- 30. Zhang Y, He F, Chen Z, Su Q, Yan M, Zhang Q, Tan J, Qian L, Han Y. Melatonin modulates IL-1β-induced extracellular matrix remodeling in human nucleus pulposus cells and attenuates rat intervertebral disc degeneration and inflammation. Aging (Albany NY). 2019; 11:10499–512. https://doi.org/10.18632/aging.102472 [PubMed]
- 31. Li X, Lin F, Wu Y, Liu N, Wang J, Chen R, Lu Z. Resveratrol attenuates inflammation environment-induced nucleus pulposus cell senescence in vitro. Biosci Rep. 2019; 39:BSR20190126. https://doi.org/10.1042/BSR20190126 [PubMed]
- 32. Chen J, Hou C, Chen X, Wang D, Yang P, He X, Zhou J, Li H. Protective effect of cannabidiol on hydrogen peroxide-induced apoptosis, inflammation and oxidative stress in nucleus pulposus cells. Mol Med Rep. 2016; 14:2321–7. https://doi.org/10.3892/mmr.2016.5513 [PubMed]
- 33. Seol D, Coleman MC, Martin JA, Song I, Jaidev LR, Salem AK, Lim TH. Targeting oxidative stress with amobarbital to prevent intervertebral disc degeneration: Part I. in vitro and ex vivo studies. Spine J. 2021; 21:1021–30. https://doi.org/10.1016/j.spinee.2021.02.008 [PubMed]
- 34. He R, Wang Z, Cui M, Liu S, Wu W, Chen M, Wu Y, Qu Y, Lin H, Chen S, Wang B, Shao Z. HIF1A Alleviates compression-induced apoptosis of nucleus pulposus derived stem cells via upregulating autophagy. Autophagy. 2021; 17:3338–60. https://doi.org/10.1080/15548627.2021.1872227 [PubMed]
- 35. Rustenburg CME, Faraj SSA, Holewijn RM, Kingma I, van Royen BJ, Stadhouder A, Emanuel KS. The biomechanical effect of single-level laminectomy and posterior instrumentation on spinal stability in degenerative lumbar scoliosis: a human cadaveric study. Neurosurg Focus. 2019; 46:E15. https://doi.org/10.3171/2019.2.FOCUS1911 [PubMed]
- 36. Costăchescu B, Niculescu AG, Teleanu RI, Iliescu BF, Rădulescu M, Grumezescu AM, Dabija MG. Recent Advances in Managing Spinal Intervertebral Discs Degeneration. Int J Mol Sci. 2022; 23:6460. https://doi.org/10.3390/ijms23126460 [PubMed]
- 37. Li Y, Wu X, Li J, Du L, Wang X, Cao J, Li H, Huo Z, Li G, Pan D, Xu H, Xu B. Circ_0004354 might compete with circ_0040039 to induce NPCs death and inflammatory response by targeting miR-345-3p-FAF1/TP73 axis in intervertebral disc degeneration. Oxid Med Cell Longev. 2022; 2022:2776440. https://doi.org/10.1155/2022/2776440 [PubMed]
- 38. Zheng P, Zhou C, Lu L, Liu B, Ding Y. Elesclomol: a copper ionophore targeting mitochondrial metabolism for cancer therapy. J Exp Clin Cancer Res. 2022; 41:271. https://doi.org/10.1186/s13046-022-02485-0 [PubMed]
- 39. Zioła-Frankowska A, Kubaszewski Ł, Dąbrowski M, Frankowski M. Interrelationship between silicon, aluminum, and elements associated with tissue metabolism and degenerative processes in degenerated human intervertebral disc tissue. Environ Sci Pollut Res Int. 2017; 24:19777–84. https://doi.org/10.1007/s11356-017-9588-y [PubMed]
- 40. Melhem MF, Craven PA, Liachenko J, DeRubertis FR. Alpha-lipoic acid attenuates hyperglycemia and prevents glomerular mesangial matrix expansion in diabetes. J Am Soc Nephrol. 2002; 13:108–16. https://doi.org/10.1681/ASN.V131108 [PubMed]
- 41. Holmquist L, Stuchbury G, Berbaum K, Muscat S, Young S, Hager K, Engel J, Münch G. Lipoic acid as a novel treatment for Alzheimer's disease and related dementias. Pharmacol Ther. 2007; 113:154–64. https://doi.org/10.1016/j.pharmthera.2006.07.001 [PubMed]
- 42. Jiang Z, Lu W, Zeng Q, Li D, Ding L, Wu J. High glucose-induced excessive reactive oxygen species promote apoptosis through mitochondrial damage in rat cartilage endplate cells. J Orthop Res. 2018; 36:2476–83. https://doi.org/10.1002/jor.24016 [PubMed]
- 43. Aydin I, Sirin DY, Karaarslan N, Ozbek H. Investigation of the Potential Effects of Alpha-Lipoic Acid on Human Degenerated Intervertebral Disc Tissue Primary Cell Cultures. Turk Neurosurg. 2022; 32:420–9. https://doi.org/10.5137/1019-5149.JTN.34917-21.3 [PubMed]
- 44. Solmonson A, Faubert B, Gu W, Rao A, Cowdin MA, Menendez-Montes I, Kelekar S, Rogers TJ, Pan C, Guevara G, Tarangelo A, Zacharias LG, Martin-Sandoval MS, et al. Compartmentalized metabolism supports midgestation mammalian development. Nature. 2022; 604:349–53. https://doi.org/10.1038/s41586-022-04557-9 [PubMed]
- 45. Cao X, Zhu L, Song X, Hu Z, Cronan JE. Protein moonlighting elucidates the essential human pathway catalyzing lipoic acid assembly on its cognate enzymes. Proc Natl Acad Sci U S A. 2018; 115:E7063–72. https://doi.org/10.1073/pnas.1805862115 [PubMed]
- 46. Shan C, Kang HB, Elf S, Xie J, Gu TL, Aguiar M, Lonning S, Hitosugi T, Chung TW, Arellano M, Khoury HJ, Shin DM, Khuri FR, et al. Tyr-94 phosphorylation inhibits pyruvate dehydrogenase phosphatase 1 and promotes tumor growth. J Biol Chem. 2014; 289:21413–22. https://doi.org/10.1074/jbc.M114.581124 [PubMed]
- 47. Echeverri Ruiz NP, Mohan V, Wu J, Scott S, Kreamer M, Benej M, Golias T, Papandreou I, Denko NC. Dynamic regulation of mitochondrial pyruvate metabolism is necessary for orthotopic pancreatic tumor growth. Cancer Metab. 2021; 9:39. https://doi.org/10.1186/s40170-021-00275-4 [PubMed]
- 48. Michailidis M, Karagiannis E, Tanou G, Sarrou E, Stavridou E, Ganopoulos I, Karamanoli K, Madesis P, Martens S, Molassiotis A. An integrated metabolomic and gene expression analysis identifies heat and calcium metabolic networks underlying postharvest sweet cherry fruit senescence. Planta. 2019; 250:2009–22. https://doi.org/10.1007/s00425-019-03272-6 [PubMed]
- 49. Li A, Zhang Y, Zhao Z, Wang M, Zan L. Molecular Characterization and Transcriptional Regulation Analysis of the Bovine PDHB Gene. PLoS One. 2016; 11:e0157445. https://doi.org/10.1371/journal.pone.0157445 [PubMed]
- 50. Wang D, Hartman R, Han C, Zhou CM, Couch B, Malkamaki M, Roginskaya V, Van Houten B, Mullett SJ, Wendell SG, Jurczak MJ, Kang J, Lee J, et al. Lactate oxidative phosphorylation by annulus fibrosus cells: evidence for lactate-dependent metabolic symbiosis in intervertebral discs. Arthritis Res Ther. 2021; 23:145. https://doi.org/10.1186/s13075-021-02501-2 [PubMed]
- 51. Solmonson A, DeBerardinis RJ. Lipoic acid metabolism and mitochondrial redox regulation. J Biol Chem. 2018; 293:7522–30. https://doi.org/10.1074/jbc.TM117.000259 [PubMed]
- 52. Rowland EA, Snowden CK, Cristea IM. Protein lipoylation: an evolutionarily conserved metabolic regulator of health and disease. Curr Opin Chem Biol. 2018; 42:76–85. https://doi.org/10.1016/j.cbpa.2017.11.003 [PubMed]
- 53. Arribas-Carreira L, Dallabona C, Swanson MA, Farris J, Østergaard E, Tsiakas K, Hempel M, Aquaviva-Bourdain C, Koutsoukos S, Stence NV, Magistrati M, Spector EB, Kronquist K, et al. Pathogenic variants in GCSH encoding the moonlighting H-protein cause combined nonketotic hyperglycinemia and lipoate deficiency. Hum Mol Genet. 2023; 32:917–33. https://doi.org/10.1093/hmg/ddac246 [PubMed]
- 54. Udumula MP, Sakr S, Dar S, Alvero AB, Ali-Fehmi R, Abdulfatah E, Li J, Jiang J, Tang A, Buekers T, Morris R, Munkarah A, Giri S, Rattan R. Ovarian cancer modulates the immunosuppressive function of CD11b+Gr1+ myeloid cells via glutamine metabolism. Mol Metab. 2021; 53:101272. https://doi.org/10.1016/j.molmet.2021.101272 [PubMed]
- 55. Wu X, Liu C, Yang S, Shen N, Wang Y, Zhu Y, Guo Z, Yang SY, Xing D, Li H, Guo Z, Chen B, Xiang H. Glycine-Serine-Threonine Metabolic Axis Delays Intervertebral Disc Degeneration through Antioxidant Effects: An Imaging and Metabonomics Study. Oxid Med Cell Longev. 2021; 2021:5579736. https://doi.org/10.1155/2021/5579736 [PubMed]
- 56. Shen N, Korm S, Karantanos T, Li D, Zhang X, Ritou E, Xu H, Lam A, English J, Zong WX, Liu CT, Shirihai O, Feng H. DLST-dependence dictates metabolic heterogeneity in TCA-cycle usage among triple-negative breast cancer. Commun Biol. 2021; 4:1289. https://doi.org/10.1038/s42003-021-02805-8 [PubMed]
- 57. Gebauer E, Goßla E, Kwas C, Salzig D, Schmiermund A, Czermak P, Fuchsbauer HL. Identification of transglutaminase substrates from porcine nucleus pulposus as potential amplifiers in cross-linking cell scaffolds. Biomacromolecules. 2013; 14:1564–71. https://doi.org/10.1021/bm400188r [PubMed]
- 58. Lutsenko S. Human copper homeostasis: a network of interconnected pathways. Curr Opin Chem Biol. 2010; 14:211–7. https://doi.org/10.1016/j.cbpa.2010.01.003 [PubMed]
- 59. Nevitt T, Ohrvik H, Thiele DJ. Charting the travels of copper in eukaryotes from yeast to mammals. Biochim Biophys Acta. 2012; 1823:1580–93. https://doi.org/10.1016/j.bbamcr.2012.02.011 [PubMed]
- 60. Muchenditsi A, Talbot CC
Jr , Gottlieb A, Yang H, Kang B, Boronina T, Cole R, Wang L, Dev S, Hamilton JP, Lutsenko S. Systemic deletion of Atp7b modifies the hepatocytes' response to copper overload in the mouse models of Wilson disease. Sci Rep. 2021; 11:5659. https://doi.org/10.1038/s41598-021-84894-3 [PubMed] - 61. Lopriore P, Capitanio N, Panatta E, Di Daniele N, Gambacurta A, Melino G, Amelio I. TAp73 regulates ATP7A: possible implications for ageing-related diseases. Aging (Albany NY). 2018; 10:3745–60. https://doi.org/10.18632/aging.101669 [PubMed]
- 62. Petruzzelli R, Polishchuk RS. Activity and Trafficking of Copper-Transporting ATPases in Tumor Development and Defense against Platinum-Based Drugs. Cells. 2019; 8:1080. https://doi.org/10.3390/cells8091080 [PubMed]
- 63. Mavrogonatou E, Papadimitriou K, Urban JP, Papadopoulos V, Kletsas D. Deficiency in the α1 subunit of Na+/K+-ATPase enhances the anti-proliferative effect of high osmolality in nucleus pulposus intervertebral disc cells. J Cell Physiol. 2015; 230:3037–48. https://doi.org/10.1002/jcp.25040 [PubMed]
- 64. Lu S, Song Y, Luo R, Li S, Li G, Wang K, Liao Z, Wang B, Ke W, Xiang Q, Chen C, Wu X, Zhang Y, et al. Ferroportin-Dependent Iron Homeostasis Protects against Oxidative Stress-Induced Nucleus Pulposus Cell Ferroptosis and Ameliorates Intervertebral Disc Degeneration In Vivo. Oxid Med Cell Longev. 2021; 2021:6670497. https://doi.org/10.1155/2021/6670497 [PubMed]
- 65. Song C, Zhou Y, Cheng K, Liu F, Cai W, Zhou D, Chen R, Shi H, Fu Z, Chen J, Liu Z. Cellular senescence - Molecular mechanisms of intervertebral disc degeneration from an immune perspective. Biomed Pharmacother. 2023; 162:114711. https://doi.org/10.1016/j.biopha.2023.114711 [PubMed]
- 66. Xu H, Li J, Fei Q, Jiang L. Contribution of immune cells to intervertebral disc degeneration and the potential of immunotherapy. Connect Tissue Res. 2023; 64:413–27. https://doi.org/10.1080/03008207.2023.2212051 [PubMed]
- 67. Guo W, Mu K, Li WS, Gao SX, Wang LF, Li XM, Zhao JY. Identification of mitochondria-related key gene and association with immune cells infiltration in intervertebral disc degeneration. Front Genet. 2023; 14:1135767. https://doi.org/10.3389/fgene.2023.1135767 [PubMed]
- 68. Murai K, Sakai D, Nakamura Y, Nakai T, Igarashi T, Seo N, Murakami T, Kobayashi E, Mochida J. Primary immune system responders to nucleus pulposus cells: evidence for immune response in disc herniation. Eur Cell Mater. 2010; 19:13–21. https://doi.org/10.22203/ecm.v019a02 [PubMed]
- 69. Kämpe A, Knebel A, Carlson R, Rohn K, Tipold A. Evaluation of the involvement of Th17-cells in the pathogenesis of canine spinal cord injury. PLoS One. 2021; 16:e0257442. https://doi.org/10.1371/journal.pone.0257442 [PubMed]
- 70. Cunha C, Q Teixeira G, Ribeiro-Machado C, L Pereira C, Ferreira JR, Molinos M, G Santos S, Barbosa MA, M Goncalves R. Modulation of the In Vivo Inflammatory Response by Pro- Versus Anti-Inflammatory Intervertebral Disc Treatments. Int J Mol Sci. 2020; 21:1730. https://doi.org/10.3390/ijms21051730 [PubMed]