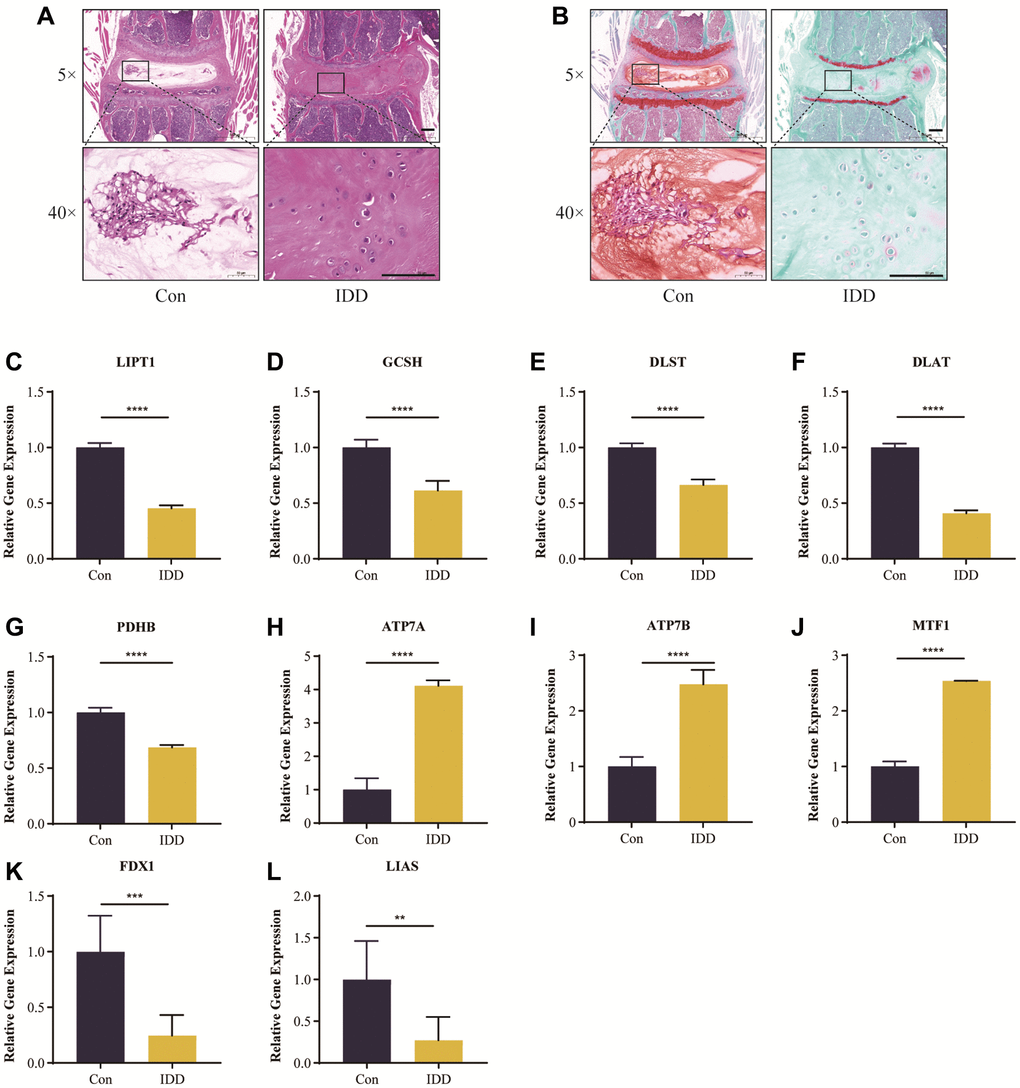
Figure 11.Histological staining analysis and RT-qRCR validation in vivo. Representative HE (A) and safranin O/green-stained (B) images of intervertebral discs in the control and IDD groups. (C–L) Cuproptosis genes FDX1, LIAS, LIPT1, GCSH, DLST, DLAT, and PDHB exhibited significantly lower expression levels in IDD NP samples than controls, while ATP7A, ATP7B and MTF1 displayed the opposite results. All results were expressed as mean ± standard deviation. **p < 0.01; ***p < 0.001; ****p < 0.0001.