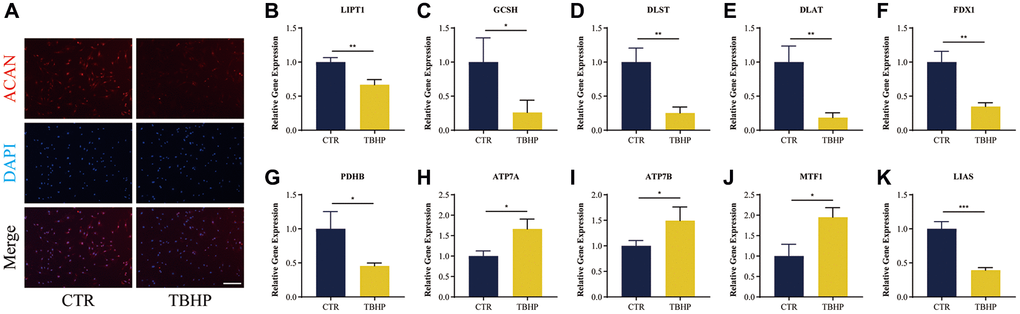
Figure 12.Immunofluorescence analysis and RT-qRCR validation in vitro. (A) Representative immunofluorescence images of ACAN in NP cells photographed by fluorescence microscopy; Scale bar = 100 μm. (B–K) Cuproptosis genes FDX1, LIAS, LIPT1, GCSH, DLST, DLAT, and PDHB exhibited significantly lower expression levels in IDD NP cell samples than controls, while ATP7A, ATP7B and MTF1 displayed the opposite results. All results were expressed as mean ± standard deviation. *p < 0.05; **p < 0.01; ***p < 0.001. Abbreviations: CTR: control; TBHP: tert-butyl hydrogen peroxide.