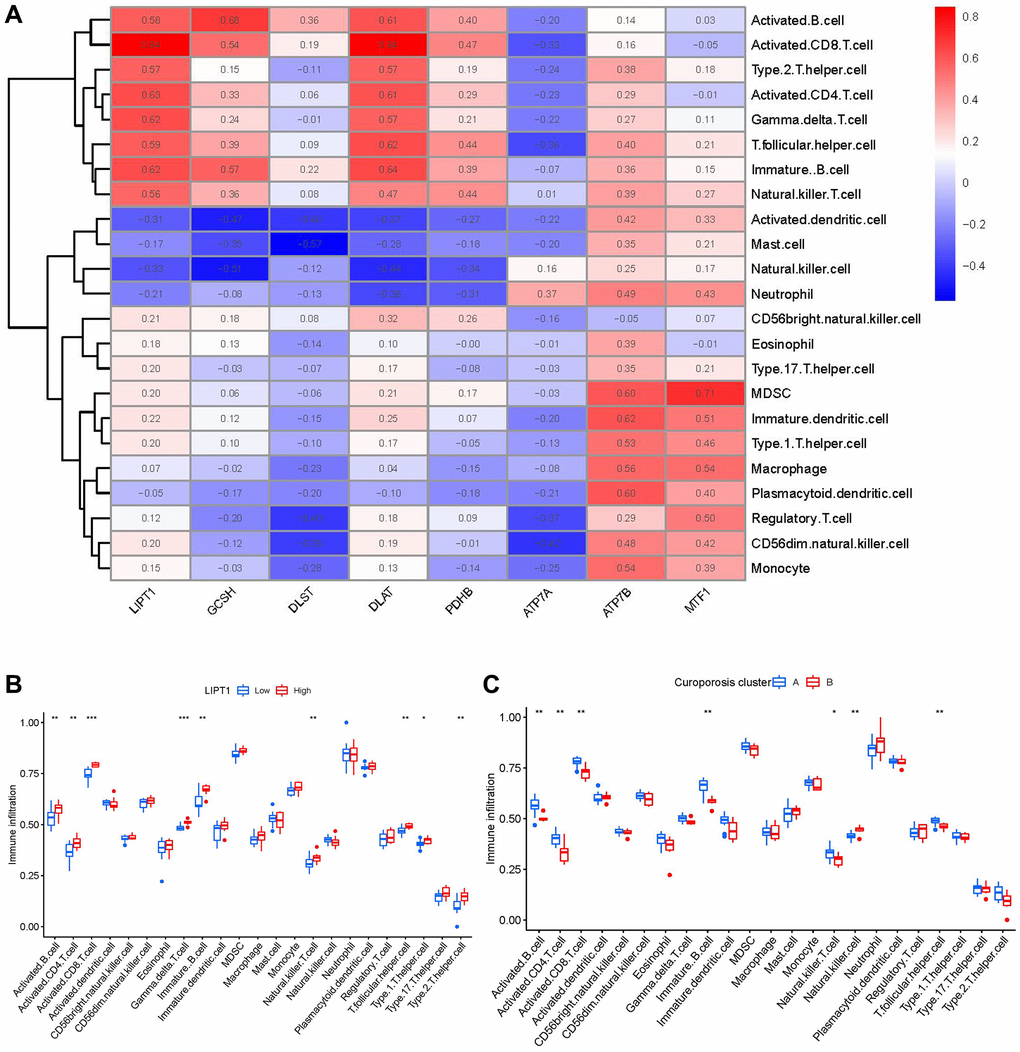
Figure 7.Single sample gene set enrichment analysis. (A) Correlation between immune cell infiltration and the 8 significant cuproptosis modulators. (B) Difference in the abundance of infiltrating immune cells between high and low LIPT1 protein expression groups. (C) Differential immune cell infiltration between clusterA and clusterB. *p < 0.05, **p < 0.01, and ***p < 0.001.