


Introduction
Breast cancer (BC) is one kind of malignant tumor and accounts for one-quarter of cases of cancer in women. Over the past decades, the incidence and mortality of BC in developing countries have increased rapidly, especially in China [1, 2]. Approximately 2 million people were newly diagnosed with BC and 600 thousand died of this malignant tumor worldwide in 2018 [3]. There are many known risk factors involved in the tumorigenesis and progression of BC, such as obesity, genetic factors, family history, and endocrine factors. According to specific protein expressions such as human epidermal growth factor receptor 2 (HER2), estrogen receptor (ER), and progesterone receptor (PR), four subtypes of BC were identified: HER2-enriched (HER2+), TNBC (ER−, PR−, HER2−, triple negative breast cancer), luminal A (ER+ or PR+, HER2−), and luminal B (ER+ or PR+, HER2+) [4, 5]. Despite advances in surgical treatment, endocrine therapy, radiation treatment, chemotherapy and targeted therapy, the five-year survival rate of BC, especially in TNBC, still low owing to distant metastasis [6, 7]. Although there have been many studies on BC, the mechanisms underlying its progression remain unclear. Thus, building a novel gene signature and clarifying the potential mechanisms in BC patients are critically needed.
Mitophagy is a selective process in which mitochondria are selectively cleared through the autophagic pathway. Mitophagy is critical for cellular homeostasis, and cells can eliminate dysfunctional mitochondria or reduce mitochondrial numbers via the mitophagy mechanism [8, 9]. Mitochondria are important cellular organelles that perform many different functions, from cell death regulation and energy generation to immune responses and fatty acid oxidation [10, 11]. Mitophagy can be mediated by multiple molecular mechanisms, such as the NIX, FundC1, and PINK1/Parkin signaling pathways. Mitophagy disorders are closely related to various cancers, including rectal cancer, lung cancer, and BC. Deng et al. revealed that degradation of ULK1 attenuates mitophagy and promotes BC bone metastasis [12]. Although there have been many studies on mitophagy, its role in BC has not been fully studied.
In our analysis, we established a stable signature, including 13 genes, based on differentially expressed genes (DEGs) in mitophagy-related tumor classification. Kaplan–Meier (K–M) and evaluation analyses of the signature were performed across the TCGA-BRCA project. The signature was validated in the independent BC cohort GSE20685. In addition, tumor microenvironment (TME), immunotherapy response, drug sensitivity, and putative molecular pathways were investigated. Taken together, these results provide a novel treatment option and predictive tool for BC.
Materials and Methods
Data
Expression data and clinical information of BC samples were downloaded from the Gene Expression Omnibus (GEO) (GSE20685, https://www.ncbi.nlm.nih.gov/geo/) database and The Cancer Genome Atlas (TCGA) (https://portal.gdc.cancer.gov/repository). The TCGA-BRCA project was used for breast cancer analysis. The batch effect of the GEO data was eliminated by normalization. Transcriptome profiling was converted into fragments per kilobase million (FPKM) and combined with clinical information for further analysis. In addition, we obtained 29 mitophagy-related genes (MRGs) from the Pathway Unification online database (Supplementary Table 1).
Identification of differentially expressed MRGs
To explore the expression profile of MRGs in breast cancer, limma algorithm was used to identify the differentially expressed MRGs by “limma” R package across the TCGA-BRCA dataset [13]. DEGs were screened using the criteria FDR < 0.05. A protein–protein interaction (PPI) network was used to determine the interaction of MRGs using the Search Tool for the Retrieval of Interacting Genes (STRING, https://string-db.org/) [14]. Additionally, a correlation network of m7G-related DEGs was formed (interaction score cutoff = 0.2) using the “reshape2” and “igraph” packages in R [15].
Consensus clustering
Distinct consensus clustering was conducted using differentially expressed MRGs. The threshold was set as iteration = 100 and the resample rate = 80%. Consensus clustering analysis was performed using the “ConsensusClusterPlus” R package and the survival difference between different clusters was evaluated using the “survival” R package [16]. Differences in clinical characteristics between each cluster were shown by a heatmap across the TCGA-STAD project using the “pheatmap” R package.
Development of a gene prognostic signature
First, we analyzed DEGs between BC subtypes using the criteria FDR < 0.05. Prognostic differentially expressed genes were identified using univariate Cox analysis. Next, we used the R package “glmnet” to perform LASSO Cox regression analysis of these prognostic DEGs [17]. The risk score of each BC was calculated as follows:
Prognostic values of the signature and subgroup analysis
Multivariate and univariate Cox regression analyses of the signature and several clinical characteristics were used to identify the independent prognostic factors. Moreover, the expression profiles of genes contained in the signature, as well as the correlation between the signature and clinical characteristics, are presented in a heatmap. Additionally, differences in risk between distinct clinical subgroups were evaluated using the limma algorithm, and the survival of low- and high-risk BC in distinct clinical subgroups was assessed using K–M analysis [22].
Construction and verification of a nomogram
A nomogram was constructed with the stable signature and several clinical characteristics using the “rms” and “regplot” R packages [23]. A calibration curve was constructed to determine the predictive probability of the nomograms. ROC and decision curve analysis (DCA) analyses were performed to demonstrate the robustness of the nomogram as a predictive factor [24].
Functional enrichment analyses
Gene Ontology (GO) analysis, including BP, CC, and MF analyses, was conducted to evaluate the putative cellular functions of DEGs in low- and high-risk BC [25]. Kyoto Encyclopedia of Genes and Genomes (KEGG) analysis was performed to identify the relevant pathways related to DEGs in low- and high-risk BC [26]. The top five enriched pathways of low- and high-risk BC were visualized through gene set enrichment analysis (GSEA) analysis, and enriched pathways of low- and high-risk BC were assessed by gene set variation analysis (GSVA) analysis [27, 28]. The functional enrichment analysis was conducted by “limma,” “org.Hs.eg.db,” “clusterProfiler,” “enrichplot,” “ggplot2,” “GOplot,” and “GSVA” R packages [29].
Tumor immune cell infiltration
We established the immune cell infiltration patterns of low- and high-risk BC using the “TIMER,” “CIBERSORT,” “CIVERSORT-ABS,” “QUANTISEQ,” “MCPCOUNTER,” “XCELL,” and “EPIC” algorithms, visualized with a heatmap. In addition, scores of infiltrating immune cells (CD4+T cells, aDC, B cells, DC, iDC, mast cells, CD8+T cells, NK cells, neutrophils, pDC, macrophages, T helper cells, Tfh, Th1, Th2, Treg, etc.) and immune functions (APC-co-inhibition, APC-co-stimulation, CCR, check-point, cytolytic-activity, and et al.) of low- and high-risk BC were also evaluated across TCGA-BRCA and GSE20685 datasets [30].
Drug sensitivity analysis
Studies have demonstrated that higher inhibitory concentration (IC50) values are related to lower antitumor capacity. To investigate drug sensitivity, we used our established model in the genomics of drug sensitivity in cancer (GDSC) (https://www.cancerrxgene.org/). The R package “pRRophetic” was used to analyze drug sensitivity [31].
Statistical analysis
R software (version 4.1.3) and Perl-5.32 were applied for statistical analysis. Subgroup comparisons were conducted using the Wilcoxon test or Student’s t-test. Spearman’s correlation analysis was performed to analyze the correlation between the two continuous variables. The Kruskal-Wallis test was used to compare the three groups. Statistical significance was defined as p < 0.05.
Results
Identification of DEGs between tumor and normal samples
The mRNA expression of 29 MRGs was evaluated between normal and tumor samples from TCGA database. Then, 23 DEGs were identified, 17 of which (CSNK2A1, CSNK2B, FUNDC1, MFN2, MTERF3, PGAM5, PRKN, SQSTM1, SRC, TOMM20, TOMM22, TOMM40, TOMM5, TOMM70, UBB, ULK1, and VDAC1) were upregulated, whereas six of these genes (CSNK2A2, MAP1LC3B, PINK1, RPS27A, TOMM7, and UBC) were downregulated (Figure 1A and 1B). In addition, PPI was used to explore the correlations between the MRGs (Figure 1C). The correlation network is shown in Figure 1D.
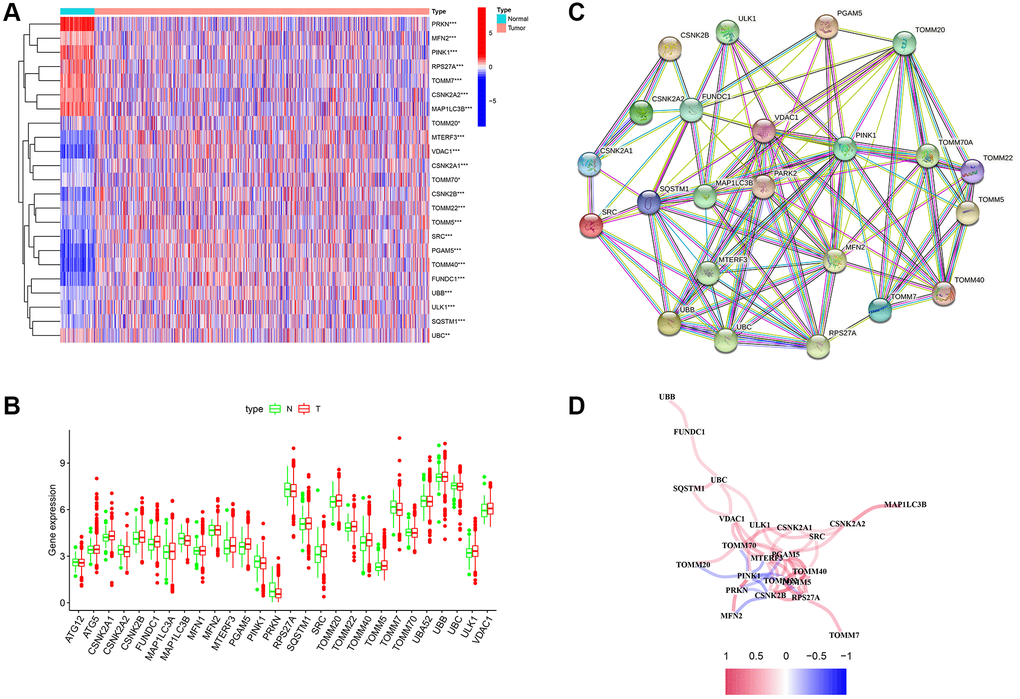
Figure 1. Differentially expressed genes (DEGs) related to mitophagy were identified between cancer and normal tissue. (A) Heatmap of mitophagy-related genes (MRGs) expression profiles. (B) Boxplots of the expression of DEGs. (C) Protein-protein interaction (PPI) network of DEGs. (D) Correlation network of DEGs. Red represents positive correlations while blue represents negative correlations. *p < 0.05; **p < 0.01; ***p < 0.001.
Tumor classification based on MRGs
Unsupervised clustering analysis was performed to evaluate the efficacy of MRGs on BC samples. According to the results of the relative change in the area under the curve (AUC) of the cumulative distribution function (CDF), the optimal cluster number was K = 3 (Figure 2A, 2B and 2C). BC samples were divided into three subtypes (N = 333, 301, and 443) based on mitophagy-related genes. The difference in survival among the three subtypes was significant (Figure 2D). DEGs between the three groups of subtypes were analyzed, and the heatmap combined with clinical information is shown in Figure 2E.
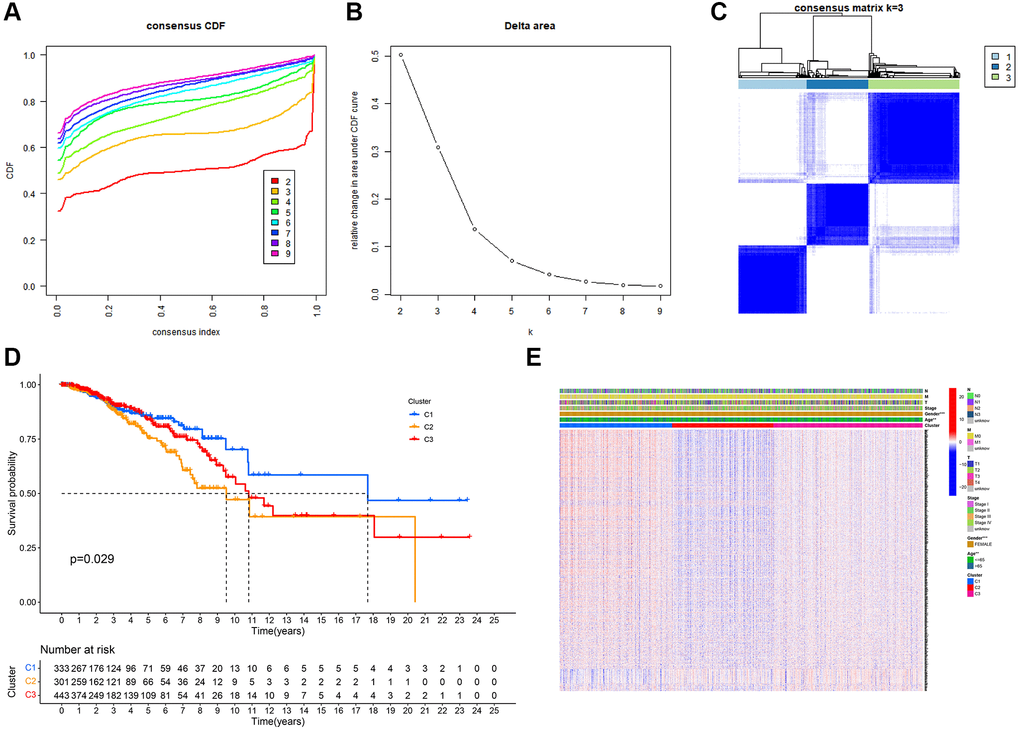
Figure 2. Tumor classification based on mitophagy-related genes (MRGs). (A) Cumulative distribution function (CDF) curves. (B) Delta area curve of consensus clustering. (C) Consensus clustering matrix. (D) Kaplan–Meier (K–M) survival analysis of the three subgroups. (E) Heatmap of DEG expression profiles in three subgroups.
Establishment of the 13-gene signature
DEGs between the three groups of subtypes were evaluated using univariate Cox analyses, and 13 genes were identified as prognosis-related across TCGA-BRCA. ADAM9, MAL2, and CLEC3A were risk genes (HR > 1), whereas TNFRSF14, RELB, SEMA3B, IGFALS, CEBPD, KRTCAP3, CCL19, CHAD, KRT5, and LTF were protective genes (HR < 1) (Figure 3A). We identified a 13-gene signature using the LASSO Cox regression analysis (Figure 3A and 3B). The formula for the risk score is as follows:
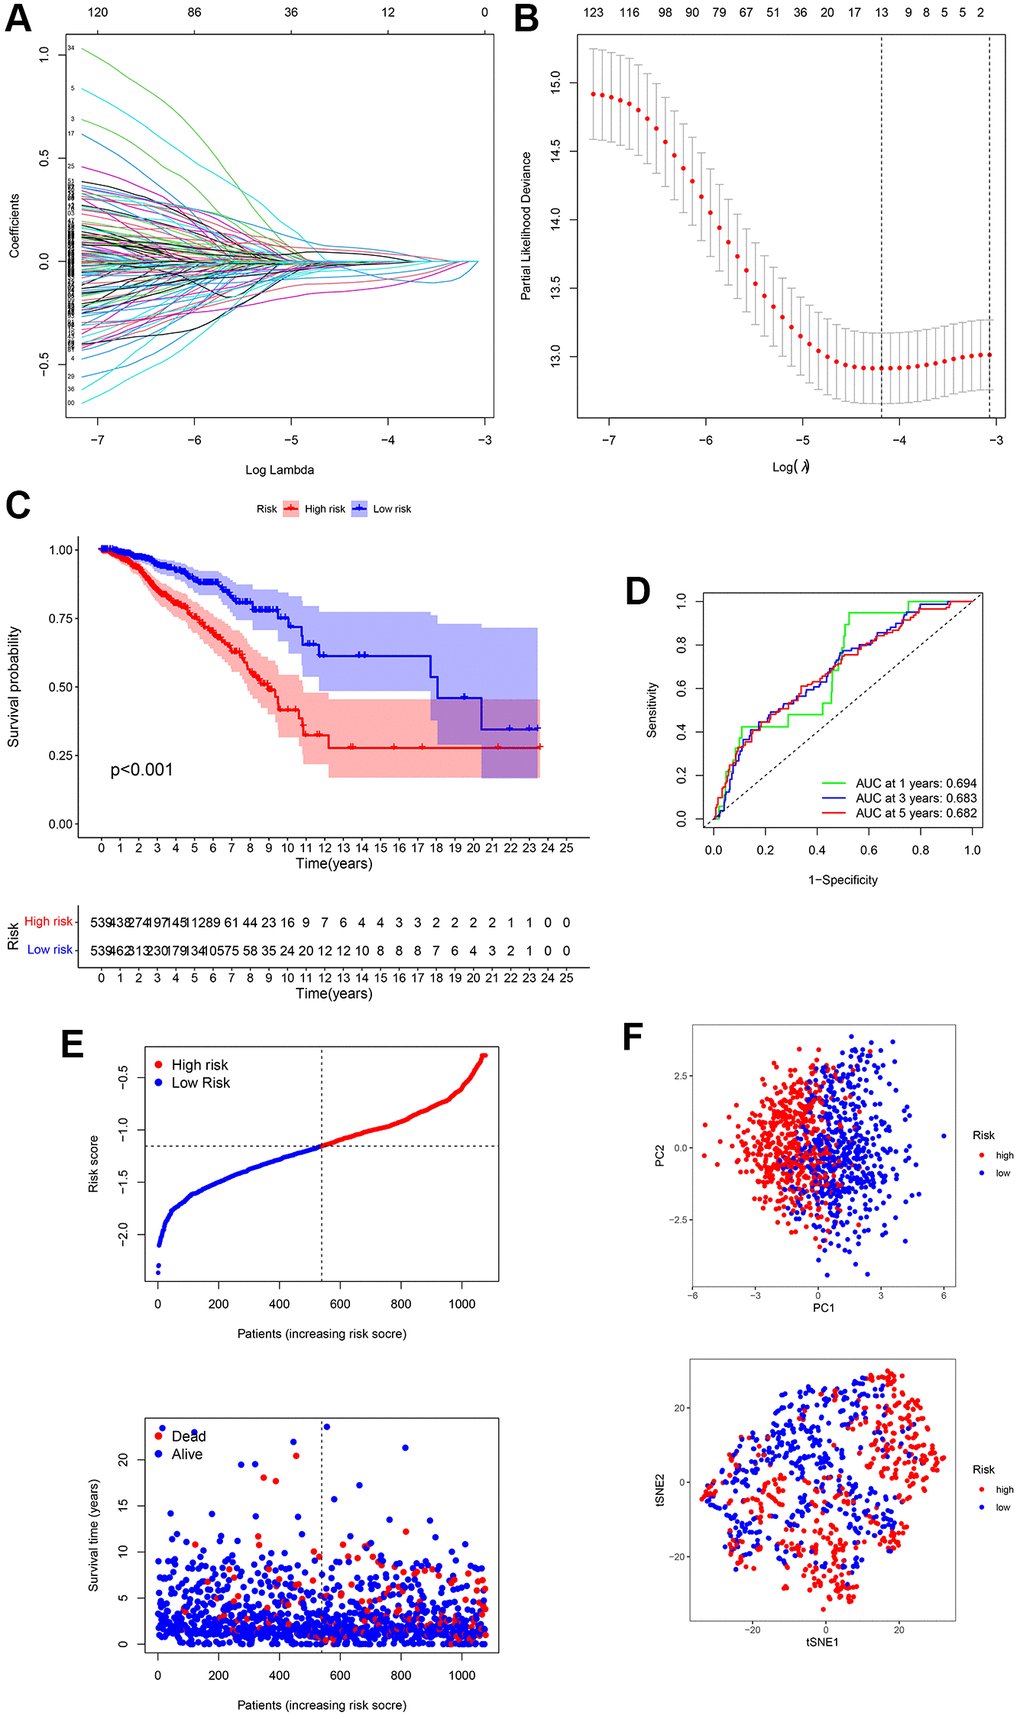
Figure 3. Establishment of a 13-gene signature in TCGA cohort. (A) Differentially expressed genes (DEGs) were penalized by LASSO Cox regression analysis. (B) Cross-validation of candidate genes based on the minimum lambda value. (C) Survival analysis between two risk subgroups. (D) Receiver operating characteristic (ROC) curve of the 13-gene signature. (E) Survival time and status of each breast cancer (BC) sample based on the risk score. (F) Principal component analysis (PCA) of the 13-gene signature.
Risk score = (–0.065 × TNFRSF14exp.) + (–0.006 × RELBexp.) + (–0.132 × SEMA3Bexp.) + (0.059 × ADAM9exp.) + (–0.007 × IGFALSexp.) + (0.031 × MAL2exp.) + (–0.039 × CEBPDexp.) + (–0.095 × KRTCAP3exp.) + (–0.066 × CCL19exp.) + (–0.011 × CHADexp.) + (–0.014 × KRT5exp.) + (0.044 × CLEC3Aexp.) + (–0.005 × LTFexp.) (Figure 3A and 3B).
Patients with BC were divided into high- and low-risk groups based on the median value (Figure 3E). The survival curve suggested that high-risk BC patients had poorer survival rates than that of low-risk BC patients (Figure 3C). ROC analysis was performed to evaluate the predictive model constructed using the risk score. The AUC of the ROC curves at 1, 3, and 5-year were 0.694, 0.683, and 0.682, respectively (Figure 3D). In addition, PCA analysis presented that BC patients in different groups were well separated into different subtypes (Figure 3F).
Validation of the risk signature
The GSE20685 dataset from the GEO database was selected for validation. First, mRNA expression levels were normalized for subsequent analysis. All the patients in the GEO cohort were divided into low- and high-risk subtypes (Figure 4A and 4B). Consistent with TCGA analysis, BC patients in the high-risk group had poorer survival rates (Figure 4C). The AUC of the ROC curve at 1-year, 3-year, and 5-year were 0.815, 0.647, and 0.621, respectively (Figure 4D). In addition, PCA displayed a moderate difference between the two groups (Figure 4E). The results of GSE20685 also demonstrated that our prognostic model had moderate predictive capability.
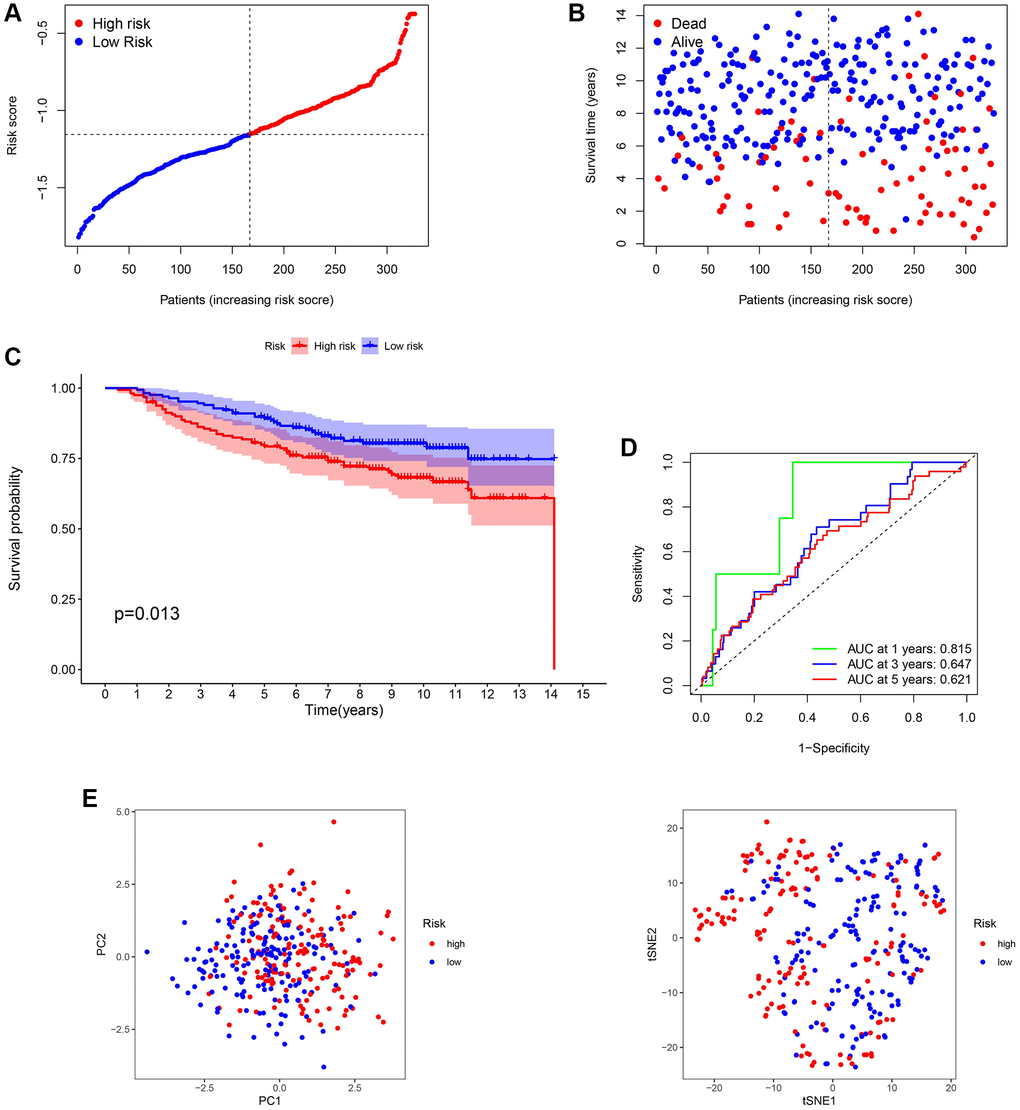
Figure 4. Validation of the 13-gene signature in GSE20685. (A and B) Survival time and status of each breast cancer (BC) sample based on the risk score. (C) Survival analysis between two risk subgroups. (D) Receiver operating characteristic (ROC) curve of the 13-gene signature. (E) Principal component analysis (PCA) of the 13-gene signature.
Independent prognostic analysis of the risk model
Univariate and multivariate Cox regression analyses were performed to estimate independent prognostic factors for patients, univariate and multivariable Cox regression analysis was performed. The results revealed that the risk score (HR = 5.458, 95% CI = 3.441 – 8.657) was a prognostic factor in the TCGA cohort (Figure 5A). Multivariate analysis revealed that the risk score (HR = 4.367, 95% CI = 2.726 – 6.995) was an independent factor for BC patients (Figure 5B). Figure 5C shows that the risk score (HR = 3.233, 95% CI 1.677 – 6.231) was a prognostic factor in the GSE20685 dataset. Multivariate analysis revealed that the risk score (HR = 3.701, 95% CI = 1.781 – 7.691) was an independent factor for BC patients in the GSE20685 cohort (Figure 5D). Moreover, based on the TCGA cohort, a clinicopathological information heatmap was displayed, which showed that BC patients between the two groups showed a significant correlation with tumor stage, age, and T classification (Figure 5E).
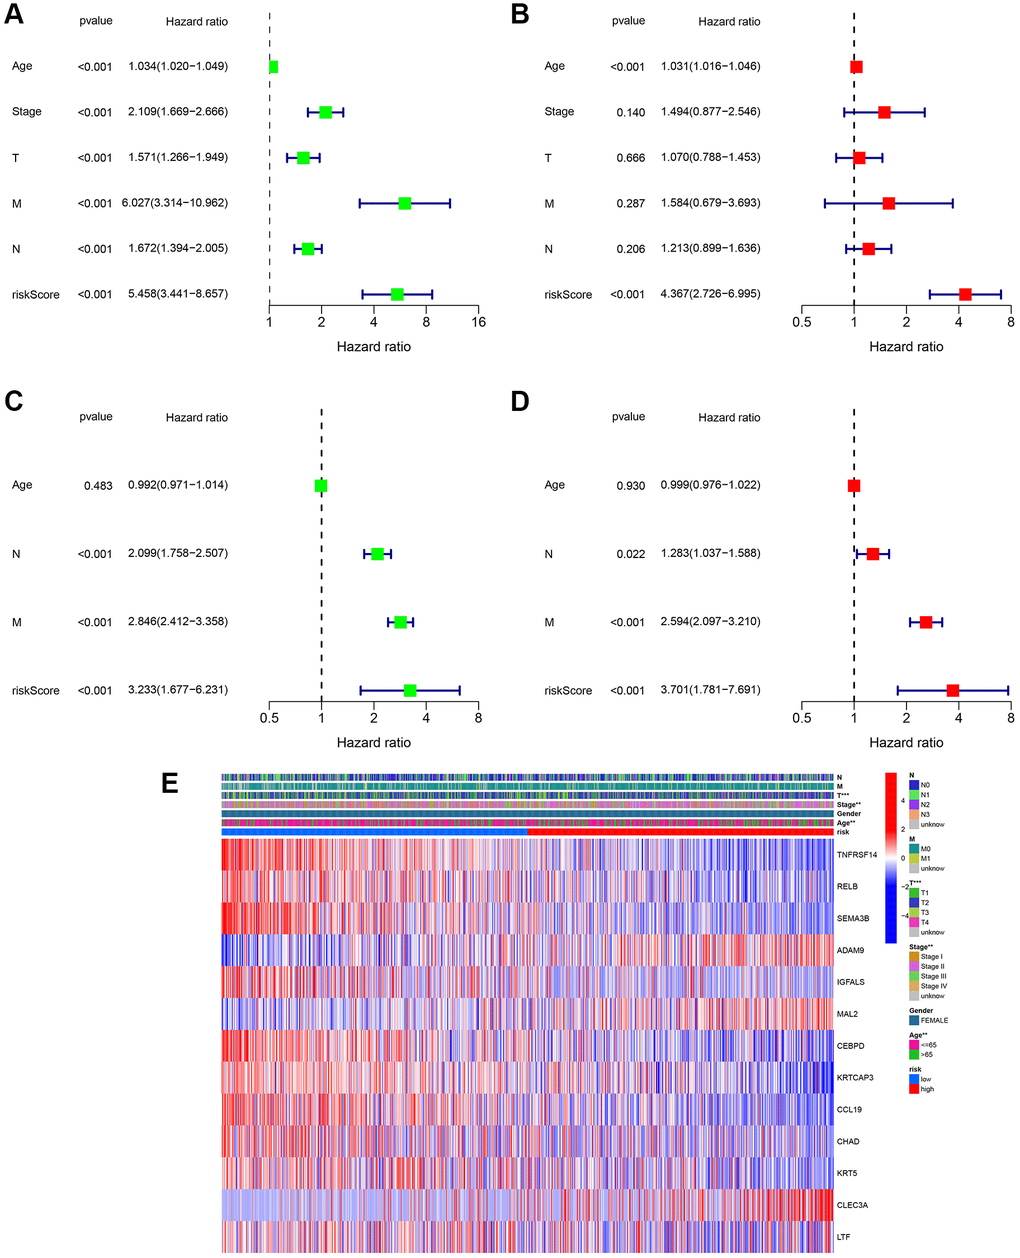
Figure 5. Assessment of the clinical prognostic value of the risk score model in patients with breast cancer (BC) by univariate and multivariate Cox analysis. (A) Univariate independent Cox analysis for TCGA cohort. (B) Multivariate independent Cox analysis for TCGA cohort. (C) Univariate independent Cox analysis for GSE20685. (D) Multivariate independent Cox analysis for GSE20685. (E) Heatmap of the 13-gene signature and clinicopathological manifestations.
Next, the correlation between the risk scores and clinical characteristics was investigated. As shown in Figure 6A, different subgroups, including N stage, age, T stage, and stage, had significantly different risk scores. To further verify the reliability of the risk model, subgroup analysis confirmed the differences in survival between the low- and high-risk groups in different cancer subgroups, including subgroups of age > 65 years, female sex, M1, age ≤ 65 years, N0, stage III-IV, N1-3, stage I-II, T1+2, and T3+4 (Figure 6B).
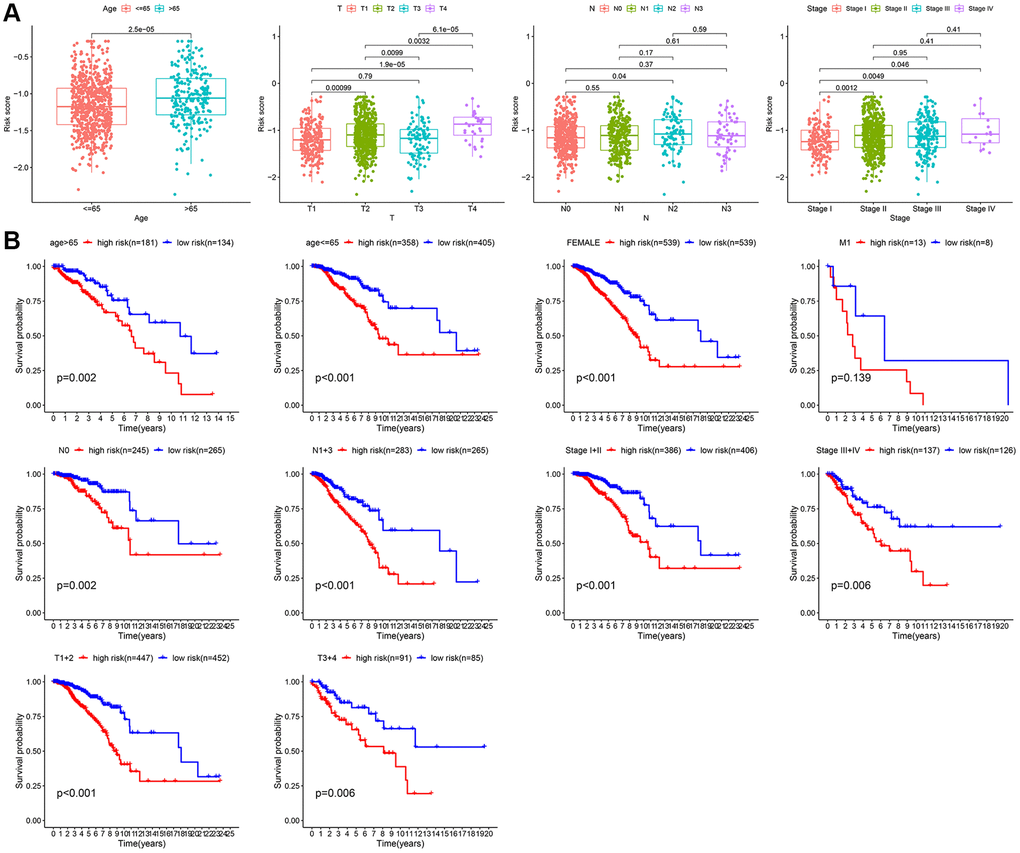
Figure 6. Subgroup analysis of the risk score. (A) Correlation of risk models with clinical characteristics. (B) Survival analysis between two risk subgroups during clinical subgroups.
Establishment of a prognostic nomogram for BC patients
Based on TCGA cohort, we generated a new prognostic nomogram to predict BC patient survival (Figure 7A), which revealed that the prognostic nomogram could systematically predict the overall survival (OS) of BC patients at 1, 3, and 5 years. The calibration plots showed good agreement between the actual and predicted outcomes (Figure 7B). In addition, the AUC of the nomogram for predicting survival was 0.844 (Figure 7C), and DCA showed a robust predictive probability of the nomogram (Figure 7D).
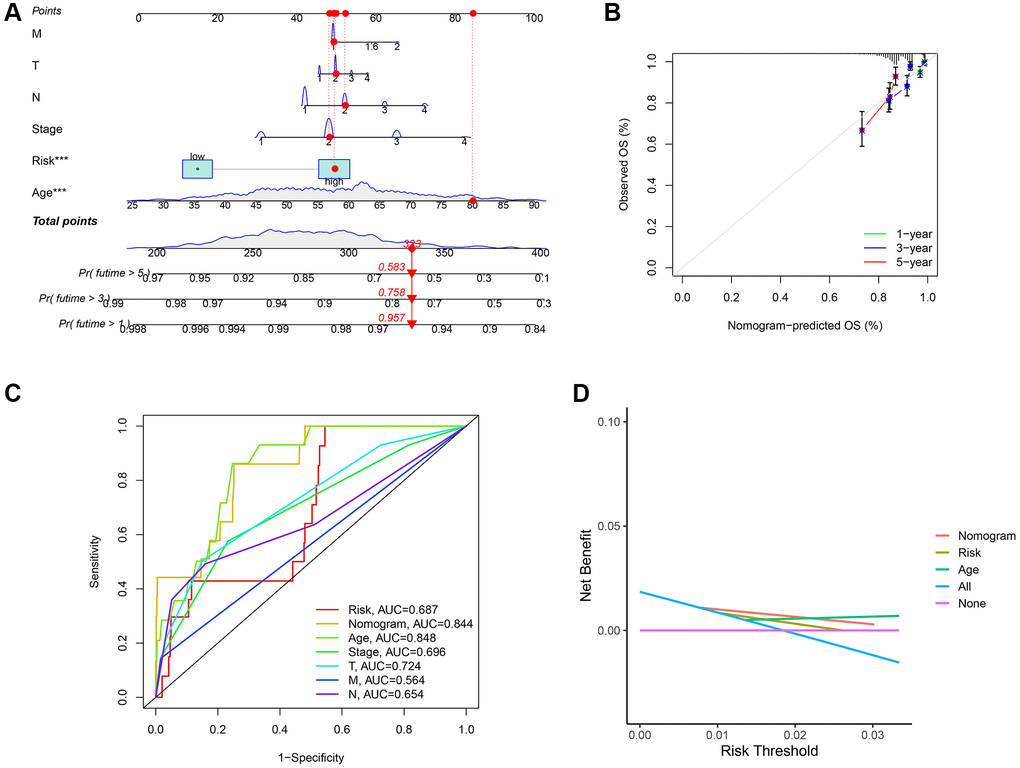
Figure 7. Establishment of nomogram model and calibration curves. (A) The predictive nomogram. (B) The calibration curves of the nomogram. (C) Receiver operating characteristic (ROC) curve analysis of the clinicopathological manifestations and nomogram. (D) The decision curve analyses (DCA) plot.
Functional enrichment of the risk signature
To research the functional annotations of the 13-gene risk signature, we performed enrichment analysis on DEGs between the high- and low-risk groups. As shown in Figure 8A and 8C, GO enrichment revealed that these DEGs were mainly enriched in “response to chemokine” and “chemokine-mediated signaling pathway” chemokine-mediated signaling pathways. KEGG enrichment showed significant enrichment of “viral protein interaction with cytokine and cytokine receptor” and “NF-kappa B signaling pathway” (Figure 8B and 8D). GSEA was performed to evaluate the different pathways between the low- and high-risk groups. Results showed that “cell cycle,” “progesterone mediated oocyte maturation,” “homologous recombination,” “steroid biosynthesis” and “terpenoid backbone biosynthesis” were the top 5 enriched pathways in high-risk group. In the low-risk group, the top five enriched pathways were the “chemokine signaling pathway”, “hematopoietic cell lineage”, “cytokine-cytokine receptor interaction”, “neuroactive ligand receptor interaction, and “primary immunodeficiency” (Figure 8E). In addition, as shown in Figure 8F, from the heatmap of GSVA, significant differences in enriched functions between the low- and high-risk groups were observed.
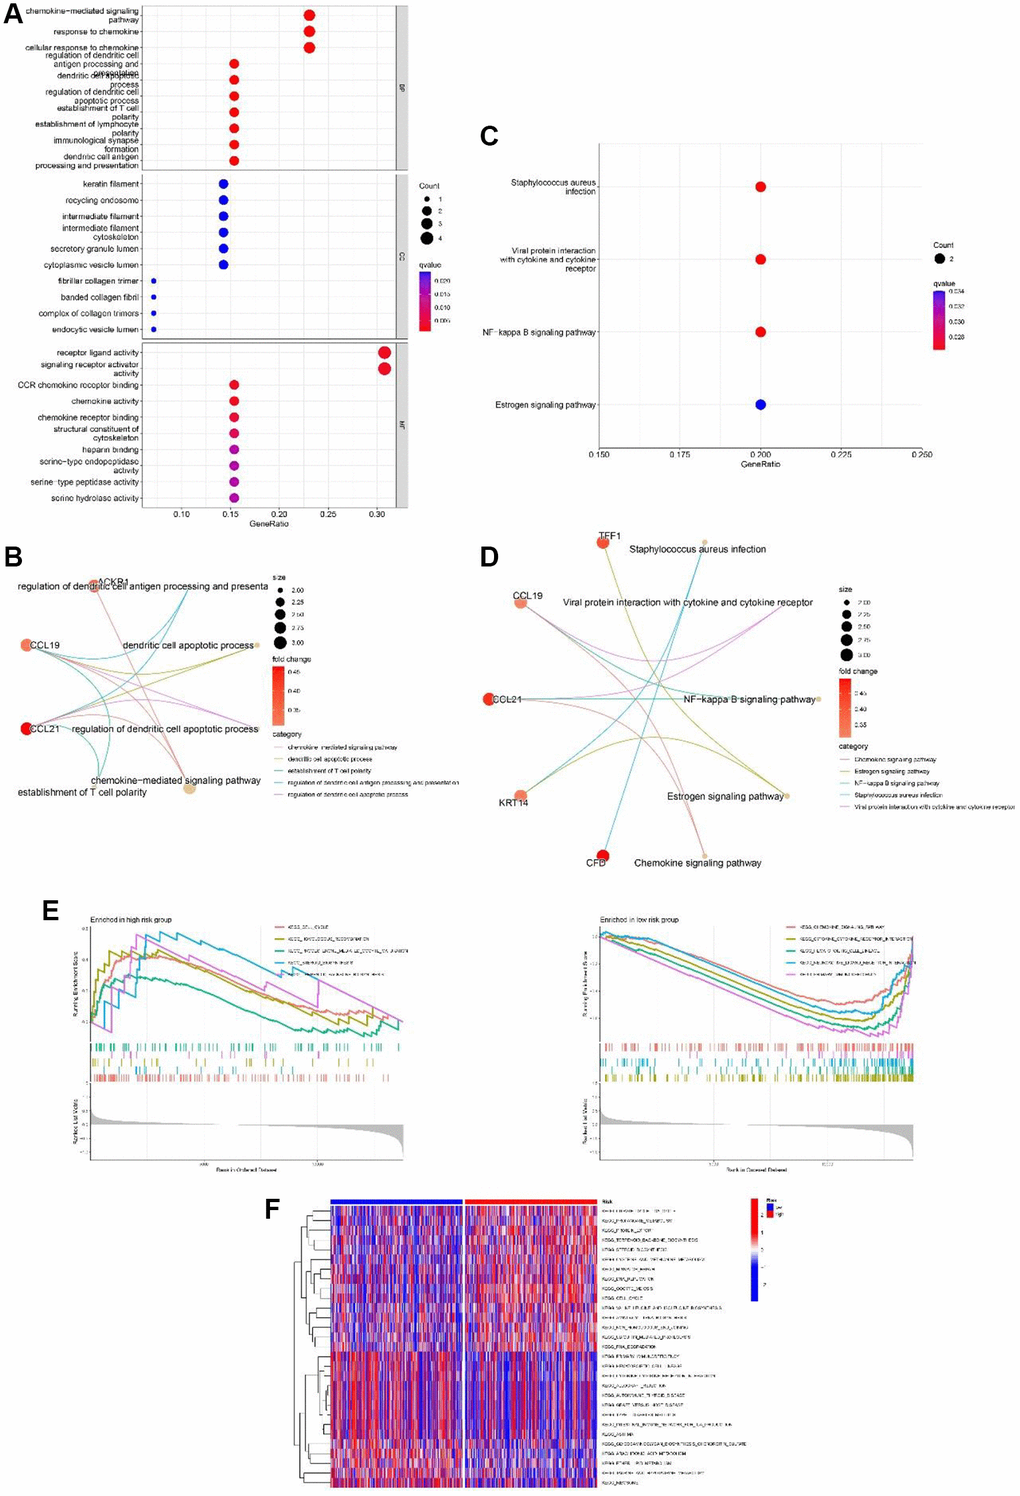
Figure 8. Functional analyses of the 13-gene signature in the TCGA cohort. (A, B) GO enrichment analysis of differentially expressed genes (DEGs) between the high and low-risk group. (C, D) KEGG enrichment analysis of DEGs between the high-risk group and low-risk group. (E) GSEA of high-risk group and low-risk group. (F) Gene set variation analysis (GSVA) of high-risk group and low-risk group.
Comparison of the immune activity among subgroups
Previous studies have shown that TME plays a significant role in tumor development [32, 33]. To investigate the differences in immune-related annotations and immune cell infiltration between subtypes, ssGSEA was performed. As shown in Figure 9A, we assessed the differences in immune cell infiltration between subtypes using seven different algorithms. aDCs, NK cells, Tregs, Th2 cells, and Th1 cells did not differ between the two groups in the TCGA cohort. B cells, DC, iDC, CD4+T cells, mast cells, CD8+T cells, neutrophils, pDC, T helper cells, Tfh, and TIL infiltrated at a greater rate in the low-risk subgroup, while macrophages infiltrated at a greater rate in the high-risk group (Figure 9B). CCR, cytolytic activity, checkpoint, HLA, Type II IFN response, MHC class I, parainflammation, T cell co-stimulation, and inflammation promotion were usually more significant in the low-risk group (Figure 9C). Similar results were observed in the GEO cohort (Figure 9D and 9E).
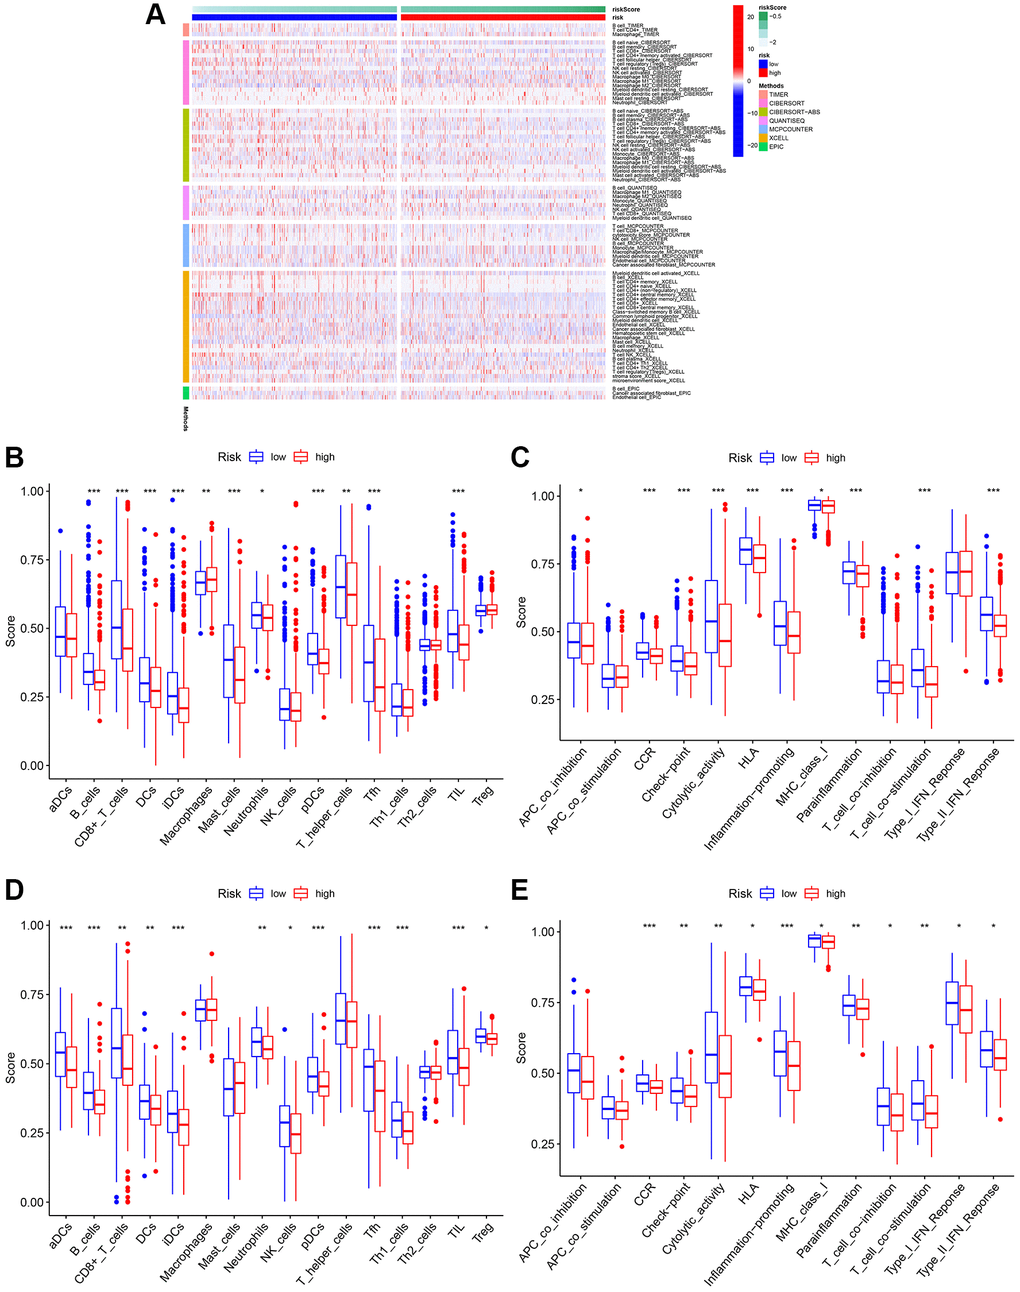
Figure 9. Analysis of immune cell infiltration. (A) Heatmap of immune cell infiltration. (B) Boxplot of immune cell infiltration in TCGA cohort. (C) Boxplot of immune function in TCGA cohort. (D) Boxplot of immune cell infiltration in GSE20685. (E) Boxplot of immune function in GSE20685.
Predicting sensitivity to chemotherapy drugs
Currently, chemotherapy remains the mainstay of adjuvant therapy for the treatment of patients with BC [34, 35]. However, many patients are prone to develop resistance to chemotherapy drugs. In the current study, we predicted the response of subgroups to certain chemotherapy drugs (Figure 10). The results revealed that high-risk BC patients showed higher sensitivity to AKT inhibitor VIII, JNK inhibitor VIII, and rapamycin, suggesting that high-risk patients can benefit from therapeutic agents. Additionally, we found that high-risk BC patients had higher estimated IC50s for five chemotherapy drugs (5-Fluorouracil, doxorubicin, erlotinib, GSK-650394, and salubrinal) than that of low-risk BC patients.
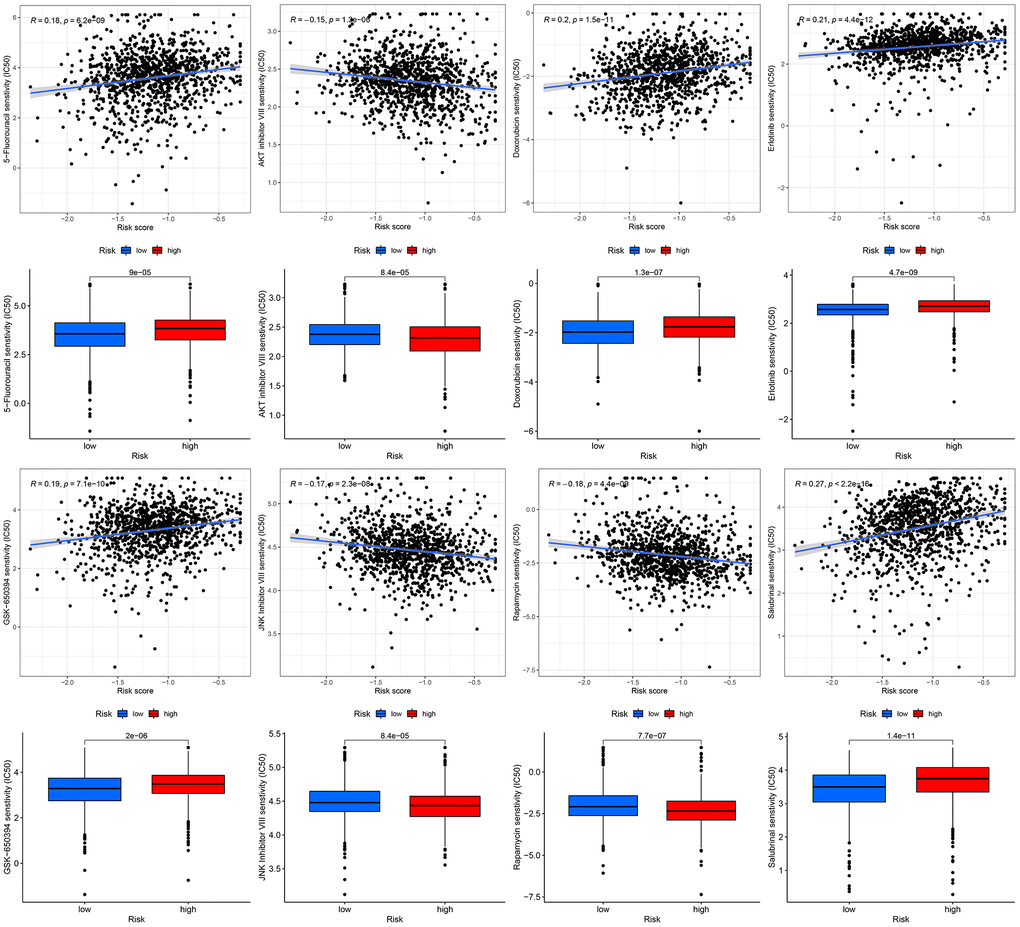
Figure 10. Chemotherapeutic response-prediction of the 13-gene signature.
Discussion
Dysregulated gene expression in BC tissues has been extensively investigated. Cancer cells can selectively suppress or increase specific mRNA translation to promote tumor development and metastasis, leading to poor survival of cancer patients [36]. However, there is still no clear understanding of how BC develops and progresses. A new prognostic signature for BC patients, and clarification of potential mechanisms need to be identified. Mitophagy is a type of selective autophagy in which mitochondria are selectively cleared by the autophagy pathway [37, 38]. Mitophagy is critical for intracellular environmental stability, and cells use this mechanism to eliminate mitochondrial dysfunction or reduce the number of mitochondria [39, 40]. Mitophagy can be mediated by a variety of molecular mechanisms such as PINK1 the Parkin, NIX, and FundC1 pathways. Mitophagy disorder leads to a variety of cancers, including rectal cancer, lung cancer, and BC. Deng et al. found that degradation of ULK1 inhibits mitophagy and promotes BC bone metastasis [12]. However, the role of mitophagy in BC has not been fully established. In the present study, we built a 13-gene signature based on DEGs of mitophagy-related tumor classification as a novel biomarker for the prognosis of BC and developed a comprehensive analysis of the signature's value for determining risk stratification, chemotherapy response, and immune activity in patients with BC.
Our 13-gene (ADAM9, MAL2, CLEC3A, TNFRSF14, RELB, SEMA3B, IGFALS, CEBPD, KRTCAP3, CCL19, CHAD, KRT5, and LTF) signature based on DEGs of mitophagy-related tumor classification was conducted for BC. These genes play important roles in various cancers including BC. Xu et al. reported that the circNINL/miR-921 axis could upregulate the expression of ADAM9, the direct target of miR-921, and activate β-catenin signaling to promote the progression of BC [41]. Jun et al. discovered that CLEC3A promotes tumor progression and poor prognosis in BC via the PI3K/AKT signaling pathway [42]. Besides, Fang et al. showed that MAL2 suppresses tumor antigen presentation and drives immune evasion in BC [43]. Additionally, Zhou et al. revealed that ADAM9 may mediate BC progression via AKT/NF-kB signaling [44]. Although these genes are still unknown, we demonstrated their prognostic capacity in BC and confirmed the poor outcome of high-risk BC identified by the signature calculated using gene expression.
The 13 gene signature showed a significant correlation with BC OS when analyzed via univariate Cox. The K–M analysis found that a higher risk score for BC was associated with a poorer prognosis. Meanwhile, our signature was demonstrated to be a reliable prognostic indicator for patients with BC using multivariate Cox regression analysis. ROC curve analysis confirmed the robust predictive capacity of our model. A nomogram was constructed using a 13-gene signature and clinical characteristics. The calibration curves of 1-, 3-, and 5-year survival rates indicated the accuracy of predicting survival probabilities for BC, which illustrated that our nomogram was an excellent predictor. With the development of bioinformatics, accumulating tools have identified various specific genes related to diverse cellular processes. As a disease that is strongly associated with genetic abnormalities, the genome of BC is valuable for exploration. A large body of literature has reported good bioinformatics tools for BC, such as depression-related models, angiogenesis-related models, or lactate metabolism-related models [45–47]. However, no mitophagy-related signature of BC has been studied, which in our study showed excellent prognostic ability and was related to distinct immune cell infiltration patterns.
Next, we performed a functional analysis of DEGs between the high- and low-risk subtypes to explore the putative pathways and functions of the 13-gene signature. GO enrichment revealed these DEGs were related with “chemokine-mediated signaling pathway” and “response to chemokine”. Chemokines are signal proteins or small cytokines that enhance the antitumor immune response by recruiting nearby immune cells [48]. For example, B cells can be activated by CXCR5, and T and NK cells can be induced to be enriched in tumors by CXCL9/10/11 [49]. Previous evidence has confirmed the vital roles of chemokines in the progression of BC, such as the overexpression of chemokines in mammary fibroblasts regulated by MEKK1, which can form a TME that supports the migration of BC cells [50], as well as the promotion of migration of ING4-deficient BC cells induced by CXCL10 chemokines [51]. Furthermore, previous studies have reported that chemokines are closely related to M1/M2 polarization, which can further promote tumor development [52]. Our GO analysis revealed a possible connection between chemokines, TME, and BC progression.
KEGG enrichment showed significant enrichment of “viral protein interaction with cytokine and cytokine receptor” and “NF-kappa B signaling pathway”. Research of M.SR et al. suggests NF-kB plays an essential role in antitumor immunity. NF-kB is important for the formation of B lymphoid tissues and for the differentiation and maturation of B cells. Malfunctioning of NF-kB may decrease immunogenicity owing to the multifaceted role of this transcription factor in immunity [53]. Abundant evidence has demonstrated the positive functions of the NF-kB signaling pathway in promoting BC progression. Interestingly, Yi et al. reported that lncRNA lnc-SLC4A1-1 can induce BC development by activating the CXCL8 and NF-kB signaling pathways [54]. Combined with our functional enrichment analysis, we propose that there must be some crosstalk between chemokines, the NF-kB signaling pathway, and BC. Subsequently, we explored whether there was a connection between mitophagy, NF-kB, and BC. However, this connection has not yet been explored but we obtained some interesting findings. Zhao et al. reported that metformin could rescue mitophagy in high glucose-challenged human renal epithelial cells by downregulating the NF-kB signaling pathway [55]. Further studies will be conducted to address these questions. In addition, the GSEA results showed that “cell cycle” and “homologous recombination” were enriched pathways in the high-risk group. In the low-risk group, the top 5 enriched pathways were “cytokine-cytokine receptor interaction,” “neuroactive ligand receptor interaction,” “hematopoietic cell lineage,” “chemokine signaling pathway” and “primary immunodeficiency”. These results suggest that the 13 genes might influence the tumorigenesis and progression of BC through immune and tumor-related signaling pathways.
TME plays a vital role in BC immunotherapy [56, 57]. Analysis of TME may help us to better understand how mitophagy influences the outcomes of patients with BC. Therefore, we assessed the proportion of various immune cells in BC using six commonly used algorithms. In low-risk patients, the TME was significantly infiltrated by B cells, DC, iDC, CD4+T cells, mast cells, CD8+T cells, neutrophils, pDC, T helper cells, Tfh, and TIL. These immune cells can affect BC development by regulating the antitumor immune response. Further studies revealed that CCR, MHC class I, checkpoint, cytolytic activity, HLA, parainflammation, T cell co-stimulation, inflammation promotion, and type II IFN response were enriched in the low-risk group. In addition, we evaluated the effectiveness of certain chemotherapies for different subtypes of BC. The results revealed that low-risk patients had lower estimated IC50s for five chemotherapy drugs (5-Fluorouracil, doxorubicin, erlotinib, GSK-650394, and salbrinal) than that of high-risk patients. Moreover, high-risk patients were more sensitive to AKT inhibitor VIII, JNK inhibitor VIII, and rapamycin, suggesting that high-risk patients can benefit from these chemotherapeutic agents. These results have the potential to guide therapy selection for each patient with BC.
Our study provides an exhaustive summary of all the possible mechanisms and gene alterations of the 13-gene signature based on DEGs of mitophagy-related tumor classification in BC, provides a solid foundation for future research, and can guide prognostic biomarkers of therapeutic strategies for patients with BC.
Supplementary Materials
Author Contributions
YA.Z., YJ.Z., C.D., YY. G. designed the study and drafted the manuscript. K.H., YJ.Z., YA.Z., YY. G. wrote the manuscript. YA.Z., C.D. and YJ. Z. searched for publications and collected the data. C.D., YA.Z., K.H., YY.G. analyzed the data. The final manuscript was reviewed by all authors and approved for publication.
Acknowledgments
We thank all the members who contributed to this study.
Conflicts of Interest
The authors declare no conflicts of interest related to this study.
References
- 1. Chen B, Erickson LA. Metaplastic Breast Cancer. Mayo Clin Proc. 2021; 96:2498–9. https://doi.org/10.1016/j.mayocp.2021.07.007 [PubMed]
- 2. Loibl S, Poortmans P, Morrow M, Denkert C, Curigliano G. Breast cancer. Lancet. 2021; 397:1750–69. https://doi.org/10.1016/S0140-6736(20)32381-3 [PubMed]
- 3. Waks AG, Winer EP. Breast Cancer Treatment. JAMA. 2019; 321:316. https://doi.org/10.1001/jama.2018.20751 [PubMed]
- 4. Yeo SK, Guan JL. Breast Cancer: Multiple Subtypes within a Tumor? Trends Cancer. 2017; 3:753–60. https://doi.org/10.1016/j.trecan.2017.09.001 [PubMed]
- 5. Nicolini A, Ferrari P, Duffy MJ. Prognostic and predictive biomarkers in breast cancer: Past, present and future. Semin Cancer Biol. 2018; 52:56–73. https://doi.org/10.1016/j.semcancer.2017.08.010 [PubMed]
- 6. DeSantis CE, Ma J, Gaudet MM, Newman LA, Miller KD, Goding Sauer A, Jemal A, Siegel RL. Breast cancer statistics, 2019. CA Cancer J Clin. 2019; 69:438–51. https://doi.org/10.3322/caac.21583 [PubMed]
- 7. Welch HG, Prorok PC, O'Malley AJ, Kramer BS. Breast-Cancer Tumor Size, Overdiagnosis, and Mammography Screening Effectiveness. N Engl J Med. 2016; 375:1438–47. https://doi.org/10.1056/NEJMoa1600249 [PubMed]
- 8. Onishi M, Yamano K, Sato M, Matsuda N, Okamoto K. Molecular mechanisms and physiological functions of mitophagy. EMBO J. 2021; 40:e104705. https://doi.org/10.15252/embj.2020104705 [PubMed]
- 9. Killackey SA, Philpott DJ, Girardin SE. Mitophagy pathways in health and disease. J Cell Biol. 2020; 219:e202004029. https://doi.org/10.1083/jcb.202004029 [PubMed]
- 10. Song Y, Zhou Y, Zhou X. The role of mitophagy in innate immune responses triggered by mitochondrial stress. Cell Commun Signal. 2020; 18:186. https://doi.org/10.1186/s12964-020-00659-x [PubMed]
- 11. Cho DH, Kim JK, Jo EK. Mitophagy and Innate Immunity in Infection. Mol Cells. 2020; 43:10–22. https://doi.org/10.14348/molcells.2020.2329 [PubMed]
- 12. Deng R, Zhang HL, Huang JH, Cai RZ, Wang Y, Chen YH, Hu BX, Ye ZP, Li ZL, Mai J, Huang Y, Li X, Peng XD, et al. MAPK1/3 kinase-dependent ULK1 degradation attenuates mitophagy and promotes breast cancer bone metastasis. Autophagy. 2021; 17:3011–29. https://doi.org/10.1080/15548627.2020.1850609 [PubMed]
- 13. Ritchie ME, Phipson B, Wu D, Hu Y, Law CW, Shi W, Smyth GK. limma powers differential expression analyses for RNA-sequencing and microarray studies. Nucleic Acids Res. 2015; 43:e47. https://doi.org/10.1093/nar/gkv007 [PubMed]
- 14. Chen J, Zhou C, Liu Y. Establishing a cancer driver gene signature-based risk model for predicting the prognoses of gastric cancer patients. Aging (Albany NY). 2022; 14:2383–99. https://doi.org/10.18632/aging.203948 [PubMed]
- 15. Qian X, Tang J, Chu Y, Chen Z, Chen L, Shen C, Li L. A Novel Pyroptosis-Related Gene Signature for Prognostic Prediction of Head and Neck Squamous Cell Carcinoma. Int J Gen Med. 2021; 14:7669–79. https://doi.org/10.2147/IJGM.S337089 [PubMed]
- 16. Wilkerson MD, Hayes DN. ConsensusClusterPlus: a class discovery tool with confidence assessments and item tracking. Bioinformatics. 2010; 26:1572–3. https://doi.org/10.1093/bioinformatics/btq170 [PubMed]
- 17. Frost HR, Amos CI. Gene set selection via LASSO penalized regression (SLPR). Nucleic Acids Res. 2017; 45:e114. https://doi.org/10.1093/nar/gkx291 [PubMed]
- 18. Dai Q, Ye Y. Development and Validation of a Novel Histone Acetylation-Related Gene Signature for Predicting the Prognosis of Ovarian Cancer. Front Cell Dev Biol. 2022; 10:793425. https://doi.org/10.3389/fcell.2022.793425 [PubMed]
- 19. Zou KH, O'Malley AJ, Mauri L. Receiver-operating characteristic analysis for evaluating diagnostic tests and predictive models. Circulation. 2007; 115:654–7. https://doi.org/10.1161/CIRCULATIONAHA.105.594929 [PubMed]
- 20. Ringnér M. What is principal component analysis? Nat Biotechnol. 2008; 26:303–4. https://doi.org/10.1038/nbt0308-303 [PubMed]
- 21. Belkina AC, Ciccolella CO, Anno R, Halpert R, Spidlen J, Snyder-Cappione JE. Automated optimized parameters for T-distributed stochastic neighbor embedding improve visualization and analysis of large datasets. Nat Commun. 2019; 10:5415. https://doi.org/10.1038/s41467-019-13055-y [PubMed]
- 22. Rich JT, Neely JG, Paniello RC, Voelker CC, Nussenbaum B, Wang EW. A practical guide to understanding Kaplan-Meier curves. Otolaryngol Head Neck Surg. 2010; 143:331–6. https://doi.org/10.1016/j.otohns.2010.05.007 [PubMed]
- 23. Iasonos A, Schrag D, Raj GV, Panageas KS. How to build and interpret a nomogram for cancer prognosis. J Clin Oncol. 2008; 26:1364–70. https://doi.org/10.1200/JCO.2007.12.9791 [PubMed]
- 24. Van Calster B, Wynants L, Verbeek JFM, Verbakel JY, Christodoulou E, Vickers AJ, Roobol MJ, Steyerberg EW. Reporting and Interpreting Decision Curve Analysis: A Guide for Investigators. Eur Urol. 2018; 74:796–804. https://doi.org/10.1016/j.eururo.2018.08.038 [PubMed]
- 25. Gene Ontology Consortium. Gene Ontology Consortium: going forward. Nucleic Acids Res. 2015; 43:D1049–56. https://doi.org/10.1093/nar/gku1179 [PubMed]
- 26. Kanehisa M, Goto S. KEGG: kyoto encyclopedia of genes and genomes. Nucleic Acids Res. 2000; 28:27–30. https://doi.org/10.1093/nar/28.1.27 [PubMed]
- 27. Subramanian A, Tamayo P, Mootha VK, Mukherjee S, Ebert BL, Gillette MA, Paulovich A, Pomeroy SL, Golub TR, Lander ES, Mesirov JP. Gene set enrichment analysis: a knowledge-based approach for interpreting genome-wide expression profiles. Proc Natl Acad Sci U S A. 2005; 102:15545–50. https://doi.org/10.1073/pnas.0506580102 [PubMed]
- 28. Perou CM, Sørlie T, Eisen MB, van de Rijn M, Jeffrey SS, Rees CA, Pollack JR, Ross DT, Johnsen H, Akslen LA, Fluge O, Pergamenschikov A, Williams C, et al. Molecular portraits of human breast tumours. Nature. 2000; 406:747–52. https://doi.org/10.1038/35021093 [PubMed]
- 29. Yu G, Wang LG, Han Y, He QY. clusterProfiler: an R package for comparing biological themes among gene clusters. OMICS. 2012; 16:284–7. https://doi.org/10.1089/omi.2011.0118 [PubMed]
- 30. Xiao B, Liu L, Li A, Xiang C, Wang P, Li H, Xiao T. Identification and Verification of Immune-Related Gene Prognostic Signature Based on ssGSEA for Osteosarcoma. Front Oncol. 2020; 10:607622. https://doi.org/10.3389/fonc.2020.607622 [PubMed]
- 31. Xiang R, Fu J, Ge Y, Ren J, Song W, Fu T. Identification of Subtypes and a Prognostic Gene Signature in Colon Cancer Using Cell Differentiation Trajectories. Front Cell Dev Biol. 2021; 9:705537. https://doi.org/10.3389/fcell.2021.705537 [PubMed]
- 32. Lundberg A, Li B, Li R. B cell-related gene signature and cancer immunotherapy response. Br J Cancer. 2022; 126:899–906. https://doi.org/10.1038/s41416-021-01674-6 [PubMed]
- 33. Chen Y, Lee K, Liang Y, Qin S, Zhu Y, Liu J, Yao S. A Cholesterol Homeostasis-Related Gene Signature Predicts Prognosis of Endometrial Cancer and Correlates With Immune Infiltration. Front Genet. 2021; 12:763537. https://doi.org/10.3389/fgene.2021.763537 [PubMed]
- 34. Liu W, Zhang J, Xie T, Huang X, Wang B, Tian Y, Yuan Y. C1QTNF6 is a Prognostic Biomarker and Related to Immune Infiltration and Drug Sensitivity: A Pan-Cancer Analysis. Front Pharmacol. 2022; 13:855485. https://doi.org/10.3389/fphar.2022.855485 [PubMed]
- 35. Li R, Yin YH, Ji XL, Liu X, Li JP, Qu YQ. Pan-Cancer Prognostic, Immunity, Stemness, and Anticancer Drug Sensitivity Characterization of N6-Methyladenosine RNA Modification Regulators in Human Cancers. Front Mol Biosci. 2021; 8:644620. https://doi.org/10.3389/fmolb.2021.644620 [PubMed]
- 36. Han H, Yang C, Ma J, Zhang S, Zheng S, Ling R, Sun K, Guo S, Huang B, Liang Y, Wang L, Chen S, Wang Z, et al. N7-methylguanosine tRNA modification promotes esophageal squamous cell carcinoma tumorigenesis via the RPTOR/ULK1/autophagy axis. Nat Commun. 2022; 13:1478. https://doi.org/10.1038/s41467-022-29125-7 [PubMed]
- 37. Qi N, Shi Y, Zhang R, Zhu W, Yuan B, Li X, Wang C, Zhang X, Hou F. Multiple truncated isoforms of MAVS prevent its spontaneous aggregation in antiviral innate immune signalling. Nat Commun. 2017; 8:15676. https://doi.org/10.1038/ncomms15676 [PubMed]
- 38. Zhao Y, Feng X, Li B, Sha J, Wang C, Yang T, Cui H, Fan H. Dexmedetomidine Protects Against Lipopolysaccharide-Induced Acute Kidney Injury by Enhancing Autophagy Through Inhibition of the PI3K/AKT/mTOR Pathway. Front Pharmacol. 2020; 11:128. https://doi.org/10.3389/fphar.2020.00128 [PubMed]
- 39. De Luna N, Turon-Sans J, Cortes-Vicente E, Carrasco-Rozas A, Illán-Gala I, Dols-Icardo O, Clarimón J, Lleó A, Gallardo E, Illa I, Rojas-García R. Downregulation of miR-335-5P in Amyotrophic Lateral Sclerosis Can Contribute to Neuronal Mitochondrial Dysfunction and Apoptosis. Sci Rep. 2020; 10:4308. https://doi.org/10.1038/s41598-020-61246-1 [PubMed]
- 40. Vacek JC, Behera J, George AK, Kamat PK, Kalani A, Tyagi N. Tetrahydrocurcumin ameliorates homocysteine-mediated mitochondrial remodeling in brain endothelial cells. J Cell Physiol. 2018; 233:3080–92. https://doi.org/10.1002/jcp.26145 [PubMed]
- 41. Xu C, Yu H, Yin X, Zhang J, Liu C, Qi H, Liu P. Circular RNA circNINL promotes breast cancer progression through activating β-catenin signaling via miR-921/ADAM9 axis. J Biochem. 2021; 169:693–700. https://doi.org/10.1093/jb/mvab005 [PubMed]
- 42. Ni J, Peng Y, Yang FL, Xi X, Huang XW, He C. Overexpression of CLEC3A promotes tumor progression and poor prognosis in breast invasive ductal cancer. Onco Targets Ther. 2018; 11:3303–12. https://doi.org/10.2147/OTT.S161311 [PubMed]
- 43. Fang Y, Wang L, Wan C, Sun Y, Van der Jeught K, Zhou Z, Dong T, So KM, Yu T, Li Y, Eyvani H, Colter AB, Dong E, et al. MAL2 drives immune evasion in breast cancer by suppressing tumor antigen presentation. J Clin Invest. 2021; 131:140837. https://doi.org/10.1172/JCI140837 [PubMed]
- 44. Zhou R, Cho WCS, Ma V, Cheuk W, So YK, Wong SCC, Zhang M, Li C, Sun Y, Zhang H, Chan LWC, Tian M. ADAM9 Mediates Triple-Negative Breast Cancer Progression via AKT/NF-κB Pathway. Front Med (Lausanne). 2020; 7:214. https://doi.org/10.3389/fmed.2020.00214 [PubMed]
- 45. Wang X, Wang N, Zhong LLD, Su K, Wang S, Zheng Y, Yang B, Zhang J, Pan B, Yang W, Wang Z. Development and Validation of a Risk Prediction Model for Breast Cancer Prognosis Based on Depression-Related Genes. Front Oncol. 2022; 12:879563. https://doi.org/10.3389/fonc.2022.879563 [PubMed]
- 46. Ren H, Zhu J, Yu H, Bazhin AV, Westphalen CB, Renz BW, Jacob SN, Lampert C, Werner J, Angele MK, Bösch F. Angiogenesis-Related Gene Expression Signatures Predicting Prognosis in Gastric Cancer Patients. Cancers (Basel). 2020; 12:3685. https://doi.org/10.3390/cancers12123685 [PubMed]
- 47. Yang L, Tan P, Sun H, Zeng Z, Pan Y. Integrative Dissection of Novel Lactate Metabolism-Related Signature in the Tumor Immune Microenvironment and Prognostic Prediction in Breast Cancer. Front Oncol. 2022; 12:874731. https://doi.org/10.3389/fonc.2022.874731 [PubMed]
- 48. Marcuzzi E, Angioni R, Molon B, Calì B. Chemokines and Chemokine Receptors: Orchestrating Tumor Metastasization. Int J Mol Sci. 2018; 20:96. https://doi.org/10.3390/ijms20010096 [PubMed]
- 49. Lin A, Xu W, Luo P, Zhang J. Mutations Status of Chemokine Signaling Pathway Predict Prognosis of Immune Checkpoint Inhibitors in Colon Adenocarcinoma. Front Pharmacol. 2021; 12:721181. https://doi.org/10.3389/fphar.2021.721181 [PubMed]
- 50. Gentile S, Eskandari N, Rieger MA, Cuevas BD. MEKK1 Regulates Chemokine Expression in Mammary Fibroblasts: Implications for the Breast Tumor Microenvironment. Front Oncol. 2021; 11:609918. https://doi.org/10.3389/fonc.2021.609918 [PubMed]
- 51. Tsutsumi E, Stricklin J, Peterson EA, Schroeder JA, Kim S. Cxcl10 Chemokine Induces Migration of ING4-Deficient Breast Cancer Cells via a Novel Cross Talk Mechanism between the Cxcr3 and Egfr Receptors. Mol Cell Biol. 2022; 42:e0038221. https://doi.org/10.1128/MCB.00382-21 [PubMed]
- 52. Xuan W, Qu Q, Zheng B, Xiong S, Fan GH. The chemotaxis of M1 and M2 macrophages is regulated by different chemokines. J Leukoc Biol. 2015; 97:61–9. https://doi.org/10.1189/jlb.1A0314-170R [PubMed]
- 53. Zinatizadeh MR, Schock B, Chalbatani GM, Zarandi PK, Jalali SA, Miri SR. The Nuclear Factor Kappa B (NF-kB) signaling in cancer development and immune diseases. Genes Dis. 2020; 8:287–97. https://doi.org/10.1016/j.gendis.2020.06.005 [PubMed]
- 54. Yi T, Zhou X, Sang K, Huang X, Zhou J, Ge L. Activation of lncRNA lnc-SLC4A1-1 induced by H3K27 acetylation promotes the development of breast cancer via activating CXCL8 and NF-kB pathway. Artif Cells Nanomed Biotechnol. 2019; 47:3765–73. https://doi.org/10.1080/21691401.2019.1664559 [PubMed]
- 55. Zhao Y, Sun M. Metformin rescues Parkin protein expression and mitophagy in high glucose-challenged human renal epithelial cells by inhibiting NF-κB via PP2A activation. Life Sci. 2020; 246:117382. https://doi.org/10.1016/j.lfs.2020.117382 [PubMed]
- 56. Jin P, Zhao Y, Liu H, Chen J, Ren J, Jin J, Bedognetti D, Liu S, Wang E, Marincola F, Stroncek D. Interferon-γ and Tumor Necrosis Factor-α Polarize Bone Marrow Stromal Cells Uniformly to a Th1 Phenotype. Sci Rep. 2016; 6:26345. https://doi.org/10.1038/srep26345 [PubMed]
- 57. Su T, Yang B, Gao T, Liu T, Li J. Polymer nanoparticle-assisted chemotherapy of pancreatic cancer. Ther Adv Med Oncol. 2020; 12:1758835920915978. https://doi.org/10.1177/1758835920915978 [PubMed]