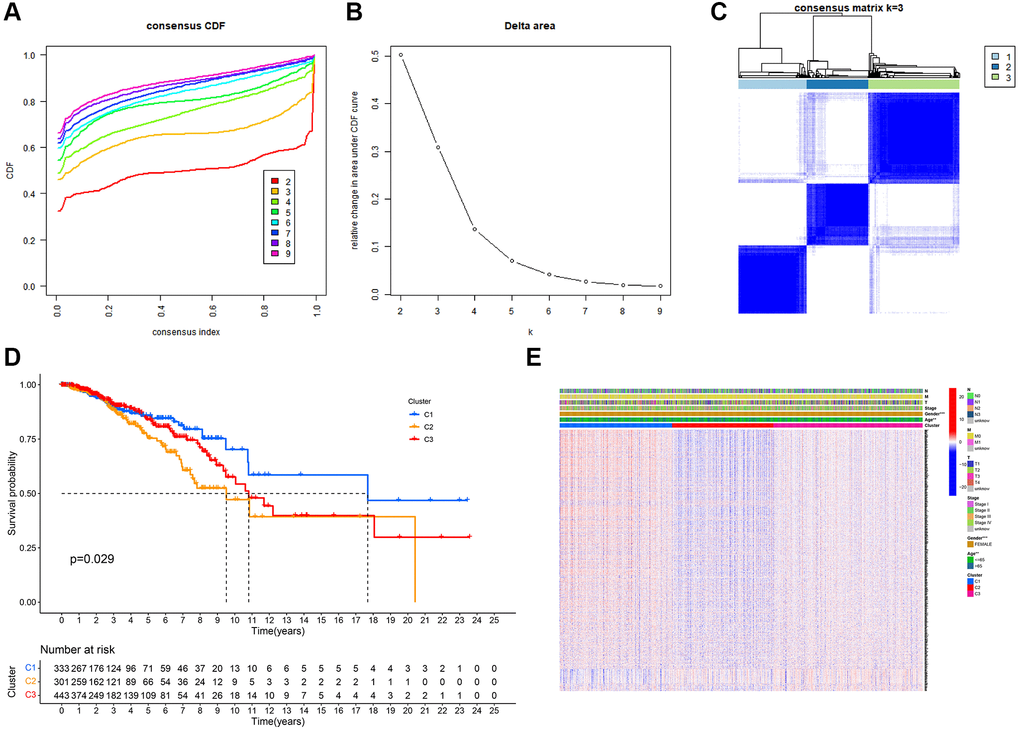
Figure 2.Tumor classification based on mitophagy-related genes (MRGs). (A) Cumulative distribution function (CDF) curves. (B) Delta area curve of consensus clustering. (C) Consensus clustering matrix. (D) Kaplan–Meier (K–M) survival analysis of the three subgroups. (E) Heatmap of DEG expression profiles in three subgroups.