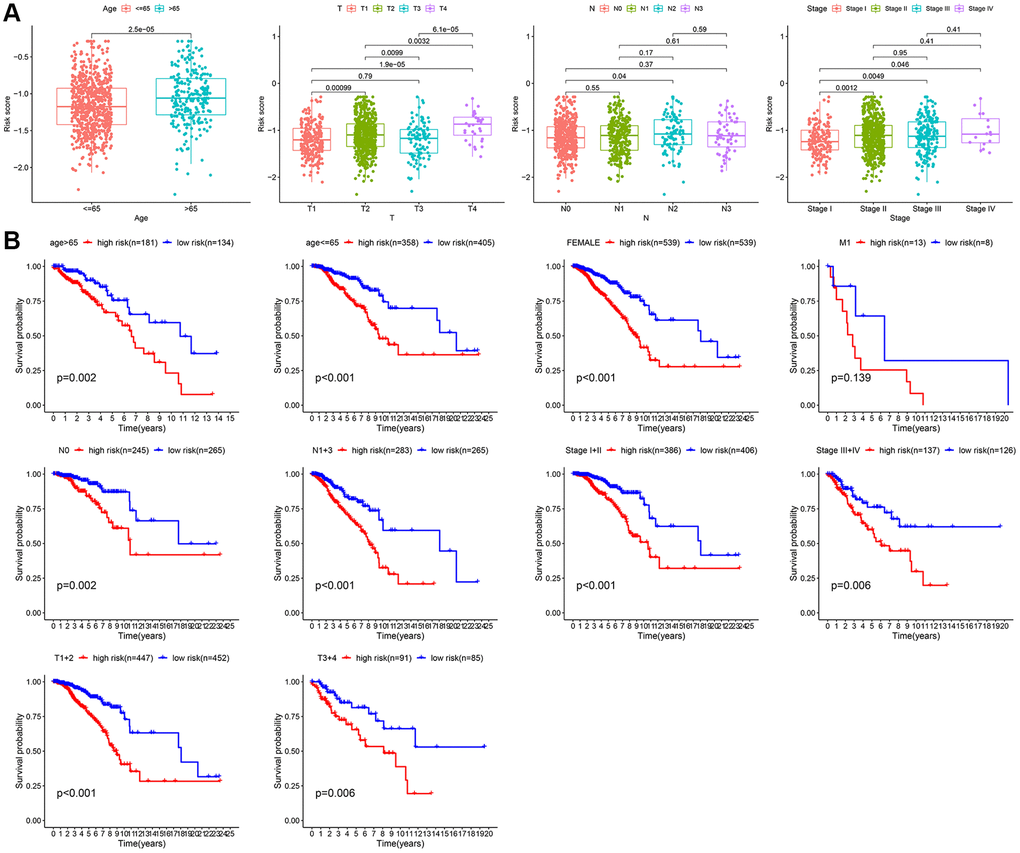
Figure 6.Subgroup analysis of the risk score. (A) Correlation of risk models with clinical characteristics. (B) Survival analysis between two risk subgroups during clinical subgroups.
Figure 6 — A signature constructed with mitophagy-related genes to predict the prognosis and therapy response for breast cancer | Aging