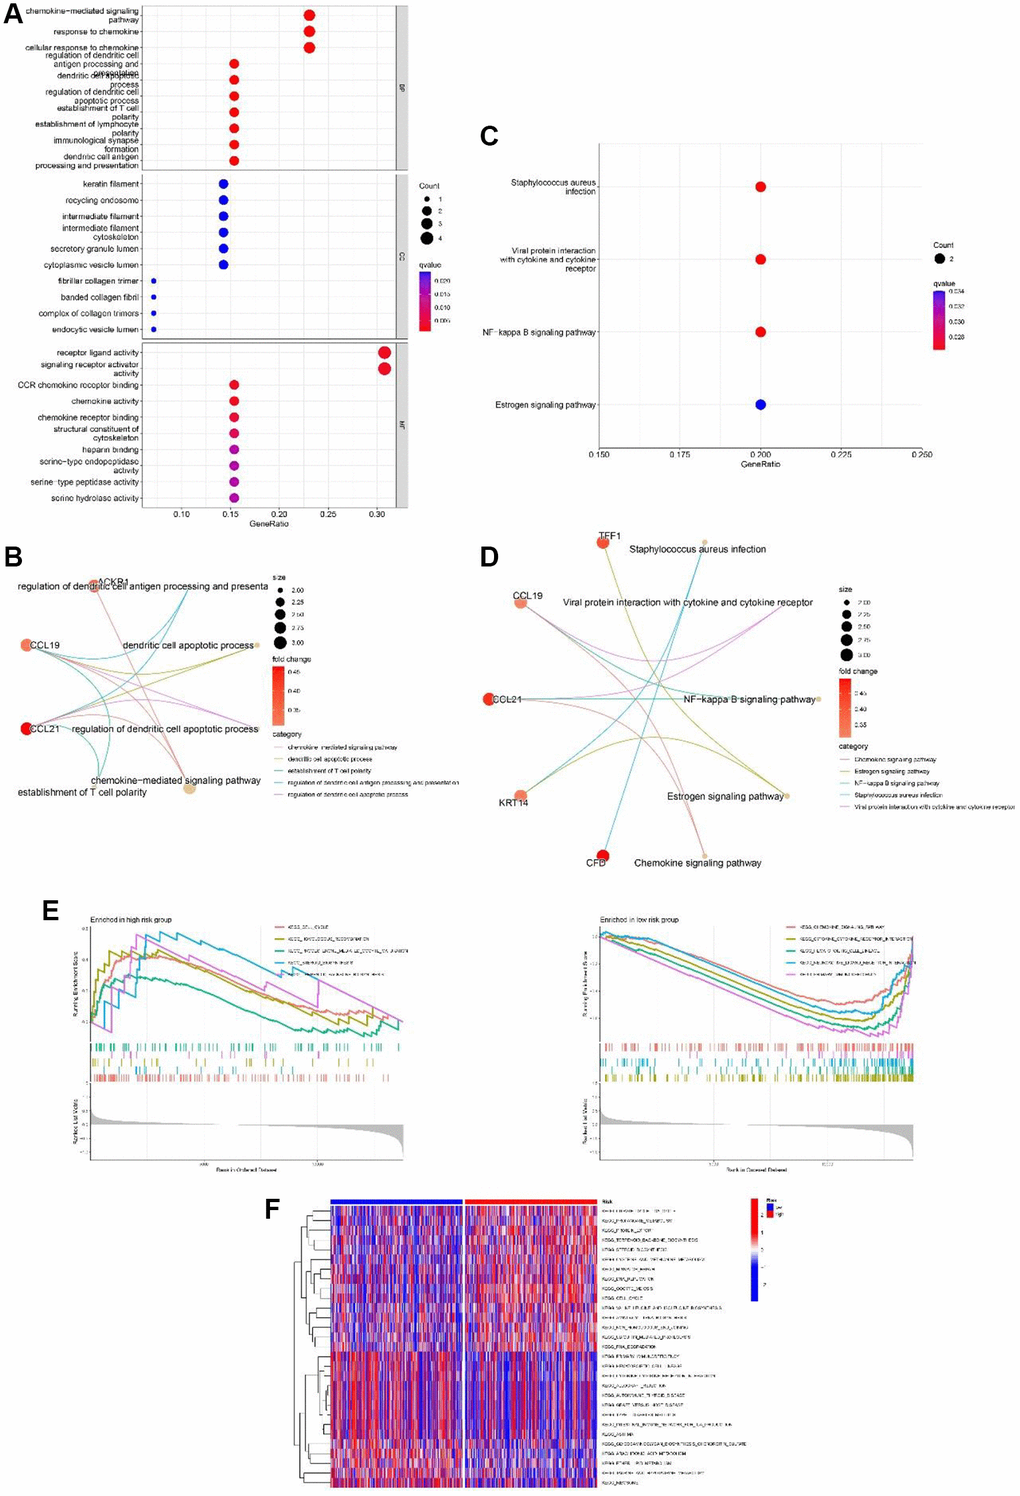
Figure 8.Functional analyses of the 13-gene signature in the TCGA cohort. (A, B) GO enrichment analysis of differentially expressed genes (DEGs) between the high and low-risk group. (C, D) KEGG enrichment analysis of DEGs between the high-risk group and low-risk group. (E) GSEA of high-risk group and low-risk group. (F) Gene set variation analysis (GSVA) of high-risk group and low-risk group.