


Introduction
Calorie restriction (CR) is a well-established noninvasive method that reduces the rate of ageing, increases lifespan and delays the onset of age-associated diseases in a wide range of taxa [1–6]. However, the underlying mechanisms by which CR exerts its antiageing effects are still unclear [7]. The response of the brain to CR includes at least three different coordinated processes: (1) development of hunger and co-ordination of food seeking behaviors and circadian rhythms; (2) co-ordination of responses that mobilize body fuel stores and reduce energy expenditure, including physiological and behavioral responses; and (3) an increase in resistance to brain damage and pathology and co-ordination of cellular resistance in the periphery (reviewed in [8]). Hunger signaling and circadian rhythms are both regulated by the hypothalamus and in this paper we explored the responses of these processes to CR.
Food intake is regulated by many neuropeptides and signaling molecules in the hypothalamus which form a complex interacting network. Research over the past two decades, since the discovery of leptin [9], has started to unravel this complex signaling system and identified several key signaling molecules that affect food intake [10,11], with discoveries still emerging [12,13]. Four important neuropeptides involved in hunger signaling are neuropeptide Y (NPY), agoutirelated peptide (AgRP), pro-opiomelanocortin (POMC) and cocaine- and amphetamine-regulated transcript (CART). Increased levels of NPY and AgRP both stimulate food intake, while elevated levels of POMC and CART reduce intake. AgRP/NPY and POMC/CART reside on different neuronal populations in the arcuate nucleus of the hypothalamus [14]. Recent work suggests that AgRP is also intimately involved in hunger related activity patterns [12,13]. Both AgRP/NPY and POMC/CART neuronal types have multiple receptor populations, including both insulin and leptin receptors, which enables them to respond to the nutritional status of the individual. Specifically leptin and insulin stimulates POMC and CART and inhibit AgRP and NPY [15]. Changes in peripheral levels of these hormones have previously been implicated in mediating the effects of CR [16,17].
Previous work in mice exposed to short-term (100 days) CR show altered expression of these key elements of the hunger signaling pathway, including elevated levels of NPY and AgRP and reduced levels of POMC and CART, when compared to ad libitum fed controls [18]. Upon re-feeding, after a period of CR, the hyperphagic response suggests that hunger remained even after energy balance was re-established [18]. This elevated ‘hunger profile’ might be a major factor contributing to the beneficial effects of CR [19]. If this is the case, we would anticipate that, based on the linear relationship between the percentage of CR and the increase in lifespan (reviewed in [6]), a graded increase in the level of CR would lead to graded levels of expression in these four key genes and graded expression of both up and downstream connected components of the intracellular signaling cascades. We therefore also expected genes involved in the leptin, insulin, and other hormonal signaling pathways to be altered in a graded manner and this would be related to the expression of the four key hunger genes (NPY, AgRP, POMC and CART). Furthermore, mice exposed to CR showed specific behavioral changes, such as elevated food anticipatory activity (FAA) within a short time before feeding [20,21], and this FAA is probably regulated by AgRP and POMC [12]. These responses also include a drop in body temperature and the emergence of torpor at 30 % and 40 % CR [22,23].
Food seeking behavior and temperature regulation are under circadian control [24], which is established centrally by the suprachiasmatic nucleus (SCN) located in the hypothalamus [25]. Circadian regulation is linked to metabolic homeostasis, and dysregulation can lead to metabolic diseases [26]. The interaction between circadian rhythms and metabolism is complicated, and many signals contribute to this regulation. Food intake has been found to influence circadian rhythms [26], and SCN cells have insulin, leptin and other hormone receptors [27,28]. Insulin in particular is thought to play an important role as a signaling hormone linking metabolism and circadian rhythms [29,30]. Furthermore circadian rhythms are influenced by age [31]. Older mice lose the ability to synchronize as well with the environment, although the circadian rhythms remain [32]. Desynchronization of circadian rhythms has a negative effect on longevity [33] and CR synchronizes these rhythms in the SCN [24]. This suggests CR might protect against age-associated loss of circadian rhythm synchronization [34]. Therefore, we expected that the response to CR would be to alter the expression of core clock genes, with circulating hormones playing a central role in this modulation.
We hypothesize that peripheral hormone-driven changes in gene expression in the hunger and circadian signaling pathways in the hypothalamus may be fundamental elements of the response to CR, and that these changes could mediate some of the beneficial impacts of CR. We tested these predictions using the hypothalamic transcriptome of mice exposed to different levels of CR. The phenotypic responses of these same mice (body composition, food intake, hormone levels, body temperature, use of torpor and physical activity behavior) have been extensively characterized [22,23,35,36].
Results
Graded CR responses involve biological processes related to circadian rhythms and hunger
In total, 1086 genes of the 14013 genes were identified to have a significantly altered expression in at least one of the CR levels (i.e. 24 hours ad libitum (24AL), 10CR, 20CR, 30CR, 40CR) relative to 12 hours ad libitum (12AL) (Likelihood ratio test p-value < 0.05). The expression profile of these 1086 genes relative to 12AL (log2 fold changes (log FC)) had a similar expression at 10CR, 20CR, 30CR and 40CR (Fig 1).
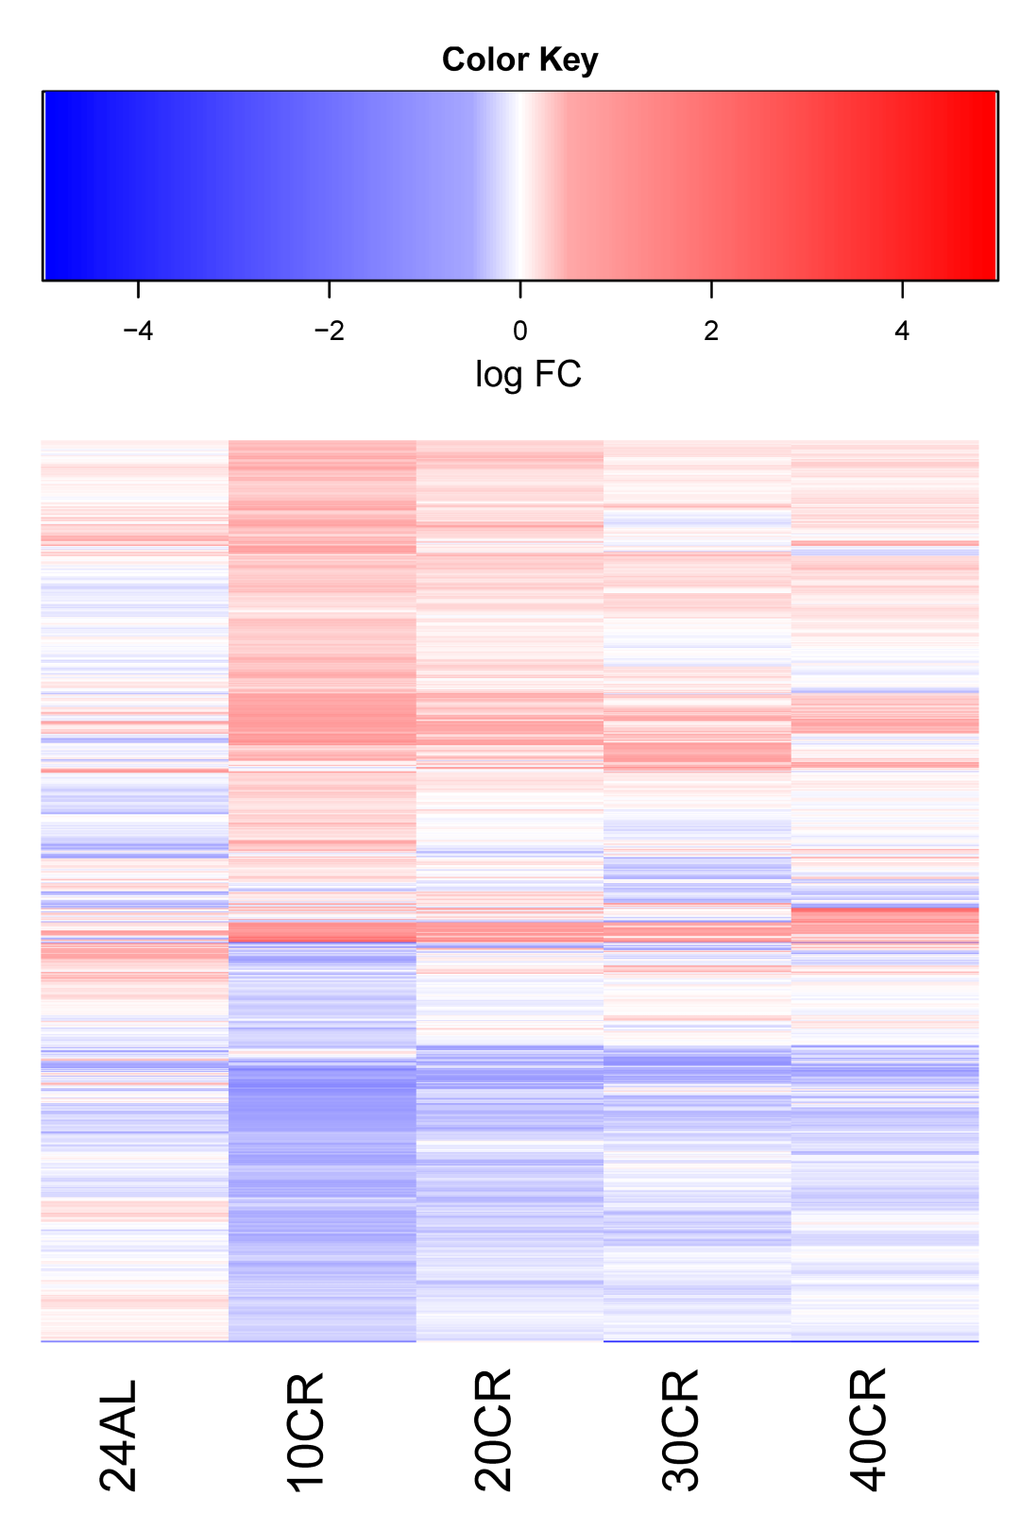
Figure 1. Log Fold change of differentially expressed genes in at least one treatment relative to 12 hour ad libitum feeding (12AL). Blue indicates down-regulation and red upregulation relative to 12AL. 10CR, 20CR, 30CR and 40CR refer to 10 %, 20 %, 30 % and 40 % restriction and 24AL to 24h ad libitum feeding.
Gene Set Enrichment Analysis (GSEA) revealed that these genes were significantly (p-value < 0.05) enriched in 22 biological processes (Fig 2). These processes were related to transport (e.g. ‘amine transport’, ‘neutral amino acid transport’, ‘metal ion transport’), regulation of neurotransmitter levels, cytokine and chemokine mediated signaling pathways, circadian rhythms (‘response to light stimulus’), hunger (‘response to nutrient levels’), metabolism of neurons (e.g. ‘neurogenesis’, ‘neuron development’ and ‘generation of neurons’) and the cell cycle (e.g. ‘negative regulation of cell cycle’ and ‘S phase’).
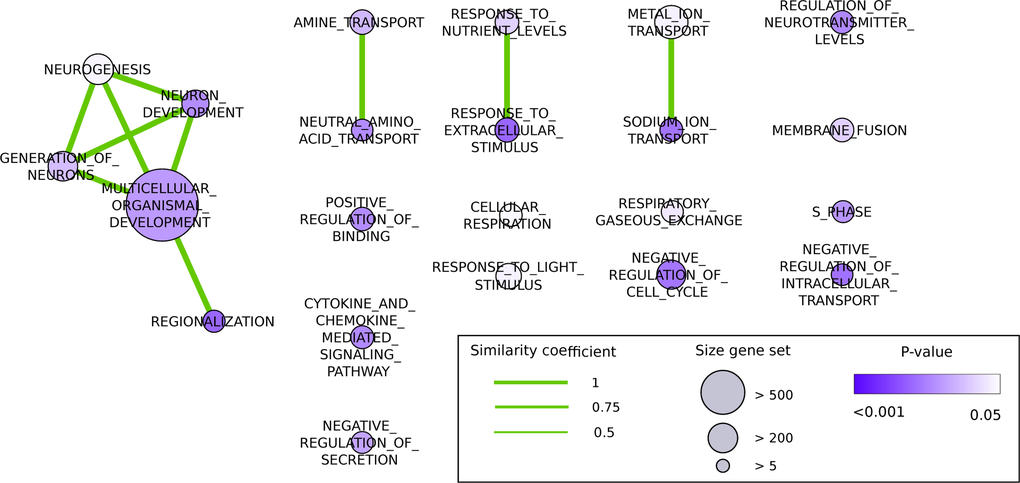
Figure 2. Significantly differentially regulated biological processes after three months of CR treatment, based on genes altered across CR, visualized as an Enrichment map (Cytoscape). The nodes represent biological processes, and edges represent overlap between genes in these processes. The color of the nodes represents the significance according to the p-value (white: p-value = 0.05, purple: p-value < 0.01). The size of the nodes corresponds to the size of the gene set. The width of edges is based on similarity coefficients (> 0.5) between the nodes, derived from the overlap of the gene sets underlying the processes.
Based on the Benjamini Hochberg adjusted p-value (FDR < 0.05) none of the genes were significant at 24AL and 10CR relative to 12AL, 1 gene was significant at 20CR, 2 genes at 30CR and 220 genes at 40CR. Therefore significantly differentially expressed genes (DEGs) were based on a cut off p-value < 0.05 and an absolute log2 fold change (log FC) > 0.5 to 12AL. The number of DEGs relative to 12AL increased as the level of CR increased with exception of 30CR (i.e. for 24AL, 10CR, 20CR, 30CR, 40CR there were 103, 117, 152, 133 and 385 DEGs respectively). Pathway analysis and upstream transcription factor identification for each CR level and 24AL relative to 12AL highlighted a different transcriptomic response for 24AL (Supplemental results).
Graded CR responses involved a negative correlation between genes signaling hunger and circulating hormone levels
We explored the response of key hunger genes (Npy, Agrp, Cartpt and Pomc) to graded CR and how these genes correlated (Pearson correlation) with circulating hormone levels (hormone data from [36]). The expression of genes Npy and Agrp increased relative to CR level; and expression of Cartpt and Pomc decreased relative to CR level (Fig 3A). Npy was significantly upregulated at 10CR, 20CR, 30CR and at 40CR. Agrp was significantly upregulated at 30CR and 40CR. Pomc and Cartpt were significantly downregulated at 40CR (Table 1). Expression levels of Agrp correlated negatively with leptin, insulin and IGF-1. Cartpt correlated positively with leptin and IGF-1. Pomc correlated negatively with resistin and positively with IGF-1. Lastly Npy correlated negatively with leptin, TNF-α, insulin and IGF-1 (Fig 3B and 3C) (Table 2).
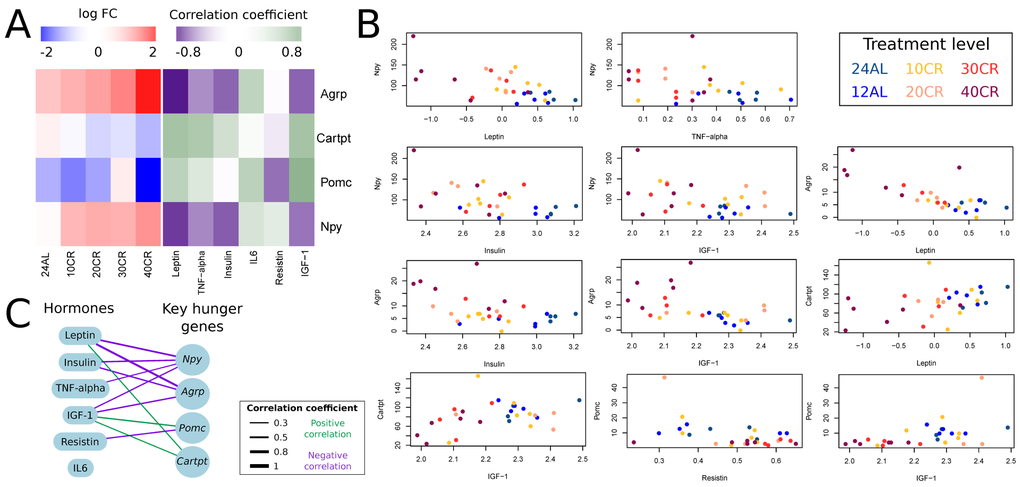
Figure 3. Effect of graded calorie restriction on circulating hormone levels and genes involved in hunger signaling. (A) Genes involved in hunger signaling based on log fold change relative to ad libitum feeding for 12h per day (12AL) and their correlation coefficient with circulating hormone levels. Blue indicates down-regulation and red upregulation relative to 12AL. Purple indicates a negative correlation coefficient and green a positive correlation with circulating hormone levels. 10CR, 20CR, 30CR and 40CR refers to 10 %, 20 %, 30 % and 40 % restriction and 24AL to 24h ad libitum feeding. (B) Expression levels of key hunger genes plotted against circulating hormone levels. Those genes with a significant correlation based on p-value < 0.05 are included in the plot. (C) Overview of key hunger signaling genes correlating with circulating hormone levels. The lines connecting genes and hormones represent correlations and the width of these lines indicates the strength of the correlation coefficient. Green indicates a positive correlation and purple a negative correlation.
Table 1. Expression levels of key hunger genes relative to 12AL
| 24AL | 10CR | 20CR | 30CR | 40CR | ||||||
|---|---|---|---|---|---|---|---|---|---|---|
| logFC | p-value | logFC | p-value | logFC | p-value | logFC | p-value | logFC | p-value | |
| Agrp | 0.509 | 0.352 | 0.670 | 0.202 | 0.823 | 0.139 | 1.078 | 0.050 | 1.992 | <0.001 |
| Cartpt | 0.125 | 0.659 | −0.062 | 0.822 | −0.367 | 0.225 | −0.270 | 0.371 | −0.634 | 0.018 |
| Pomc | −0.694 | 0.338 | −1.104 | 0.115 | −0.789 | 0.303 | 0.169 | 0.822 | −2.242 | 0.001 |
| Npy | 0.028 | 0.922 | 0.628 | 0.022 | 0.719 | 0.015 | 0.675 | 0.022 | 0.947 | <0.001 |
Table 2. Correlations between expression levels of key hunger genes and circulating hormones
| Leptin | TNF-α | Insulin | IL6 | Resistin | IGF-1 | |||||||
|---|---|---|---|---|---|---|---|---|---|---|---|---|
| r | p-value | r | p-value | r | p-value | r | p-value | r | p-value | r | p-value | |
| Agrp | −0.741 | <0.001 | −0.362 | 0.053 | −0.494 | 0.006 | 0.271 | 0.155 | −0.010 | 0.961 | −0.502 | 0.006 |
| Cartpt | 0.382 | 0.041 | 0.340 | 0.071 | 0.200 | 0.298 | 0.025 | 0.899 | −0.071 | 0.715 | 0.384 | 0.039 |
| Pomc | 0.282 | 0.138 | 0.145 | 0.454 | −0.011 | 0.955 | 0.294 | 0.121 | −0.461 | 0.012 | 0.474 | 0.009 |
| Npy | −0.629 | <0.001 | −0.384 | 0.040 | −0.524 | 0.004 | 0.172 | 0.371 | 0.119 | 0.539 | −0.445 | 0.016 |
Hunger signaling extends beyond these key genes and therefore we constructed a hunger signaling pathway based on expert knowledge and curated databases using Ingenuity Pathway Analysis (IPA) software. Downstream from the leptin receptor (Lepr) is the intracellular JAK/STAT signaling pathway, which connects circulating leptin levels to gene expression of Npy, Agrp and Pomc. Insulin and IGF-1 are involved in a parallel nutrient-sensing pathway —the insulin/IGF-1 signaling pathway— and this induces further downstream gene regulation via PI3K and Akt. TNF-α potentially signals via the JAK/STAT signaling pathway via its downstream genes TNF receptor associated factor 4 (Traf4) and PTK2 (protein tyrosine kinase 2 beta, Ptk2b) which is connected with signal transducer and activator of transcription 3 (Stat3) and Janus kinase 2 (Jak2) (Fig 4). Downstream from the main hormone receptors there are connections to melanocortin receptors (e.g. Mc4r – Agrp; Mcr4 – Pomc), dopamine receptors (e.g. Drd1 – Pomc), serotonin receptors (e.g. 5Htr2a – Jak2), thyroid metabolism (e.g. Thr – Htt – Cartpt and Npy), metabolism regulation (e.g. Npy – Foxo1 – Pparg and Sirt1) uncoupling proteins (e.g. Insr – Upc2) and circadian rhythms (e.g. Arntl – Cartpt, Npy and Agrp).
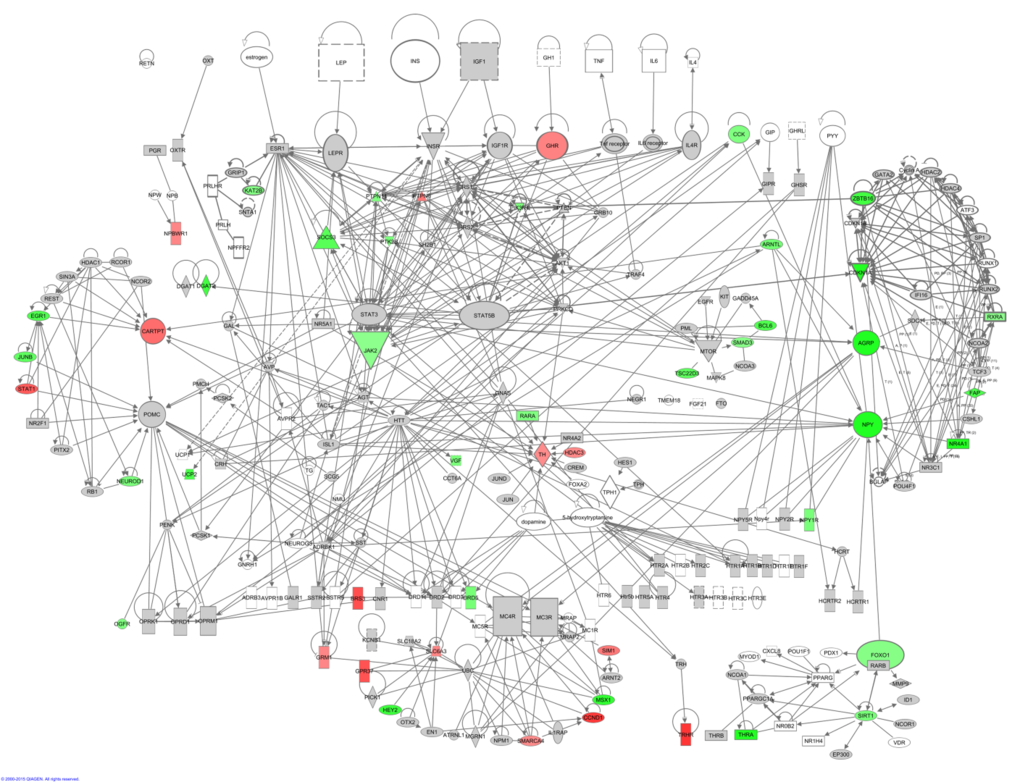
Figure 4. The hunger signaling pathway constructed in the IPA program colored according to genes correlating with circulating leptin levels. Red indicates a positive correlation coefficient and green indicates a negative correlation coefficient. Intensity of the color is related to the strength of the correlation.
This network highlighted that downstream of the hormone receptors, other hunger related genes werecorrelated with peripheral circulating hormone levels. Leptin correlated with genes involved in JAK/STAT signaling, PI3K/AKT signaling, dopamine receptors, 5-HT receptors, thyroid metabolism and Arntl which is involved in circadian rhythms (Figure 4). The correlations between the elements of this hunger signaling pathway and levels of other circulating hormones such as insulin, TNF-α, IGF-1, resistin and IL6 can be found in Figs S1-S5. Principally these athways indicated that lowered IGF-1 was a strong correlate of hunger signaling. In addition, lower levels of TNF-α and insulin showed similar correlation patterns to the decreased levels of leptin. In contrast the pathway.
We also identified several additional hunger related genes that were correlated with circulating hormone levels that were not identified by the IPA database. These included butyrylcholinesterase (Bche), prolylcarboxypeptidase (angiotensinase C) (Prcp), neurotensin (Nts), glucagon-like peptide 1 receptor (Glp1r), glutamate receptor ionotropic NMDA3B (Grin3b), serum/glucocorticoid regulated kinase 1 (Sgk1), bone morphogenetic protein 7 (Bmp7) and adiponectin receptor 2 (Adipor2) (Table 3).
Table 3. Correlations between expression levels of additional hunger related genes and circulating hormones
| Leptin | IGF-1 | insulin | TNF-α | |||||
|---|---|---|---|---|---|---|---|---|
| r | p-value | r | p-value | r | p-value | r | p-value | |
| Bche | 0.707 | <0.001 | 0.632 | <0.001 | ||||
| Prcp | 0.667 | <0.001 | ||||||
| Nts | 0.622 | <0.001 | 0.465 | 0.011 | ||||
| Glp1r | 0.574 | 0.001 | ||||||
| Grin3b | 0.512 | 0.005 | ||||||
| Sgk1 | −0.815 | <0.001 | −0.529 | 0.003 | −0.588 | 0.001 | ||
| Bmp7 | −0.496 | 0.006 | ||||||
| Adipor2 | −0.740 | <0.001 | ||||||
Graded CR responses involve an upregulation of core clock genes and these are negatively correlated with circulating hormone levels
The core clock genes, period circadian clock 1 (Per1, log FC 0.630, p-value < 0.001), period circadian clock 2 (Per2 log FC 0.602, p-value < 0.001) and cryptochrome 1 (photolyase-like) (Cry1, log FC 0.640, p-value = 0.001) were significantly upregulated at 40CR relative to 12AL while no significant differences were observed at other CR levels (Fig 5A). Leptin correlated negatively with Per1, Per2, Cry1 and Cry2. Insulin correlated negatively with Per1 and Per2; and IGF-1 correlated negatively with Cry1, Cry2, and Per2. No significant correlation was observed between core clock genes and TNF-α, IL6 and resistin (Fig 5B and 5C) (Table 4).
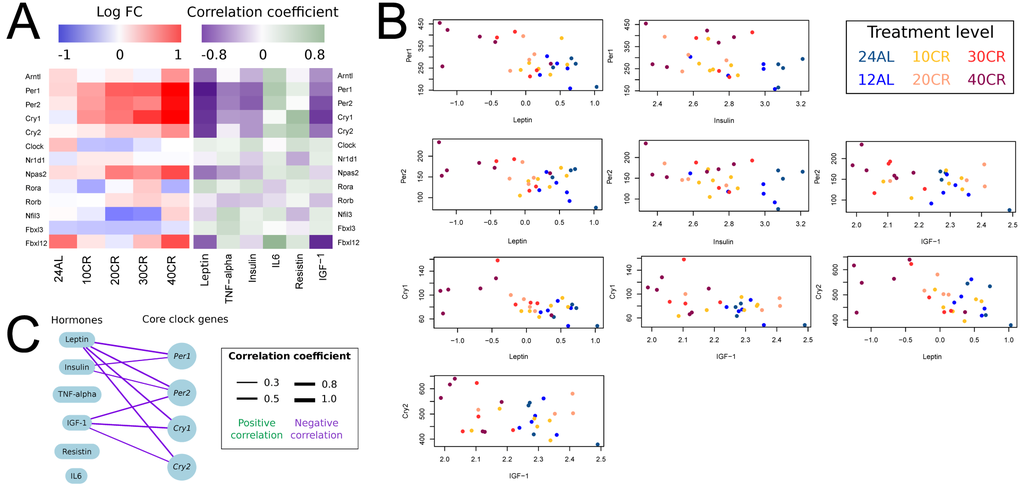
Figure 5. Effect of graded calorie restriction on circulating hormone levels and genes involved in circadian rhythm. (A) Genes involved in circadian rhythm pathways based on their log fold change relative to ad libitum feeding for 12h per day (12AL) and their correlation coefficient with circulating hormone levels. Blue indicates down-regulation and red upregulation relative to 12AL. Purple indicates a negative correlation coefficient and green a positive correlation with circulating hormone levels. 10CR, 20CR, 30CR and 40CR refers to 10 %, 20 %, 30 % and 40 % restriction and 24AL refers to 24h ad libitum feeding. (B) Expression levels of core clock genes plotted against circulating hormone levels. Those genes with a significant correlation based on p-value < 0.05 are included in the plot. (C) Overview of core clock genes correlating with circulating hormone levels. The lines connecting hormones and genes represent correlations and the width of these lines indicate the strength of the correlation coefficient. Green indicates a positive correlation and purple a negative correlation.
Table 4. Correlations between expression levels of key circadian genes and circulating hormones
| leptin | TNF-α | Insulin | IL6 | Resistin | IGF-1 | |||||||
|---|---|---|---|---|---|---|---|---|---|---|---|---|
| r | p-value | r | p-value | r | p-value | r | p-value | r | p-value | r | p-value | |
| Per1 | −0.609 | <0.001 | −0.352 | 0.061 | −0.402 | 0.031 | 0.282 | 0.138 | 0.088 | 0.649 | −0.364 | 0.052 |
| Per2 | −0.555 | 0.002 | −0.336 | 0.075 | −0.429 | 0.020 | 0.242 | 0.205 | 0.017 | 0.929 | −0.465 | 0.011 |
| Cry1 | −0.540 | 0.003 | −0.266 | 0.163 | −0.275 | 0.148 | 0.028 | 0.887 | 0.328 | 0.082 | −0.516 | 0.004 |
| Cry2 | −0.514 | 0.004 | −0.050 | 0.796 | −0.278 | 0.145 | 0.208 | 0.279 | 0.279 | 0.142 | −0.371 | 0.047 |
We also explored how these circadian genes were related to the hunger signaling pathways using IPA. Several direct connections were found between the circadian genes and hunger, including Arntl, Npy, Agrp and Cartpt. However, this network highlighted that the only currently known direct link from hunger to circadian rhythms was via the TNF-α signaling pathway (Fig 6). Circulating levels of TNF-α correlated with Per2, but none of the connected genes in the constructed circadian pathway showed a similar correlation. Similar results were found for Per1. However, genes downstream from Arntl did correlate with TNF-α, such as tripartite motifcontaining 21 (Trim21, r = −0.360, p-value = 0.055), ubiquitin specific peptidase 2 (Usp2, r= −0.381, p-value = 0.041) and cyclin D1 (Ccnd1, r = 0.398, p-value = 0.03). The correlations of the circadian rhythm pathway elements to other circulating hormones such as leptin, insulin, IGF-1, resistin and IL6 can be found in Figs S6-S10.
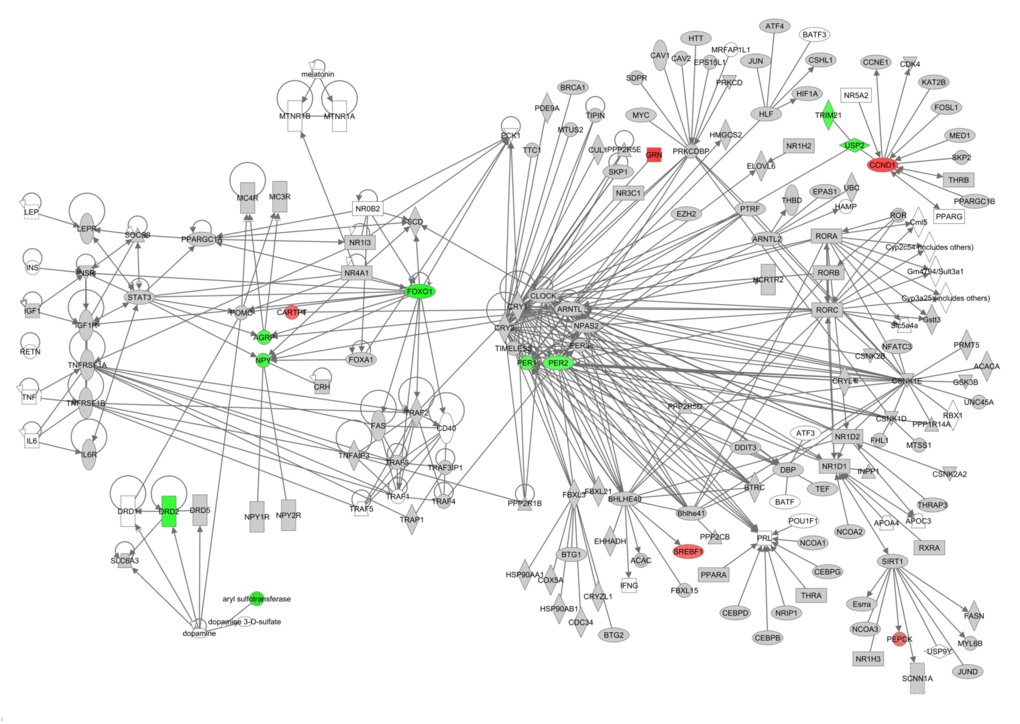
Figure 6. Genes involved in circadian rhythm pathway constructed in the IPA program colored according their correlation with circulating levels of tumor necrosis factor alpha (TNF-α). Red indicates a positive correlation coefficient while green indicates a negative correlation coefficient. Intensity of the color is related to the strength of the correlation.
These pathways indicated that lowered leptin resulted in a higher significance and number of correlating genes compared to other circulating hormones. In addition, lower levels of IGF-1 showed similar correlation patterns to the decreased levels of leptin. The pathway was less correlated with circulating levels of insulin, IL6 and resistin.
Graded CR phenotypic responses are associated with expression levels of core circadian rhythm genes and hunger genes
We previously established that these mice exhibit two phenotypic responses (modulated physical activity patterns [23] and reduced body temperature [22]) to CR throughout the CR study, which can be described as three states [23]: state I : active state with high activity and slightly higher body temperature relative to 12AL; state II: inactive state with low activity and slightly lower body temperature relative to 12AL; and state III: deeply inactive state with even less activity and a large drop in body temperature with occurrence of torpor [23]. We observed a phenotypic shift which involved a decline in the characteristics of these states (decline in body temperature and an economy of movements [23]). We therefore investigated whether the phenotypes described by these states could be associated with the expression level of hunger genes and core clock genes. We initially explored the phenotypic response profile of different groups by applying principal component analysis (PCA). The first two principal components explained ∼80% of the variance and individuals clustered according to CR level. This indicated that CR explained a majority of the variability observed in the phenotypic responses (Fig S11). Movement of state I (the most active state) seemed to drive the separation of 40CR, 30CR and 20CR individuals and AL groups. We further elaborated on the observed separation by analysing if phenotypic responses were associated with a single gene expression or a combination of genes. None of the variance observed in PC2 was significantly explained by gene expression level but variance in PC1 was. A significant proportion of the variance in behavioral responses could be explained by expression levels of 3 of the 4 key hunger genes, with the exception being Pomc (linear model (lm) PC1: F(1,31) = 2.272, pvalue = 0.141): Npy (F(1,31) = 7.501, p-value = 0.010), Agrp (F(1,31) = 25.26, p-value < 0.001) and Cartpt (F(1,31) = 6.101, p-value = 0.019) (Fig 7). Phenotypic responses were also significantly explained by the combined expression of these key genes (F(4,28) = 8.385, p-value < 0.001).
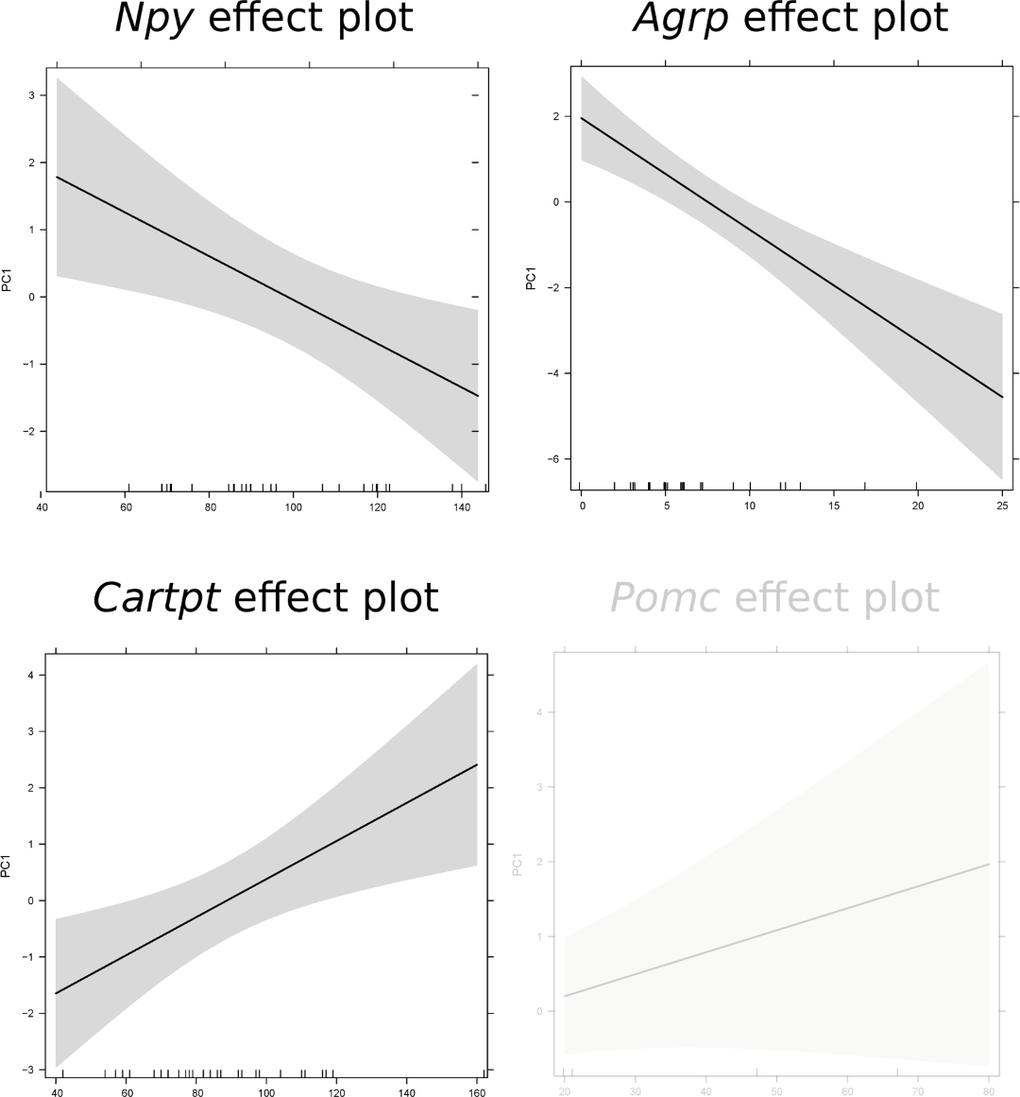
Figure 7. Prediction effect plots of the linear model with eigenvector values of principle component 1 (representing phenotypic responses) and gene expression levels of key hunger genes. A cut-off value of p-value < 0.05 was used to determine significant relationships in these linear models. Non-significance is indicated by light grey.
Similar results were found for the 5 core clock genes (lm PC1: F(6,26) = 4.436, p-value < 0.001) and phenotypic responses were significant associated with Per1 (F(1,31) = 12.67, p-value = 0.001), Per2 (F(1,31) = 11.47, p-value = 0.002), Cry1 (F(1,31) = 19.36, p-value < 0.001), Cry2 (F(1,31) = 9.751, p-value = 0.004) and Arntl (F(1,31) = 11, p-value = 0.002) but not on Clock (F(1,31) = 0.139, p-value = 0.712) expression levels (Fig 8).
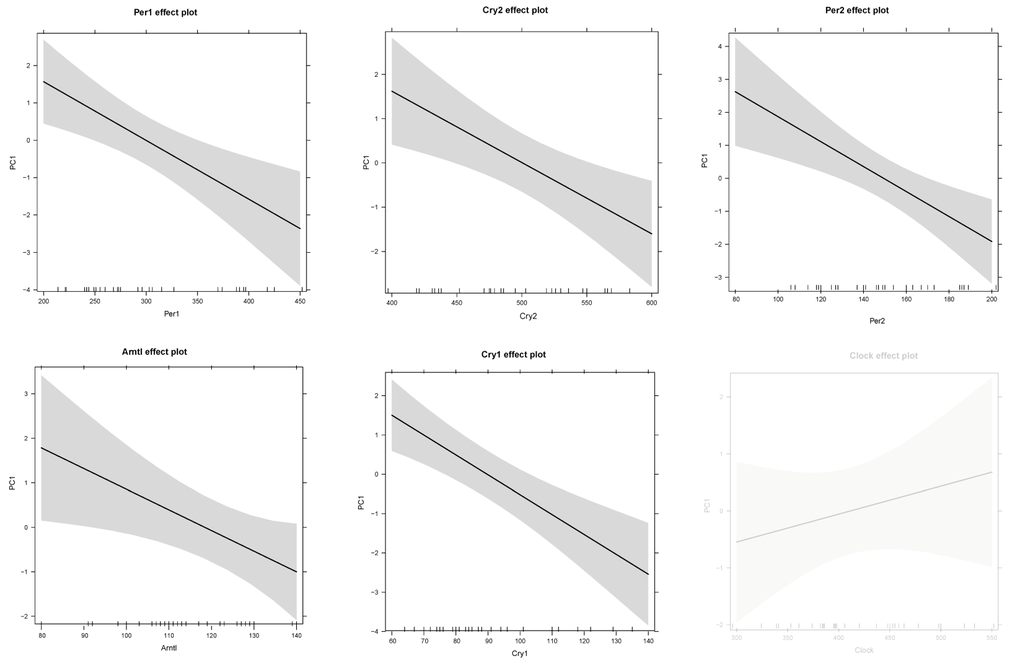
Figure 8. Prediction effect plots of the linear model with eigenvector values of principle component 1 (representing phenotypic responses) and gene expression levels of core clock genes. A cut-off value of p-value < 0.05 was used to determine significant relationships in these linear models. Non-significance is indicated by light grey.
To further elaborate on the significant association between phenotypic responses and gene expression data, we explored the correlations between genes and two distinctive CR response: FAA and mean body temperature (Tb) over the last 20 days of treatment. We found that Npy and Agrp correlated negatively with Tb and Cartpt and Pomc (log converted) correlated positively with Tb. Per1, Per2, Cry1 and Cry2 significantly correlated in a negative manner with Tb (Fig S12). We explored if key genes correlated with either FAA or non FAA from the last 20 days. Npy and Agrp correlated positively with FAA while Cartpt and Pomc (log converted) correlated negatively (Fig S13). No significant correlation was found between these genes and non FAA (Table 5). Similar results were found for Per1, Per2, Cry1 and Cry2 which correlated positively with FAA but not with non FAA (Fig S14). Furthermore hunger signaling genes in the IPA pathway and additional hunger related genes correlated with FAA (Table S1).
Table 5. Correlations between expression levels of key genes and the averaged body temperature (Tb), food anticipatory activity (FAA) and non FAA of the last 20 days
| Tb | FAA | Non FAA | ||||
|---|---|---|---|---|---|---|
| r | p-value | r | p-value | r | p-value | |
| Npy | −0.446 | 0.008 | 0.528 | 0.002 | −0.010 | 0.956 |
| Agrp | −0.669 | <0.001 | 0.585 | <0.001 | −0.158 | 0.380 |
| Pomc | 0.299 | 0.086 | −0.249 | 0.163 | −0.088 | 0.625 |
| Cartpt | 0.434 | 0.010 | −0.443 | 0.010 | −0.032 | 0.861 |
| Per1 | −0.445 | 0.008 | 0.455 | 0.008 | −0.084 | 0.640 |
| Per2 | −0.543 | 0.001 | 0.569 | 0.001 | 0.012 | 0.948 |
| Cry1 | −0.558 | 0.001 | 0.595 | <0.001 | −0.269 | 0.131 |
| Cry2 | −0.403 | 0.018 | 0.361 | 0.039 | −0.256 | 0.150 |
| Log10Pomc | 0.540 | 0.001 | −0.510 | 0.003 | 0.010 | 0.937 |
Discussion
Although previous studies have highlighted a relationship between the extent of restriction and the extent to which lifespan is increased (reviewed in [6,37]), few have investigated the variability in biological responses to a graded increase in CR level [38]. Our previous work has shown that graded calorie restriction influenced body composition, circulating hormone levels, glucose homeostasis, body temperature and phenotypic behavior responses [23,35,36]. Here we anticipated that graded CR would result in a graded transcriptomic response in the hypothalamus. We found that graded CR had an impact on nearly 10% of the hypothalamic genes, including large changes in the hunger signaling and circadian rhythm pathways.
Materials and Methods
To create a systems level description of graded CR responses, we performed a three month graded CR study on male C57BL/6 mice. Behavioral, physiological and molecular information from various tissues of individual mice were collected, including body temperature, physical activity, 24-hour energy expenditure, oxidative damage, behavior data, body composition, resting metabolic rate, circulating hormones and adipokines, metabolomics, proteomics and transcriptomics. In this study, whole transcriptome sequencing or RNA-seq was used to identify differentially expressed genes (DEGs) in the hypothalamus across different CR levels and to assess the role of circulating hormones in the transcriptomic response to graded CR, and the correlations between these transcripts and various behavioral phenotypes.
Animals and experimental manipulations
All procedures were approved by the University of Aberdeen ethical approval committee and carried out under the Animals (Scientific Procedures) Act 1986 Home Office license (PPL 60/4366 held by SEM). Forty nine male C57BL/6 mice (Mus musculus) purchased from Charles River (Ormiston, UK) were individually housed and free access to water was provided. Mice were exposed to 12 hour dark/light cycle (lights on at 0630h) and body mass and food intake were recorded daily, immediately prior to nocturnal feeding. At 20 weeks of age (resembling early adulthood in humans), mice were randomly allocated into 6 different treatment groups: 24h ad libitum intake (24AL) (n=8), 12AL intake (n=8), 10 CR (n=8), 20CR (n=8), 30CR (n=8) and 40CR (n=9). Mice in 12AL group were fed ad libitum for 12h during the dark period and 40CR indicates 40% lower calories than their own individual intakes measured over a baseline period of 14 days prior to introducing CR.
The 12AL control group was used in the study design as control against obesity and all pairwise analysis is relative to 12AL. Animals fed completely ad libitum (i.e., having 24 hours access to food) may overfeed, become overweight and CR associated changes compared to 24AL are therefore most likely to reflect the anti-obesity effect of CR [6,113]. To address this issue, 12AL was set as a reference and graded levels of CR were introduced to investigate a potential graded response. To avoid potentially confounding factors interfering with the circadian rhythm and hormone regulations, all mice were culled between 1400 and 1800, prior to lights out. Detailed information on overall study design, diet composition and detailed rationale are described elsewhere [35].
RNA isolation, cDNA synthesis and RNA sequencing
After culling by a terminal CO2 overdose, brains were removed, weighed and frozen in isopentane over dry ice and stored at −80°C for RNA isolation. The hypothalamus was carefully dissected at a later stage and RNA was isolated by homogenizing in Tri-Reagent (Sigma Aldrich, UK) according to manufacturer's instructions. Prior to RNA quantification using the Agilent RNA 6000 Nano Kit, samples were denatured at 65°C.
Due to the very small size of the hypothalamus, some samples did not contain sufficient quantity of high quality RNA. In total, the RNA of 37 individual mice (12 h AL n=6, 24 h AL n=6, 10 % CR n=7, 20 % CR n=5, 30 % CR n=5, 40 % CR n=8) was successful isolated and sent to Beijing Genomic Institute (BGI, Hong Kong) for RNA sequencing. Library preparation was conducted by enriching total RNA by using oligo(dT) magnetic beads. Fragmentation buffer was added to obtain short fragments from the RNA. The mRNA was used as a template for the random hexamer primers, which synthesize the first strand of cDNA. The second strand was synthesized by adding buffer dNTPs, RNase and DNA polymerase. A QiaQuick PCR extraction kit was used to purify the double stranded cDNA and washed with EB buffer for end repair and single nucleotide A addition. The fragments were ligated with sequencing adaptors, purified using agarose gel-electrophoresis and enriched by PCR amplification. As a quality control step, an Agilent 2100 Bioanaylzer and ABI StepOnePlus Real-Time PCR System were used to qualify and quantify of the sample library. The library products were sequenced using an Illumina Hiseq 2000, resulting in 50 bp single end reads (standard protocol BGI, Hong Kong). Standard primers and barcodes developed by BGI were used.
Alignment to the reference genome
Prior to alignment to the reference genome, FASTQ files were quality controlled to identify the presence of adaptors or low quality sequences using fastQC (http://www.bioinformatics.babraham.ac.uk/. http://bbsrc.ac.uk/projects/fastqc/). To ensure a high sequence quality, the reads were trimmed with a cut-off phred score of 28 using Trimmomatic [114]. Reads were aligned to the reference genome obtained from the National Center for Biotechnology Information (NCBI) database (Mus musculus, version MGSCv37, 2010/09/23, http://www.ncbi.nlm.nih.gov/assembly/165668/). The reference genome was indexed using Bowtie2 [115] and reads aligned with Tophat2 [116] using default settings. Of the 465,857,891 reads 453,726,674 (97.4%) were successfully aligned to the reference genome and 10.8 % contained multi mapped reads. These were removed using the Sequence Alignment/Map (SAM) tools [117] before proceeding to quantifying the reads. The number of reads aligning to a single feature (genes containing exons) was determined using HTSeqcount [118] by identifying how many reads mapped onto a single feature (genes containing exons).
One animal (20 % CR group) was excluded from further analysis based on having > 20 % multi-mapped reads when aligned to the reference transcriptome, suggesting a problem with the sequencing technology. This mouse did not show an abnormal response in other aspects of its phenotype.
Analytical procedure
To remove any genes that exhibited no or a very low number of mapped reads only genes that had more than 1 count per million in at least 4 samples across all treatments were retained for further analysis. This resulted in a total of 14,013 unique genes. Read counts were normalized using the trimmed mean of M values (TMM normalization) [119] to account for highly expressed genes consuming substantial proportion of the total library size. This composition effect would cause remaining genes to be under sampled [120]. Differential gene expression was modelled using the edgeR package [120] in R (version 3.1.2) [121] and pairwise comparisons were conducted between 12AL and each level of CR. To control for type I error, Benjamini Hochberg adjusted p-value was used (5 %FDR) [122]. Significant genes were identified based on a cut off p-value < 0.05 and an absolute log fold change (log FC) > 0.5.
Biological interpretation
DEGs based on a likelihood ratio test (LRT, p-value < 0.05) were analyzed with Gene Set Enrichment Analysis (GSEA) software using Gene Ontology biological processes gene set (c5.bp.v5.0.symbols) (www.broadinstitute.org/gsea/downloads.jsp) [123]. The genes were pre-ranked according to their p-value with most significant genes having the highest pre-ranked value. Gene set size filters (min=5, max=800) resulted in filtering out 20 of the 825 gene sets. The remaining gene sets were used in the analysis. A total of 22 pathways resulted in a pvalue < 0.05. The enrichment scores of the biological processes were not taken into consideration as they only represent p-values and not log FC. Output files generated by GSEA were loaded into Cytoscape using the plugin enrichment map (settings: p-value cut off < 0.05, similarity cut off 0.5) and biological processes were visualized as a network [124,125]. Pathway enrichment for 24AL vs 12AL was identified using a similar methodology as above but using the KEGG pathways (c2.cp.kegg.v5.0.symbols) which resulted in filtering out 4 of the 186 gene sets. A total of 36 pathways had a p-value < 0.05.
Data files with log FC per gene for each CR level relative to 12AL were further analyzed using the IPA program by using the option core analysis (Ingenuity® Systems, http://www.ingenuity.com). Pathways and transcription factors were identified based on the significant regulation of their target genes (cut-off pvalue < 0.05 and absolute log FC > 0.5).
Circulating hormone levels (methods and data described in [36]) were correlated with each gene and each individual using Pearson correlations conducted in the statistical environment R (version 3.1.2) [121]. These correlations were used in IPA to map onto the hunger signaling pathway and circadian rhythm pathway. The hunger signaling and circadian rhythm pathways were constructed in the IPA program, which uses literature and expert knowledge-based approaches.
Behavioral phenotypes were determined by hidden Markov models (HMM) for each mouse based on activity and body temperature (methods described in [23]). We showed that mice showed three states: (1) state I: active state. Mice had a higher activity and a slightly higher body temperature; (2) state II: inactive state. Mice moved less and had a slightly lower body temperature; (3) state III: deeply inactive. Mice in a torpor state moved even less and displayed a large drop in body temperature. These three states were analyzed using principle component analysis (PCA). Linear models were constructed to identify significant relationships between eigenvector values from PC1 and PC2 (representing phenotypic responses) and for each key hunger and clock gene separately and then for all genes included. A cut-off value of p-value < 0.05 was used to determine significant relationships in these linear models. Both PCA and linear modeling was conducted in the statistical environment R (version 3.1.2) [121].
The averaged body temperature of the last 20 days of treatment (methods and data described in [36]) correlated with each gene and each individual using Pearson correlations conducted in the statistical environment R (version 3.1.2) [121]. A similar approach was taken for food anticipatory activity. Total physical activity levels of the last 20 days of treatment was separated into food anticipatory activity and nonfood anticipatory activity. The values were averaged and correlated with each gene and each individual using Pearson correlations conducted in the statistical environment R (version 3.1.2) [121].
Supplementary Materials
Author Contributions
JRS conceptualized and designed the original graded CR experiment, raised the funding to execute it and was the HO project license holder. SEM performed all experimental procedures related to the study. DL, AD and DD performed the bioinformatic and statistical analysis. DL, AD, DD, SEM and JRS interpreted the results. DD wrote the manuscript and AD, DL, SEM, JRS and DP revised it. All authors contributed to the analysis during discussions at joint meetings funded by BBSRC grant (China partnering award BB/JO20028/1).
Acknowledgments
We would like to acknowledge the BSU staff for their invaluable help with caring for the animals.
Funding
The work was supported by the UK Biotechnology and Biological Sciences Research Council BBSRC (BB/G009953/1 and BB/J020028/1) to JRS and SEM and a studentship of DD supported by the Centre for Genome Enabled Biology and Medicine, Aberdeen, UK. Joint meetings were funded by BBSRC grant (China partnering award BB/JO20028/1).
Conflicts of Interest
The authors declare no conflict of interest.
References
- 1. Mercken EM, Crosby SD, Lamming DW, Jebailey L, Krzysik-Walker S, Villareal DT, Capri M, Franceschi C, Zhang Y, Becker K, Sabatini DM, de Cabo R, Fontana L. Calorie restriction in humans inhibits the PI3K/AKT pathway and induces a younger transcription profile.Aging Cell.2013;12:645-651..
- 2. Fontana L, Meyer TE, Klein S, Holloszy JO. Long-term calorie restriction is highly effective in reducing the risk for atherosclerosis in humans.Proc Natl Acad Sci U S A.2004;101:6659-6663..
- 3. Fontana L, Klein S, Holloszy JO. Effects of long-term calorie restriction and endurance exercise on glucose tolerance, insulin action, and adipokine production.Age (Omaha).2010;32:97-108..
- 4. McCay C, Crowell M, Maynard L. The effect of retarded growth upon the length of life span and upon the ultimate body size.J Nutr.1935;10:63-79..
- 5. Burger JM, Buechel SD, Kawecki TJ. Dietary restriction affects lifespan but not cognitive aging in Drosophila melanogaster.Aging Cell.2010;9:327-335..
- 6. Speakman JR and Mitchell SE. Caloric restriction.Molecular Aspects of Medicine.2011;159-221..
- 7. Zhao G, Guo S, Somel M, Khaitovich P. Evolution of human longevity uncoupled from caloric restriction mechanisms.PLoS One.2014;9:e84117.
- 8. Fusco S and Pani G. Brain response to calorie restriction.Cell Mol Life Sci.2013;70:3157-3170..
- 9. Zhang Y, Proenca R, Maffei M, Barone M, Leopold L, Friedman JM. Positional cloning of the mouse obese gene and its human homologue.Nature.1994;372:425-432..
- 10. Schwartz MW, Woods SC, Porte D, Seeley RJ, Baskin DG. Central nervous system control of food intake.Nature.2000;404:661-671..
- 11. Wilding JPH. Neuropeptides and appetite control.Diabetic Medicine.2002;619-627..
- 12. Chen Y, Lin Y-C, Kuo T-W, Knight ZA. Sensory Detection of Food Rapidly Modulates Arcuate Feeding Circuits.Cell.2015;160:829-841..
- 13. Betley JN, Xu S, Cao ZFH, Gong R, Magnus CJ, Yu Y, Sternson SM. Neurons for hunger and thirst transmit a negative-valence teaching signal.Nature.2015;521:180-185..
- 14. Ahima RS and Antwi DA. Brain Regulation of Appetite and Satiety.Endocrinology and Metabolism Clinics of North America.2008;811-823..
- 15. Breen TL, Conwell IM, Wardlaw SL. Effects of fasting, leptin, and insulin on AGRP and POMC peptide release in the hypothalamus.Brain Res.2005;1032:141-148..
- 16. Shimokawa I and Higami Y. Leptin signaling and aging: Insight from caloric restriction.Mechanisms of Ageing and Development.2001;1511-1519..
- 17. Richardson A, Liu F, Adamo ML, Van Remmen H, Nelson JF. The role of insulin and insulin-like growth factor-I in mammalian ageing.Best Pract Res Clin Endocrinol Metab.2004;18:393-406..
- 18. Hambly C, Mercer JG, Speakman JR. Hunger does not diminish over time in mice under protracted caloric restriction.Rejuvenation Res.2007;10:533-542..
- 19. Chiba T, Yamaza H, Higami Y, Shimokawa I. Anti-aging effects of caloric restriction: Involvement of neuroendocrine adaptation by peripheral signaling.Microsc Res Tech.2002;59:317-324..
- 20. Mitchell SE, Delville C, Konstantopedos P, Derous D, Green CL, Han J-DJ, Wang Y, Promislow DEL, Douglas A, Chen L, Lusseau D, Speakman JR. The effects of graded levels of calorie restriction: V. Impact of short term calorie and protein restriction on daily physical activity levels and food anticipatory activity in the C57BL/6 mouse.Oncotarget.2015;submitted.
- 21. van Norren K, Rusli F, van Dijk M, Lute C, Nagel J, Dijk FJ, Dwarkasing J, Boekschoten M V, Luiking Y, Witkamp RF, Müller M, Steegenga WT. Behavioural changes are a major contributing factor in the reduction of sarcopenia in caloric-restricted ageing mice.J Cachexia Sarcopenia Muscle.2015;.
- 22. Mitchell SE, Delville C, Konstantopedos P, Derous D, Green CL, Chen L, Han J-DJ, Wang Y, Promislow DEL, Douglas A, Lusseau D, Speakman JR. The effects of graded levels of calorie restriction: III. Impact of short term calorie and protein restriction on mean daily body temperature and torpor use in the C57BL/6 mouse.Oncotarget.2015;6:18314-18337. https://doi.org/10.18632/oncotarget.4506
- 23. Lusseau D, Mitchell SE, Barros C, Derous D, Green C, Chen L, Han J-DJ, Wang Y, Promislow DEL, Douglas A, Speakman JR. The effects of graded levels of calorie restriction: IV. Non-linear change in behavioural phenotype of mice in response to shortterm calorie restriction.Sci Rep.2015;5:13198.
- 24. Froy O. The relationship between nutrition and circadian rhythms in mammals.Frontiers in Neuroendocrinology.2007;61-71..
- 25. Reppert SM and Weaver DR. Molecular analysis of mammalian circadian rhythms.Annu Rev Physiol.2001;63:647-676..
- 26. Green CB, Takahashi JS, Bass J. The Meter of Metabolism.Cell.2008;728-742..
- 27. Guan XM, Hess JF, Yu H, Hey PJ, van der Ploeg LH. Differential expression of mRNA for leptin receptor isoforms in the rat brain.Mol Cell Endocrinol.1997;133:1-7..
- 28. Yi CX, Van Der Vliet J, Dai J, Yin G, Ru L, Buijs RM. Ventromedial arcuate nucleus communicates peripheral metabolic information to the suprachiasmatic nucleus.Endocrinology.2006;147:283-294..
- 29. Masri S and Sassone-Corsi P. The circadian clock: a framework linking metabolism, epigenetics and neuronal function.Nat Rev Neurosci.2013;14:69-75..
- 30. Chaves I, Van Der Horst GTJ, Schellevis R, Nijman RM, Koerkamp MG, Holstege FCP, Smidt MP, Hoekman MFM. Insulin- FOXO3 signaling modulates circadian rhythms via regulation of clock transcription.Curr Biol.2014;24:1248-1255..
- 31. Van Someren EJ. Circadian rhythms and sleep in human aging.Chronobiol Int.2000;17:233-243..
- 32. Taylor P, Weinert H, Weinert D, Waterhouse J. The Circadian Activity and Body Temperature Rhythms of Mice During Their Last Days of Life.Biol Rhythm Res.2010;33:37-41..
- 33. Wyse CA, Coogan AN, Selman C, Hazlerigg DG, Speakman JR. Association between mammalian lifespan and circadian freerunning period: the circadian resonance hypothesis revisited.Biol Lett.2010;6:696-698..
- 34. Froy O, Chapnik N, Miskin R. Relationship between calorie restriction and the biological clock: lessons from long-lived transgenic mice.Rejuvenation Res.2008;11:467-471..
- 35. Mitchell SE, Tang Z, Kerbois C, Delville C, Konstantopedos P, Bruel A, Derous D, Green C, Aspden RM, Goodyear SR, Chen L, Han JJD, Wang Y, et al. The effects of graded levels of calorie restriction: I. impact of short term calorie and protein restriction on body composition in the C57BL/6 mouse.Oncotarget.2015;6:15902-15930. https://doi.org/10.18632/oncotarget.4142
- 36. Mitchell SE, Delville C, Konstantopedos P, Hurst J, Derous D, Green C, Chen L, Han JJD, Wang Y, Promislow DEL, Lusseau D, Douglas A, Speakman JR. The effects of graded levels of calorie restriction: II. Impact of short term calorie and protein restriction on circulating hormone levels, glucose homeostasis and oxidative stress in male C57BL/6 mice.Oncotarget.2015;6:23213-23237. https://doi.org/10.18632/oncotarget.4003
- 37. Speakman JR and Hambly C. Starving for life: what animal studies can and cannot tell us about the use of caloric restriction to prolong human lifespan.J Nutr.2007;137:1078-1086..
- 38. Duffy PH, Lewis SM, Mayhugh MA, Trotter RW, Latendresse JR, Thorn BT, Feuers RJ. The effects of different levels of dietary restriction on neoplastic pathology in the male Sprague-Dawley rat.Aging Clin Exp Res.2004;16:448-456..
- 39. Ahima RS and Flier JS. Leptin.Annu Rev Physiol.2000;62:413-437..
- 40. Elmquist JK, Elias CF, Saper CB. From lesions to leptin: hypothalamic control of food intake and body weight.Neuron.1999;22:221-232..
- 41. Saper CB. What has MCPH got to do with the evolution of human intelligence?Curr Biol.2014;24:R1111-R1116..
- 42. Bartfai T and Conti B. Molecules affecting hypothalamic control of core body temperature in response to calorie intake.Front Genet.2012;3:184.
- 43. Libert S, Zwiener J, Chu X, Vanvoorhies W, Roman G, Pletcher SD. Regulation of Drosophila life span by olfaction and foodderived odors.Science.2007;315:1133-1137..
- 44. Bishop NA and Guarente L. Two neurons mediate dietrestriction-induced longevity in C. elegans.Nature.2007;447:545-549..
- 45. Broughton SJ, Piper MDW, Ikeya T, Bass TM, Jacobson J, Driege Y, Martinez P, Hafen E, Withers DJ, Leevers SJ, Partridge L. Longer lifespan, altered metabolism, and stress resistance in Drosophila from ablation of cells making insulin-like ligands.Proc Natl Acad Sci U S A.2005;102:3105-3110..
- 46. Kenyon C, Chang J, Gensch E, Rudner a, Tabtiang R. A C. elegans mutant that lives twice as long as wild type.Nature.1993;366:461-464..
- 47. Alcedo J and Kenyon C. Regulation of C. elegans longevity by specific gustatory and olfactory neurons.Neuron.2004;41:45-55..
- 48. Fontana L, Partridge L, Longo VD. Extending healthy life span--from yeast to humans.Science.2010;328:321-326..
- 49. Havel PJ. Peripheral signals conveying metabolic information to the brain: short-term and long-term regulation of food intake and energy homeostasis.Exp Biol Med (Maywood).2001;226:963-977..
- 50. Guillod-Maximin E, Roy AF, Vacher CM, Aubourg A, Bailleux V, Lorsignol A, Penicaud L, Parquet M, Taouis M. Adiponectin receptors are expressed in hypothalamus and colocalized with proopiomelanocortin and neuropeptide Y in rodent arcuate neurons.J Endocrinol.2009;200:93-105..
- 51. Shimokawa I and Higami Y. Leptin and anti-aging action of caloric restriction.J Nutr Health Aging.2001;5:43-48..
- 52. Chiba T, Tamashiro Y, Park D, Kusudo T, Fujie R, Komatsu T, Kim SE, Park S, Hayashi H, Mori R, Yamashita H, Chung HY, Shimokawa I. A key role for neuropeptide Y in lifespan extension and cancer suppression via dietary restriction.Sci Rep.2014;4:4517.
- 53. Wolkow CA, Kimura KD, Lee MS, Ruvkun G. Regulation of C. elegans life-span by insulinlike signaling in the nervous system.Science.2000;290:147-150..
- 54. Paradis S and Ruvkun G. Caenorhabditis elegans Akt/PKB transduces insulin receptor-like signals from age-1 PI3 kinase to the DAF-16 transcription factor.Genes Dev.1998;12:2488-2498..
- 55. Kimura KD, Tissenbaum H a, Liu Y, Ruvkun G. daf-2, an insulin receptor-like gene that regulates longevity and diapause in Caenorhabditis elegans.Science.1997;277:942-946..
- 56. Blüher M, Michael MD, Peroni OD, Ueki K, Carter N, Kahn BB, Kahn CR. Adipose tissue selective insulin receptor knockout protects against obesity and obesity-related glucose intolerance.Dev Cell.2002;3:25-38..
- 57. Selman C, Lingard S, Choudhury AI, Batterham RL, Claret M, Clements M, Ramadani F, Okkenhaug K, Schuster E, Blanc E, Piper MD, Al-Qassab H, Speakman JR, et al. Evidence for lifespan extension and delayed age-related biomarkers in insulin receptor substrate 1 null mice.FASEB J.2008;22:807-818..
- 58. Masaki T, Chiba S, Noguchi H, Yasuda T, Tobe K, Suzuki R, Kadowaki T, Yoshimatsu H. Obesity in Insulin Receptor Substrate-2-Deficient Mice: Disrupted Control of Arcuate Nucleus Neuropeptides.Obes Res.2004;12:878-885..
- 59. Barbieri M, Rizzo MR, Manzella D, Paolisso G. Age-related insulin resistance: Is it an obligatory finding? The lesson from healthy centenarians.Diabetes/Metabolism Research and Reviews.2001;19-26..
- 60. Harrison DE, Archer JR, Astle CM. Effects of food restriction on aging: separation of food intake and adiposity.Proc Natl Acad Sci U S A.1984;81:1835-1838..
- 61. Erickson JC, Hollopeter G, Palmiter RD. Attenuation of the Obesity Syndrome of ob/ob Mice by the Loss of Neuropeptide Y.Science.1996;274:1704-1707..
- 62. Arvaniti K, Huang Q, Richard D. Effects of Leptin and Corticosterone on the Expression of Corticotropin-Releasing Hormone, Agouti-Related Protein, and Proopiomelanocortin in the Brain of ob/ob Mouse.Neuroendocrinology.2001;73:227-236..
- 63. Townsend KL, Suzuki R, Huang TL, Jing E, Schulz TJ, Lee K, Taniguchi CM, Espinoza DO, McDougall LE, Zhang H, He T-C, Kokkotou E, Tseng Y-H. Bone morphogenetic protein 7 (BMP7) reverses obesity and regulates appetite through a central mTOR pathway.FASEB J.2012;26:2187-2196..
- 64. Zhang G, Li J, Purkayastha S, Tang Y, Zhang H, Yin Y, Li B, Liu G, Cai D. Hypothalamic programming of systemic ageing involving IKK-β, NF-κB and GnRH.Nature.2013;497:211-6..
- 65. Blagosklonny M V. M(o)TOR of aging: MTOR as a universal molecular hypothalamus.Aging (Albany NY).2013;5:490-494..
- 66. Narasimhan SD, Yen K, Tissenbaum HA. Converging Pathways in Lifespan Regulation.Current Biology.2009;R657-66..
- 67. Cameron KM, Golightly A, Miwa S, Speakman J, Boys R, von Zglinicki T. Gross energy metabolism in mice under late onset, short term caloric restriction.Mech Ageing Dev.2011;132:202-209..
- 68. Hambly C and Speakman JR. Contribution of different mechanisms to compensation for energy restriction in the mouse.Obes Res.2005;13:1548-1557..
- 69. Severinsen T and Munch IC. Body core temperature during food restriction in rats.Acta Physiol Scand.1999;165:299-305..
- 70. Duffy PH, Leakey JE, Pipkin JL, Turturro A, Hart RW. The physiologic, neurologic, and behavioral effects of caloric restriction related to aging, disease, and environmental factors.Environ Res.1997;73:242-248..
- 71. McCarter RJ, Shimokawa I, Ikeno Y, Higami Y, Hubbard GB, Yu BP, McMahan CA. Physical activity as a factor in the action of dietary restriction on aging: effects in Fischer 344 rats.Aging (Milano).1997;9:73-79..
- 72. Aponte Y, Atasoy D, Sternson SM. AGRP neurons are sufficient to orchestrate feeding behavior rapidly and without training.Nat Neurosci.2011;14:351-355..
- 73. Krashes MJ, Koda S, Ye C, Rogan SC, Adams AC, Cusher DS, Maratos-Flier E, Roth BL, Lowell BB. Rapid, reversible activation of AgRP neurons drives feeding behavior in mice.J Clin Invest.2011;121:1424-1428..
- 74. Fong TM, Mao C, MacNeil T, Kalyani R, Smith T, Weinberg D, Tota MR, Van der Ploeg LH. ART (protein product of agoutirelated transcript) as an antagonist of MC-3 and MC-4 receptors.Biochem Biophys Res Commun.1997;237:629-631..
- 75. Oswal A and Yeo GSH. The leptin melanocortin pathway and the control of body weight: Lessons from human and murine genetics.Obesity Reviews.2007;293-306..
- 76. Cone RD. Anatomy and regulation of the central melanocortin system.Nat Neurosci.2005;8:571-578..
- 77. Wallingford N, Perroud B, Gao Q, Coppola A, Gyengesi E, Liu Z-W, Gao X-B, Diament A, Haus KA, Shariat-Madar Z, Mahdi F, Wardlaw SL, Schmaier AH, et al. Prolylcarboxypeptidase regulates food intake by inactivating alpha-MSH in rodents.J Clin Invest.2009;119:2291-303..
- 78. Cui H, Cai F, Belsham DD. Anorexigenic hormones leptin, insulin, and alpha-melanocyte-stimulating hormone directly induce neurotensin (NT) gene expression in novel NT-expressing cell models.J Neurosci.2005;25:9497-506..
- 79. Vaanholt LM, Mitchell SE, Sinclair RE, Speakman JR. Mice that are resistant to diet-induced weight loss have greater food anticipatory activity and altered melanocortin-3 receptor (MC3R) and dopamine receptor 2 (D2) gene expression.Horm Behav.2015;73:83-93..
- 80. Wang GJ, Volkow ND, Logan J, Pappas NR, Wong CT, Zhu W, Netusll N, Fowler JS. Brain dopamine and obesity.Lancet.2001;357:354-357..
- 81. Volkow ND, Wang GJ, Baler RD. Reward, dopamine and the control of food intake: Implications for obesity.Trends in Cognitive Sciences.2011;37-46..
- 82. Gunapala KM, Gallardo CM, Hsu CT, Steele AD. Single Gene Deletions of Orexin, Leptin, Neuropeptide Y, and Ghrelin Do Not Appreciably Alter Food Anticipatory Activity in Mice.PLoS One.2011;6:e18377.
- 83. Goulding EH, Schenk a K, Juneja P, MacKay AW, Wade JM, Tecott LH. A robust automated system elucidates mouse home cage behavioral structure.Proc Natl Acad Sci U S A.2008;105:20575-82..
- 84. Ribeiro AC, Ceccarini G, Dupré C, Friedman JM, Pfaff DW, Mark AL. Contrasting Effects of Leptin on Food Anticipatory and Total Locomotor Activity.PLoS One.2011;6:e23364.
- 85. Conti B, Sanchez-Alavez M, Winsky-Sommerer R, Morale MC, Lucero J, Brownell S, Fabre V, Huitron-Resendiz S, Henriksen S, Zorrilla EP, de Lecea L, Bartfai T. Transgenic mice with a reduced core body temperature have an increased life span.Science.2006;314:825-828..
- 86. Hwa JJ, Witten MB, Williams P, Ghibaudi L, Gao J, Salisbury BG, Mullins D, Hamud F, Strader CD, Parker EM. Activation of the NPY Y5 receptor regulates both feeding and energy expenditure.Am J Physiol.1999;277:R1428-R1434..
- 87. Mashiko S, Ishihara A, Iwaasa H, Sano H, Ito J, Gomori A, Oda Z, Moriya R, Matsushita H, Jitsuoka M, Okamoto O, MacNeil DJ, Van der Ploeg LHT, et al. A Pair-Feeding Study Reveals That a Y5 Antagonist Causes Weight Loss in Diet-Induced Obese Mice by Modulating Food Intake and Energy Expenditure.Mol Pharmacol.2006;71:602-608..
- 88. Stanley BG, Kyrkouli SE, Lampert S, Leibowitz SF. Neuropeptide Y chronically injected into the hypothalamus: a powerful neurochemical inducer of hyperphagia and obesity.Peptides.1986;7:1189-1192..
- 89. Wortley KE, Anderson KD, Yasenchak J, Murphy A, Valenzuela D, Diano S, Yancopoulos GD, Wiegand SJ, Sleeman MW. Agouti-related protein-deficient mice display an agerelated lean phenotype.Cell Metab.2005;2:421-427..
- 90. Baggio LL, Kim J-G, Drucker DJ. Chronic exposure to GLP-1R agonists promotes homologous GLP-1 receptor desensitization in vitro but does not attenuate GLP-1R-dependent glucose homeostasis in vivo.Diabetes.2004;53:Suppl 3S205-14..
- 91. Gluck EF, Stephens N, Swoap SJ. Peripheral ghrelin deepens torpor bouts in mice through the arcuate nucleus neuropeptide Y signaling pathway.Am J Physiol Regul Integr Comp Physiol.2006;291:R1303-R1309..
- 92. De Vriese C, Gregoire F, Lema-Kisoka R, Waelbroeck M, Robberecht P, Delporte C. Ghrelin degradation by serum and tissue homogenates: Identification of the cleavage sites.Endocrinology.2004;145:4997-5005..
- 93. Nonogaki K, Ohashi-Nozue K, Oka Y. Induction of hypothalamic serum- and glucocorticoid-induced protein kinase- 1 gene expression and its relation to plasma des-acyl ghrelin in energy homeostasis in mice.Biochem Biophys Res Commun.2006;344:696-699..
- 94. Tschöp M, Smiley DL, Heiman ML. Ghrelin induces adiposity in rodents.Nature.2000;407:908-913..
- 95. Wren AM, Small CJ, Abbott CR, Dhillo WS, Seal LJ, Cohen MA, Batterham RL, Taheri S, Stanley SA, Ghatei MA, Bloom SR. Ghrelin Causes Hyperphagia and Obesity in Rats.Diabetes.2001;50:2540-2547..
- 96. Himms-Hagen J. Food restriction increases torpor and improves brown adipose tissue thermogenesis in ob/ob mice.Am J Phyiol.1985;248:E531-E539..
- 97. Gavrilova O, Leon LR, Marcus-Samuels B, Mason MM, Castle AL, Refetoff S, Vinson C, Reitman ML. Torpor in mice is induced by both leptin-dependent and -independent mechanisms.Proc Natl Acad Sci U S A.1999;96:14623-14628..
- 98. Swoap SJ. The pharmacology and molecular mechanisms underlying temperature regulation and torpor.Biochem Pharmacol.2008;76:817-824..
- 99. Swindell WR. Comparative analysis of microarray data identifies common responses to caloric restriction among mouse tissues.Mech Ageing Dev.2008;129:138-153..
- 100. Lee CC. Tumor suppression by the mammalian Period genes.Cancer Causes and Control.2006;525-530..
- 101. Spindler SR and Dhahbi JM. Conserved and tissue-specific genic and physiologic responses to caloric restriction and altered IGFI signaling in mitotic and postmitotic tissues.Annu Rev Nutr.2007;27:193-217..
- 102. Cavadini G, Petrzilka S, Kohler P, Jud C, Tobler I, Birchler T, Fontana A. TNF-alpha suppresses the expression of clock genes by interfering with E-box-mediated transcription.Proc Natl Acad Sci U S A.2007;104:12843-12848..
- 103. Petrzilka S, Taraborrelli C, Cavadini G, Fontana A, Birchler T. Clock gene modulation by TNF-alpha depends on calcium and p38 MAP kinase signaling.J Biol Rhythms.2009;24:283-294..
- 104. Hatori M, Vollmers C, Zarrinpar A, DiTacchio L, Bushong EA, Gill S, Leblanc M, Chaix A, Joens M, Fitzpatrick JAJ, Ellisman MH, Panda S. Time-restricted feeding without reducing caloric intake prevents metabolic diseases in mice fed a high-fat diet.Cell Metab.2012;15:848-860..
- 105. Chaix A, Zarrinpar A, Miu P, Panda S. Article Time-Restricted Feeding Is a Preventative and Therapeutic Intervention against Diverse Nutritional Challenges.Cell Metab.2014;20:991-1005..
- 106. Ando H, Kumazaki M, Motosugi Y, Ushijima K, Maekawa T, Ishikawa E, Fujimura A. Impairment of Peripheral Circadian Clocks Precedes Metabolic Abnormalities in ob/ob Mice.Endocrinology.2011;152:1347-1354..
- 107. Prosser RA and Bergeron HE. Leptin phase-advances the rat suprachiasmatic circadian clock in vitro.Neurosci Lett.2003;336:139-142..
- 108. Inyushkin AN, Bhumbra GS, Dyball REJ. Leptin Modulates Spike Coding in the Rat Suprachiasmatic Nucleus.J Neuroendocrinol.2009;21:705-714..
- 109. Grosbellet E, Gourmelen S, Pévet P, Criscuolo F, Challet E. Leptin Normalizes Photic Synchronization in Male ob/ob Mice, via Indirect Effects on the Suprachiasmatic Nucleus.Endocrinology.2015;156:1080-1090..
- 110. Merino B, Somoza B, Ruiz-Gayo M, Cano V. Circadian rhythm drives the responsiveness of leptin-mediated hypothalamic pathway of cholecystokinin-8.Neurosci Lett.2008;442:165-168..
- 111. Moravcová S, Červená K, Pačesová D, Bendová Z. Identification of STAT3 and STAT5 proteins in the rat suprachiasmatic nucleus and the Day/Night difference in astrocytic STAT3 phosphorylation in response to lipopolysaccharide.J Neurosci Res.2015;.
- 112. Kettner NM, Mayo SA, Hua J, Lee C, Moore DD, Fu L. Circadian Dysfunction Induces Leptin Resistance in Mice.Cell Metab.2015;22:448-459..
- 113. Sohal RS and Forster MJ. Caloric restriction and the aging process: A critique.Free Radical Biology and Medicine.2014;366-382..
- 114. Bolger AM, Lohse M, Usadel B. Trimmomatic: A flexible trimmer for Illumina sequence data.Bioinformatics.2014;30:2114-2120..
- 115. Langmead B, Trapnell C, Pop M, Salzberg SL. Ultrafast and memory-efficient alignment of short DNA sequences to the human genome.Genome Biol.2009;10:R25.
- 116. Trapnell C, Pachter L, Salzberg SL. TopHat: Discovering splice junctions with RNA-Seq.Bioinformatics.2009;25:1105-1111..
- 117. Li H, Handsaker B, Wysoker A, Fennell T, Ruan J, Homer N, Marth G, Abecasis G, Durbin R. The Sequence Alignment/Map format and SAMtools.Bioinformatics.2009;25:2078-2079..
- 118. Anders S, Pyl PT, Huber W. HTSeq A Python framework to work with high-throughput sequencing data [Internet].bioRxiv.2014;.
- 119. Robinson MD and Oshlack A. A scaling normalization method for differential expression analysis of RNA-seq data.Genome Biol.2010;11:R25.
- 120. Robinson MD, McCarthy DJ, Smyth GK. edgeR: A Bioconductor package for differential expression analysis of digital gene expression data.Bioinformatics.2009;26:139-140..
- 121. R Core Team. R: a language and environment for statistical computing. Vienna, Austria [Internet].R Foundation for Statistical ComputingVienna, Austria2014;Available:http://www.r-project.org/.
- 122. Benjamini Y and Hochberg Y. Controlling the false discovery rate: a practical and powerful approach to multiple testing.J R Stat Soc Ser B ….1995;57:289-300..
- 123. Subramanian A, Tamayo P, Mootha VK, Mukherjee S, Ebert BL, Gillette MA, Paulovich A, Pomeroy SL, Golub TR, Lander ES, Mesirov JP. Gene set enrichment analysis: a knowledge-based approach for interpreting genome-wide expression profiles.Proc Natl Acad Sci U S A.2005;102:15545-15550..
- 124. Smoot ME, Ono K, Ruscheinski J, Wang PL, Ideker T. Cytoscape 2.8: New features for data integration and network visualization.Bioinformatics.2011;27:431-432..
- 125. Merico D, Isserlin R, Stueker O, Emili A, Bader GD. Enrichment map: A network-based method for gene-set enrichment visualization and interpretation.PLoS One.2010;5:e13984.