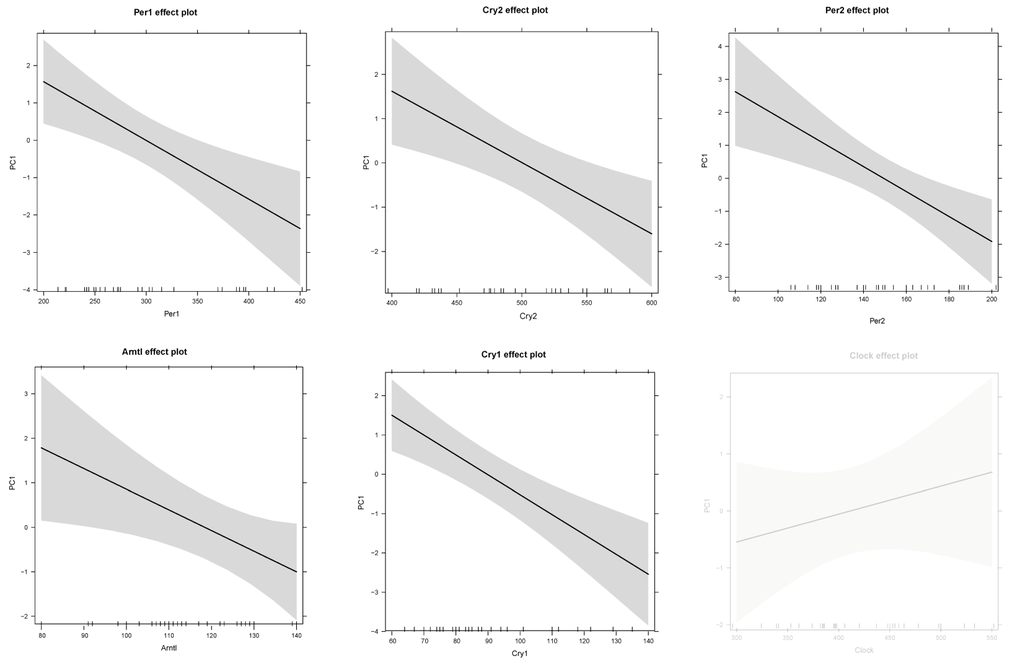
Figure 8.Prediction effect plots of the linear model with eigenvector values of principle component 1 (representing phenotypic responses) and gene expression levels of core clock genes. A cut-off value of p-value < 0.05 was used to determine significant relationships in these linear models. Non-significance is indicated by light grey.