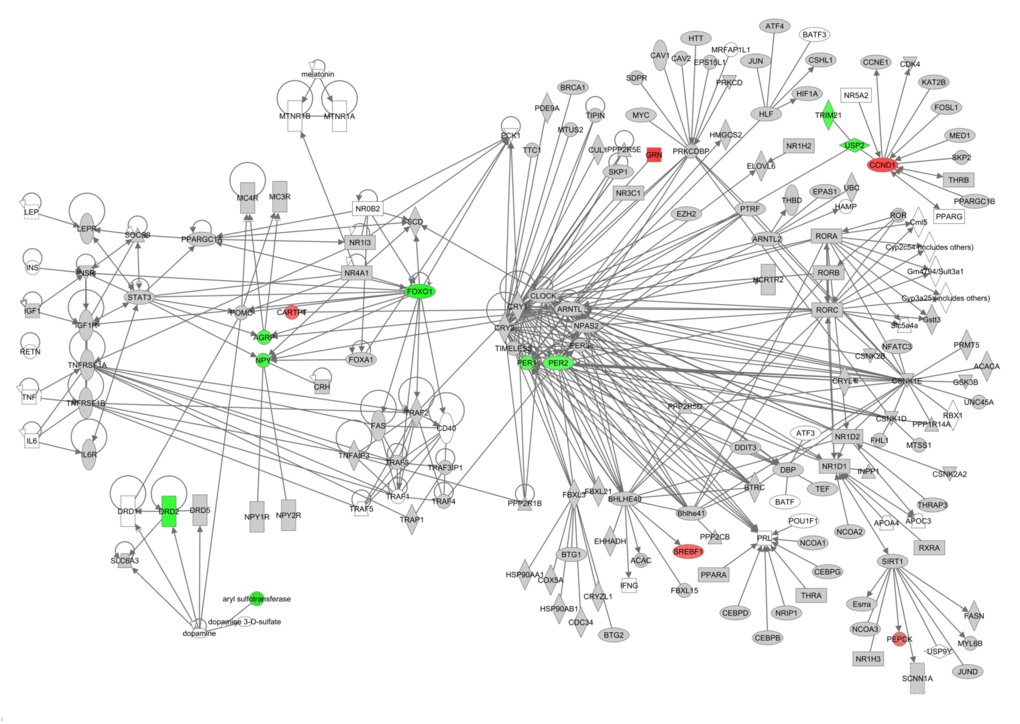
Figure 6.Genes involved in circadian rhythm pathway constructed in the IPA program colored according their correlation with circulating levels of tumor necrosis factor alpha (TNF-α). Red indicates a positive correlation coefficient while green indicates a negative correlation coefficient. Intensity of the color is related to the strength of the correlation.