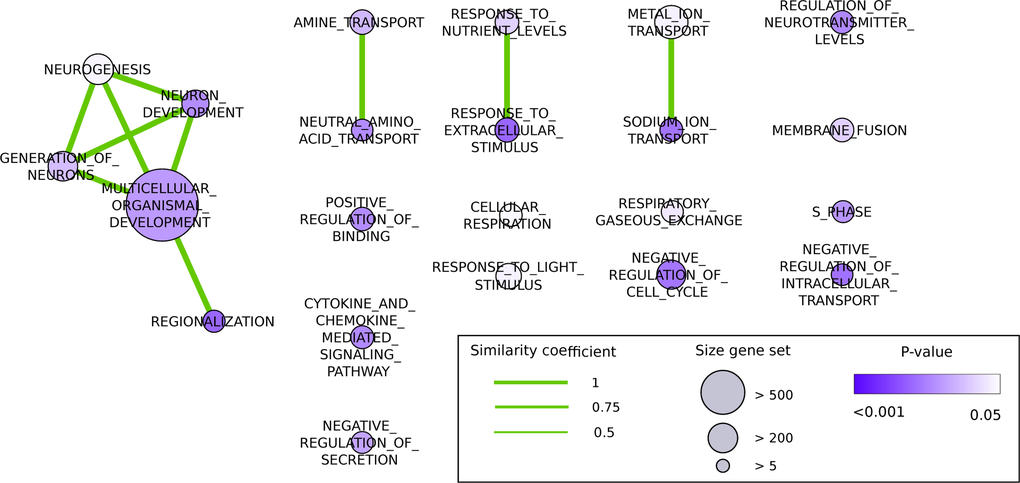
Figure 2.Significantly differentially regulated biological processes after three months of CR treatment, based on genes altered across CR, visualized as an Enrichment map (Cytoscape). The nodes represent biological processes, and edges represent overlap between genes in these processes. The color of the nodes represents the significance according to the p-value (white: p-value = 0.05, purple: p-value < 0.01). The size of the nodes corresponds to the size of the gene set. The width of edges is based on similarity coefficients (> 0.5) between the nodes, derived from the overlap of the gene sets underlying the processes.