


Introduction
Lung cancer, one of the most common and lethal malignancies worldwide, poses a significant threat to human health [1]. Smoking is considered the primary risk factor for lung cancer. Despite smoking being a major cause, other factors such as air pollution, exposure to asbestos, radon, nickel, arsenic, soot, and tar also significantly impact the incidence of lung cancer. Symptoms of lung cancer include dyspnea, chest discomfort, wheezing, bloody mucus, and hoarseness, along with more subtle symptoms like fatigue, loss of appetite, and unexplained weight loss [2]. Lung cancer is primarily categorized into two types: non-small cell lung cancer and small cell lung cancer. The distribution of pathological types varies in different regions; for instance, previous studies have shown a higher proportion of squamous carcinoma among patients who smoke and drink [3]. With advances in etiological research and precision medicine, the incidence and mortality rates of lung cancer are changing globally. Data from Canada indicate a significant reduction in lung cancer mortality rates by approximately 4% annually since 2015. Understanding the epidemiological characteristics of lung cancer is crucial for its prevention and treatment. Current treatments for lung cancer include minimally invasive surgery, targeted therapy, and immunotherapy [4]. Transcriptomics plays a vital role in the treatment of lung cancer by identifying genes closely associated with lung cancer through comparisons between the genotypes of lung cancer and normal lung tissues [5]. Recent studies also highlight the safety and effectiveness of personalized tumor treatments, such as the application of long non-coding RNA (lncRNA) in the treatment of lung cancer [6].
Autophagy, a self-repair and self-cleaning mechanism in cells, and single-cell research play a crucial role in lung cancer, offering insights into the complexity of the disease and the development of new treatment strategies. Autophagy demonstrates a complex “double-edged sword” effect in the progression and treatment of lung cancer [7]. It can suppress tumors by clearing damaged organelles, maintaining cellular homeostasis, and protecting normal cells. However, it also plays a role in the survival and drug resistance of tumor cells. For instance, EGFR-TKI drugs, well-studied in tumor-targeted therapy, can induce autophagy in tumor cells. The effect of autophagy here is twofold, sometimes promoting the survival of tumor cells [8]. Future research should focus on developing new models for studying autophagy, investigating the specific mechanisms of autophagy as a cell death or survival function in EGFR inhibition, and strategies for combining EGFR-TKI with autophagy-regulating drugs at different stages of the tumor and treatment [9]. Single-cell sequencing technology also plays a key role in lung cancer research, allowing researchers to reveal the molecular mechanisms of tumor cell metastasis and identify new circulating tumor cell (CTC) biomarkers [10]. For example, whole-genome sequencing has revealed cancer-associated single nucleotide variations. Moreover, bioinformatics analysis based on the TCGA database has successfully constructed a prognostic risk-scoring model for lung adenocarcinoma based on autophagy-related genes, providing new strategies for personalized treatment of lung cancer [11]. In summary, autophagy and single-cell research offer new perspectives and directions for the treatment of lung cancer, helping develop more effective treatment methods. Through these studies, we can gain a deeper understanding of the biological mechanisms of lung cancer, offering more precise treatment options for patients.
Methods
Data collection and organization
We sourced our data from the Gene Expression Omnibus (GEO; https://www.ncbi.nlm.nih.gov/geo/) and The Cancer Genome Atlas (TCGA) (https://portal.gdc.cancer.gov/) databases [12]. Single-cell data for lung adenocarcinoma were obtained from the GEO database, specifically the GSE117570 dataset, for subsequent analysis. From TCGA, we included 31 normal samples and 538 lung cancer samples for further study. A total of 3076 autophagy-related genes were identified from the GENECARD database, along with the corresponding clinical pathological information downloaded from TCGA [13].
Single-cell data analysis
The data from the GEO database were processed and analyzed for single-cell data using Seurat, dplyr, tidyverse, and data tables were employed for data handling and transformation; and ggplot2, ggpubr, and ggsci were used for data visualization [14]. To assess data quality, we calculated the expression ratio of mitochondrial genes and ribosomal protein genes in each cell. Based on these ratios, potential low-quality cells were filtered out. Subsequently, data from all samples were merged into a single Seurat object for unified downstream analysis. We then normalized the data, selected variable features, and conducted Principal Component Analysis (PCA) [15]. PCA helped us understand the main sources of variation in the data and provided a basis for subsequent clustering analysis. We also performed non-linear dimensionality reduction using the t-SNE algorithm for better visualization of cell similarities. Finally, cells were clustered based on expression characteristics, and different cell populations were identified and annotated using specific marker genes. Key genes in monocyte cells were selected for further analysis [16].
Key gene selection
Differential analysis of TCGA data was performed using the “Limma” package in R [17], followed by an immune infiltration analysis. We then estimated the proportion of immune cell infiltration in each lung cancer sample using the CIBERSORT algorithm [18]. Based on the results of immune infiltration, a weighted gene co-expression network analysis was performed using the `WGCNA` package [19]. We first conducted sample clustering to detect and remove outliers and then chose an appropriate soft threshold to ensure a scale-free network distribution. Modules were constructed, and those related to monocyte cells were identified. Intersection analysis was then conducted among autophagy genes, WGCNA genes, and monocyte cell-related genes from single-cell data.
Consensus clustering analysis of key genes
From the data obtained above, 7 key genes were identified for further analysis. All these genes were present in TCGA. We performed a consistent unsupervised clustering analysis using the “ConsensusClusterPlus” package in R [20], employing the K-Means algorithm to generate different clustering subtypes based on the expression of key genes. Each cluster had a significant sample size. The clusters exhibited high intra-cluster similarity and low inter-cluster similarity. To uncover the biological differences between molecular subtypes, gene set variation analysis (GSVA) was performed using gene sets compiled from MSigDB (C2.Cp.ke.v7.2) [21].
Comprehensive analysis of different molecular subtypes
To evaluate the differences between the two clusters, we explored the association of different clusters with the prognosis and clinical characteristics of lung adenocarcinoma patients. Kaplan-Meier curves generated using the R packages “survival” and “survminer” were used to compare survival times [22].
Model construction
Next, we constructed a prognostic model using these 7 key genes. The “glmnet” package in R was used for Lasso Cox regression analysis to reduce the risk of overfitting related to prognostic genes. Multivariable Cox analysis was employed to select candidate model genes and develop a prognostic model, which was validated based on the training set [23]. The Key Gene-Score was calculated as follows: Σ (Coefi × Expi), where Coefi represents the risk coefficient, and Expi represents the expression of each gene. Patients were divided into two groups based on the median risk score for Kaplan-Meier survival analysis and receiver operating characteristic (ROC) curve analysis. The “ggplot2” package was used for PCA (Principal Component Analysis) and t-SNE (t-distributed Stochastic Neighbor Embedding) analysis [24]. Subsequently, the dataset was divided into high-risk and low-risk groups, and KM survival analysis and ROC curves for each group were performed to validate the universality and accuracy of the model [25].
Development of a nomogram
A nomogram was created using the “nomoR” package, incorporating the risk score and clinical characteristics of lung adenocarcinoma patients [26]. Each variable was assigned a score, and the total score for each sample was calculated by summing these scores. Calibration plots were used to depict the predicted values of 1-year, 3-year, and 5-year survival events compared to the virtual observed values. Finally, gene immune checkpoint analysis was conducted to distinguish between the high and low groups, followed by a drug sensitivity analysis.
Results
Differential analysis and WGCNA analysis
We conducted a differential analysis of tumor data from The Cancer Genome Atlas (TCGA), categorizing adjacent tissue as the normal group and the cancer tissue as the diseased group. Using a threshold of p < 0.05 and an absolute logfc value greater than 1, we identified 7400 differential genes. Figure 1A displays a heatmap of these differential genes, while Figure 1B shows a volcano plot of the same. Figure 1C presents the results of data quality control post-normalization.
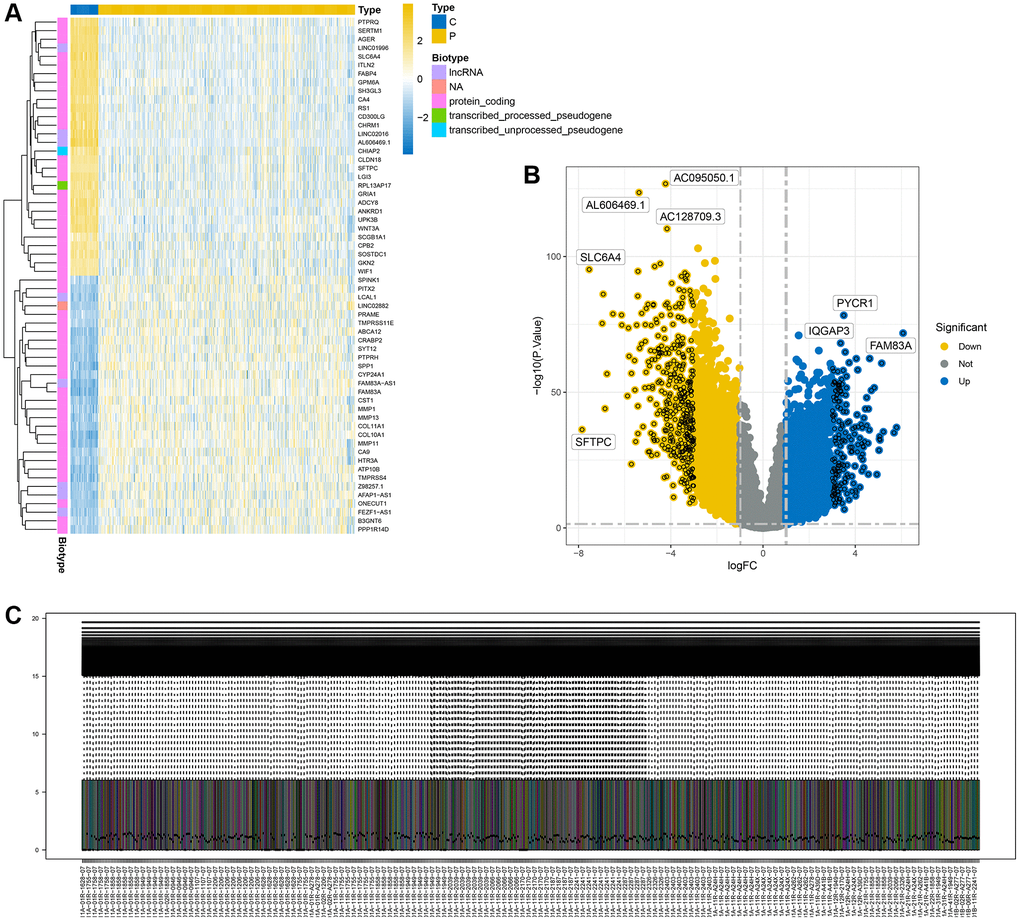
Figure 1. Display of differential analysis results. (A) Heatmap of differential genes; (B) Volcano plot of differential genes; (C) Distribution of differential genes after normalization.
Further, we conducted an immune infiltration analysis of the TCGA data. A differential analysis of immune cells between the normal and diseased groups is displayed in Figure 2A. Significant differences were observed in various cell clusters, such as naïve B cells, plasma cells, activated memory CD4 T cells, M0 macrophages, and notably, monocytes. We chose to focus primarily on monocytes for further analysis. Using the WGCNA method, we analyzed the monocyte cell-related modules in the immune process (Figure 2B), dividing cells into different modules based on monocyte cell scoring. Genes from modules with a p-value less than 0.05 were selected for subsequent analysis. Figure 2C shows the results of clustering.
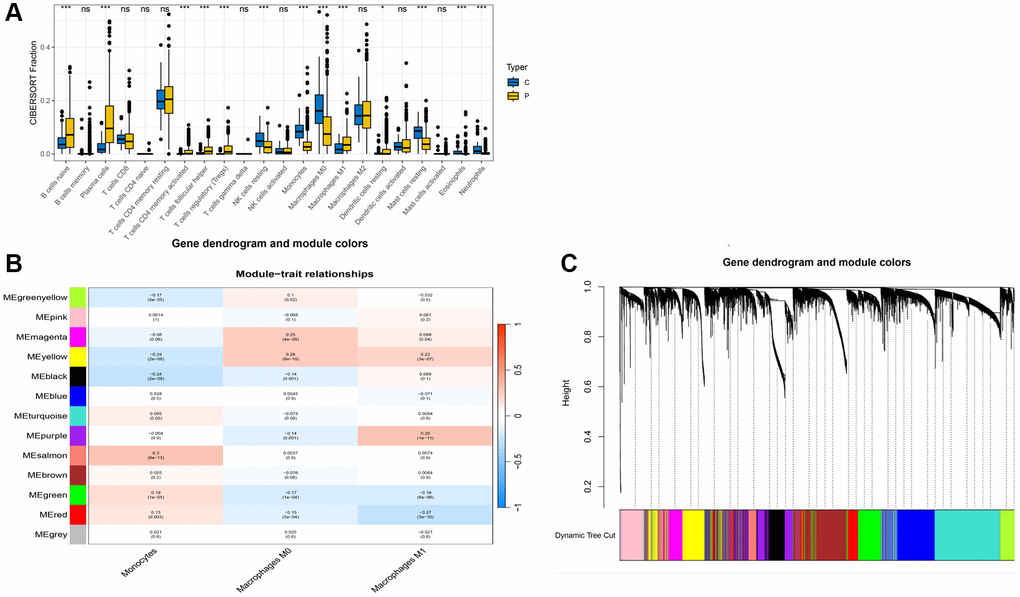
Figure 2. WGCNA analysis results. (A) Box plot of immune cell differences between groups; (B) Selection of modules associated with immune cells; (C) Distribution of subgroups in data.
Key gene selection
We downloaded single-cell data from GSE117570, with the clustering annotation results shown in Figure 3A, dividing cells into 10 distinct clusters, including M1, M2, and monocyte cells. We selected genes from monocyte cells for further analysis. Next, we intersected genes from single-cell monocyte cells, genes identified through WGCNA, and autophagy-related genes, as illustrated in Figure 3B, yielding 7 key genes: OLR1, TREM1, SERPINA1, HLA-DRB5, HLA-DQA2, LYZ, and HLA-DQB1.
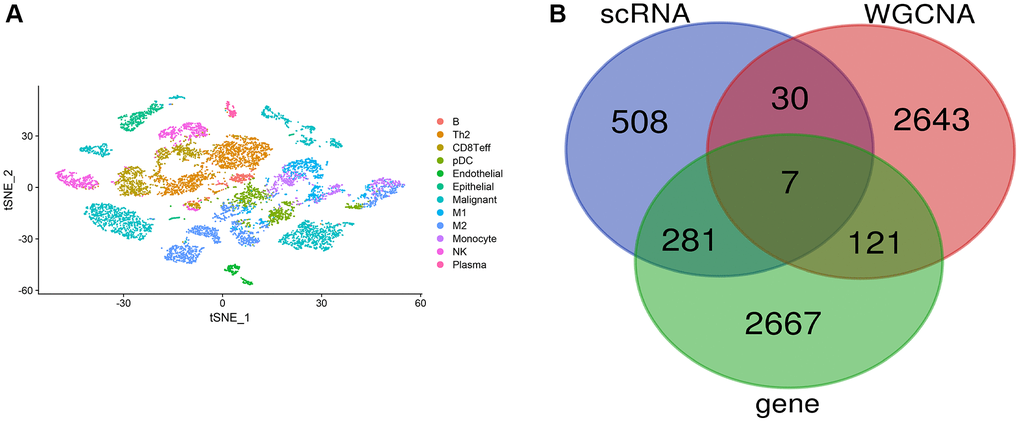
Figure 3. Single-cell data analysis. (A) Clustering annotation results of single-cell data; (B) Venn diagram for key gene selection.
Identification of key gene-related subtypes in lung cancer
Having identified 7 key genes from the lung cancer dataset, we assessed their prognostic value using univariate Cox regression and Kaplan-Meier analysis, selecting genes with a P-value < 0.05. We then classified lung cancer patients based on the expression profiles of these 7 key genes using a consensus clustering algorithm (Figure 4A, 4B). Our findings indicated that k = 2 was the optimal variable for dividing the dataset into clusters A and B (Figure 4B). Survival analysis of these two clusters indicated a significant difference, as shown in Figure 4C.
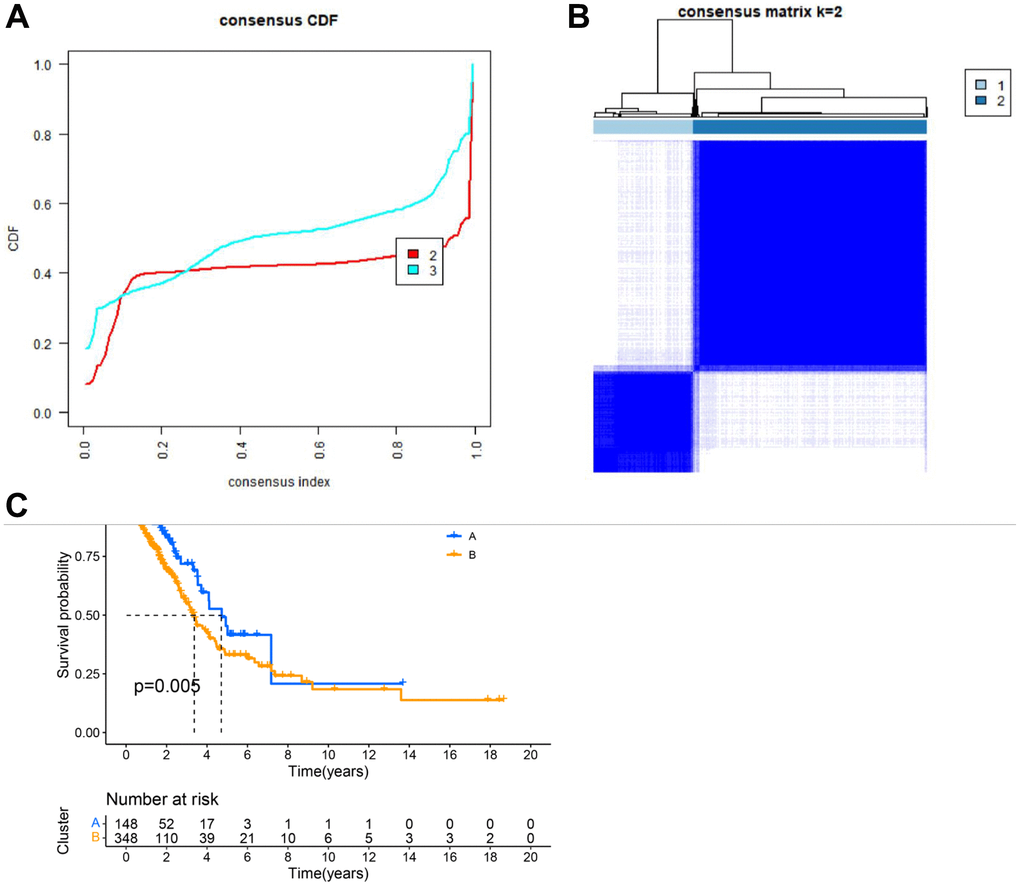
Figure 4. Clustering analysis results. (A) CDF plot of clustering; (B) Display of clustering results. (C) Survival analysis of different subgroups.
Further, we conducted a GSVA analysis of these two clusters. It was observed that these clusters exhibited significant differences in pathways such as KEGG_LEISHMANIA_INFECTION, KEGG_JAK_STAT_SIGNALING_PATHWAY, KEGG_T_CELL_RECEPTOR_SIGNALING_PATHWAY, and KEGG_INTESTINAL_IMMUNE_NETWORK_FOR_IGA_PRODUCTION (Figure 5A). The heatmap in Figure 5B shows the correlation of these clusters with clinical information of lung cancer patients. Additionally, an ssgsea analysis revealed notable differences between these clusters in various immune cells, such as Activated CD4 T cell, Activated CD8 T cell, Monocyte, etc., (Figure 5C).
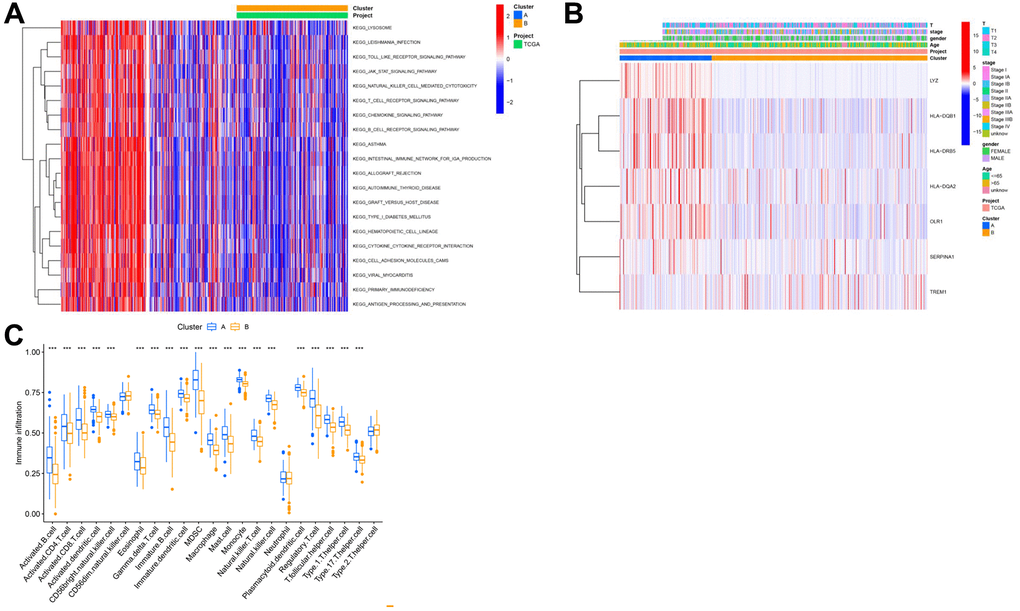
Figure 5. Analysis of subtypes based on key genes. (A) GSEA analysis results of different cluster outcomes. (B) Heatmap of cluster subgroups and clinical characteristics; (C) ssgsea analysis results of different clusters.
Model analysis
Initially, lung cancer patients were randomly divided into a training set and a test set in a 7:3 ratio. The best model was then selected through LASSO regression analysis, leaving the minimal likelihood deviation of genes and multivariable Cox regression analysis based on the Akaike information criterion (AIC) value (Figure 6A, 6B). Patients with a CRG_score lower than the median risk score were considered low-risk, while those with scores above the median were considered high-risk. To assess the model’s predictive capability, we calculated scores for the test set and the entire cohort and conducted ROC analysis to verify predictive accuracy. ROC curves in Figure 6F–6H show that the CRG-Score’s 1-year, 3-year, and 5-year survival rates in the training cohort were 0.630, 0.593, and 0.573, respectively. In the validation cohort, the 1-year, 3-year, and 5-year survival rates were 0.639, 0.598, and 0.620, respectively, with survival curves of all three groups indicating significance (Figure 6C–6E).
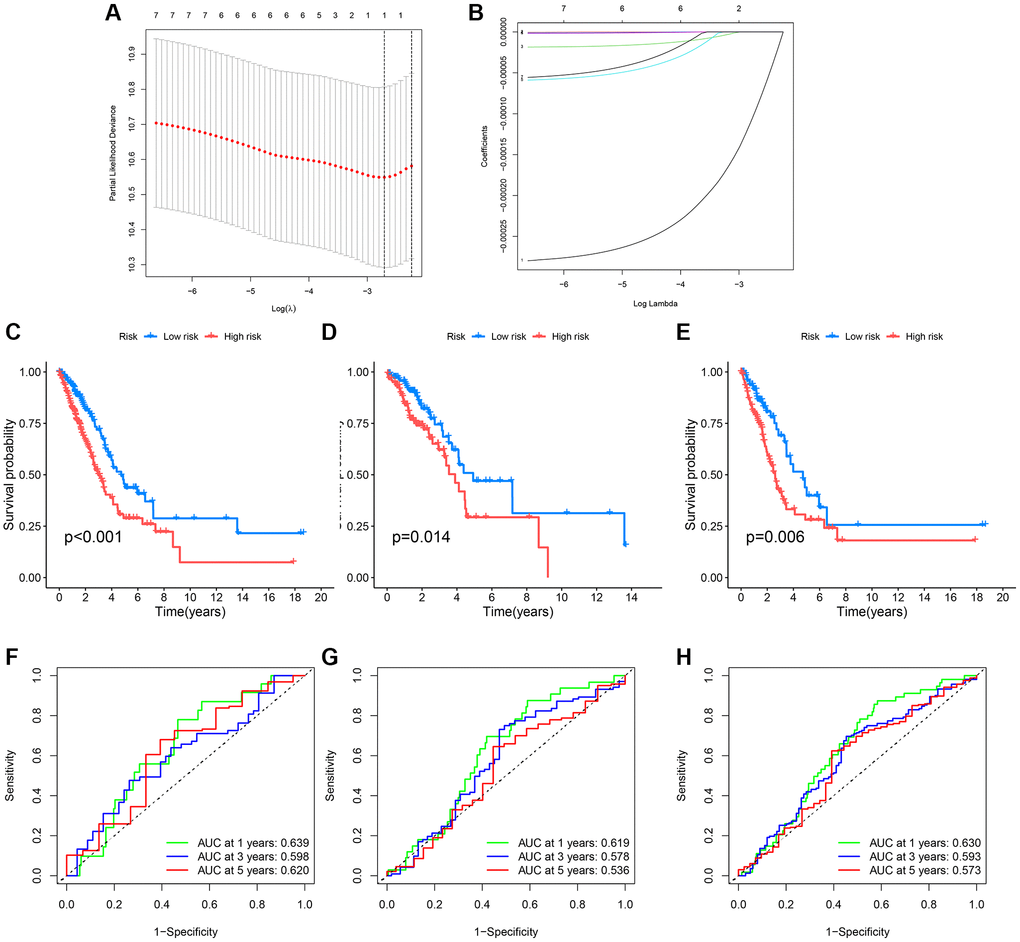
Figure 6. Survival curves and ROC analysis of the risk model in training and testing groups. (A, B) Lasso analysis display; (C–E) Survival curves showing prognostic survival status for different models; (F–H) ROC curves predicting 1-year, 3-year, and 5-year survival sensitivity and specificity based on risk scores in training, testing, and entire cohorts.
Further, we created heatmaps, PCA, and t-SNE distribution diagrams for the key genes, demonstrating significant dimensions of high and low score ancestors. Figure 7A–7C show heatmaps of key genes, while Figure 7D–7I display survival status and survival time between different models.
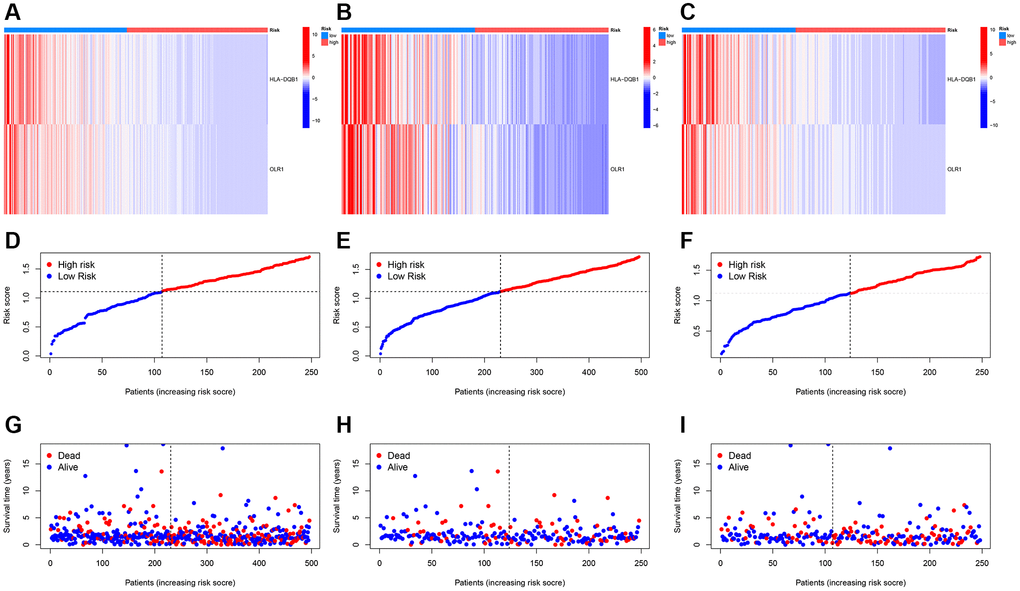
Figure 7. Risk heatmap. (A–C) Risk heatmap display for different groups; (D–I) Survival time and survival status between low-risk and high-risk groups in training, testing, and entire cohorts.
Nomogram and immune analysis
For clinical application, we created a nomogram to estimate the survival rate of lung cancer patients, based on the correlation between risk scores and patient prognosis. Using this nomogram, we estimated the 1-year, 3-year, and 5-year OS (Figure 8A). Furthermore, we compared the predictive accuracy of the nomogram with other clinical variables, indicating that the nomogram provided better survival prediction (Figure 8B).
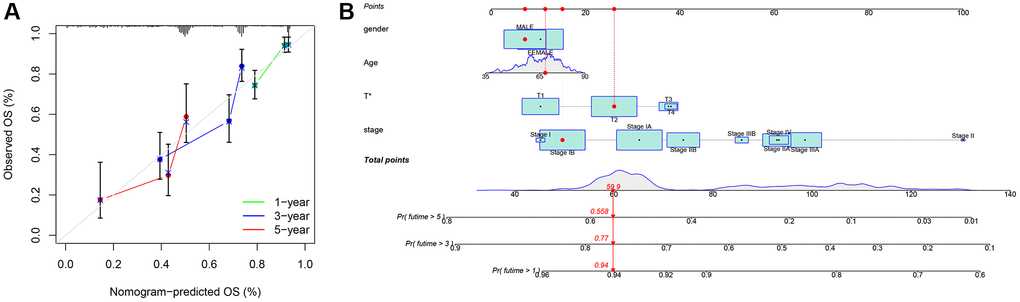
Figure 8. Nomogram. (A) Nomogram calibration chart; (B) Model nomogram.
We first examined the expression relationship of immune checkpoint genes between high and low groups, noting significant differences in several immune checkpoints (Figure 9A). Using CIBERSORT, we associated key genes with immune cell infiltration. Stars indicate significant correlations; the deeper the color, the stronger the correlation, as evident with these two genes showing clear relevance to monocytes (Figure 9B), and most being significantly correlated with immune cells. Drug sensitivity analysis revealed these key genes to have apparent correlations with several drugs (Figure 9C).
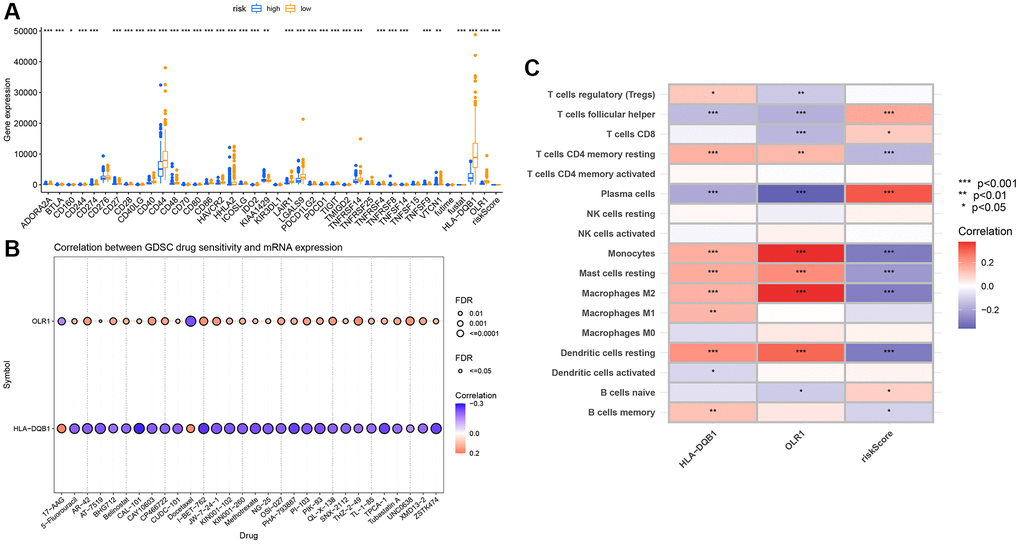
Figure 9. Immune infiltration analysis of key genes. (A) Immune checkpoint differential box plot; (B) Correlation analysis between key genes and immune infiltration; (C) Drug sensitivity analysis.
Discussion
In lung cancer research, monocytes, particularly inflammatory monocytes, play a crucial role in the progression of the disease. Studies have linked these cells with lung squamous carcinoma, where they contribute to tumor growth through the promotion of fibrin cross-linking [27]. These monocytes are intimately associated with secretory-type lung cancers, influencing the tumor microenvironment by fostering tumor growth, angiogenesis, metastasis, chemotherapy resistance, and immune suppression. Moreover, alterations in these cells within the tumor microenvironment are tied to overall patient survival, especially as they differentiate into tumor-associated macrophages and dendritic cells. The current limitations in lung cancer treatment include an insufficient understanding of the disease’s complex heterogeneity and resistance to existing therapies. The development of precision target therapies, especially the introduction of immune checkpoint inhibitors, has revolutionized lung cancer treatment [28]. However, the success rate remains limited, with up to 70% of patients being non-responsive to these treatments. Thus, monocytes and their derivatives, such as tumor-associated macrophages, emerge as potential new therapeutic targets. A deeper understanding of the role of monocytes in the tumor microenvironment could lead to more effective treatment strategies, thereby improving the prognosis for lung cancer patients [29].
In a recent study on lung cancer, we made significant discoveries through an integrated analysis of data from the Gene Expression Omnibus (GEO) and The Cancer Genome Atlas (TCGA). Initially, we harnessed single-cell data for lung adenocarcinoma from the GEO database, particularly the GSE117570 dataset, along with lung cancer sample data from TCGA, which provided a wealth of information for our investigation. Delving deep into this data, we identified 3076 autophagy-related genes and extracted relevant clinical pathological information. In terms of single-cell data analysis, we employed tools such as Seurat for data quality control, normalization, and Principal Component Analysis (PCA), as well as t-SNE for non-linear dimension reduction. These steps enabled us to clearly identify and annotate different cell populations, especially monocytes, laying a crucial foundation for our subsequent research. Moving forward, we used the “Limma” package for differential analysis of TCGA data and coupled it with the CIBERSORT algorithm to estimate the proportion of immune cell infiltration in lung cancer samples. These analyses highlighted the significant role of monocytes in lung cancer. Through weighted gene co-expression network analysis using the WGCNA package, we further identified gene modules closely related to monocytes and delved into these genes.
Key findings include the selection of 7 critical genes through consensus clustering analysis, upon which we built a prognostic model for lung cancer. The Lasso Cox regression and multivariable Cox analysis helped reduce the risk of overfitting in our model, ensuring its accuracy and reliability. Additionally, we developed a predictive nomogram and validated its accuracy in forecasting 1-year, 3-year, and 5-year survival events using calibration plots. Among the key genes identified were HLA-DQB1 and OLR1. The HLA-DQB1 gene, a part of the human leukocyte antigen (HLA) complex gene family, encodes a vital protein in the immune system, crucial for distinguishing self from non-self proteins. Studies have shown that lower expression levels of HLA-DQB1 in lung adenocarcinoma tissue correlate with a reduced recurrence rate in patients, indicating its significant role in the immune response and prognosis of lung adenocarcinoma [30]. The OLR1 gene, coding for an oxidized low-density lipoprotein receptor, is associated with tumor metastasis and apoptosis. Although its direct link to lung cancer is not explicitly established, its role in tumor biology suggests a potential impact on lung cancer progression. These two genes could play key roles in the pathogenesis and treatment of lung cancer [31]. However, our study has limitations. Since the data were sourced from public databases, we couldn’t control the quality and consistency of sample collection and processing. Moreover, our research focused mainly on gene expression data, while other aspects of the lung cancer microenvironment, such as intercellular communication and the role of the tumor extracellular matrix, are also critical factors affecting treatment outcomes. Future research will require validation in larger, independent sample cohorts and should consider these additional aspects of the tumor microenvironment.
Author Contributions
Liang Guo, Juanjuan Li and Bo Tao conceived and designed the study. Bo Tao, Ziming Wang, Dacheng Xie, Hongxue Cui and Bin Zhao performed the data analysis. Liang Guo and Juanjuan Li wrote the manuscript. All authors reviewed the manuscript and approved the submitted version.
Conflicts of Interest
The authors declare no conflicts of interest related to this study.
Funding
This study was supported by the Fundamental Research Funds for the Central Universities (No. 22120220650), National Natural Science Foundation of China (82300068) and Shanghai Science and Technology Commission Funds (No. 21ZR1453700).
References
- 1. Cao M, Chen W. Epidemiology of lung cancer in China. Thorac Cancer. 2019; 10:3–7. https://doi.org/10.1111/1759-7714.12916 [PubMed]
- 2. Qadhi OA, Alghamdi A, Alshael D, Alanazi MF, Syed W, Alsulaihim IN, Al-Rawi MBA. Knowledge and awareness of warning signs about Lung cancer among Pharmacy and Nursing undergraduates in Riyadh, Saudi Arabia - an observational study. J Cancer. 2023; 14:3378–86. https://doi.org/10.7150/jca.89358 [PubMed]
- 3. Evangelista LS, Sarna L, Brecht ML, Padilla G, Chen J. Health perceptions and risk behaviors of lung cancer survivors. Heart Lung. 2003; 32:131–9. https://doi.org/10.1067/mhl.2003.12 [PubMed]
- 4. Cheng TY, Cramb SM, Baade PD, Youlden DR, Nwogu C, Reid ME. The International Epidemiology of Lung Cancer: Latest Trends, Disparities, and Tumor Characteristics. J Thorac Oncol. 2016; 11:1653–71. https://doi.org/10.1016/j.jtho.2016.05.021 [PubMed]
- 5. Shi Y, Wang Y, Huang W, Wang Y, Wang R, Yuan Y. Integration of Metabolomics and Transcriptomics To Reveal Metabolic Characteristics and Key Targets Associated with Cisplatin Resistance in Nonsmall Cell Lung Cancer. J Proteome Res. 2019; 18:3259–67. https://doi.org/10.1021/acs.jproteome.9b00209 [PubMed]
- 6. Abdellatif AAH, Scagnetti G, Younis MA, Bouazzaoui A, Tawfeek HM, Aldosari BN, Almurshedi AS, Alsharidah M, Rugaie OA, Davies MPA, Liloglou T, Ross K, Saleem I. Non-coding RNA-directed therapeutics in lung cancer: Delivery technologies and clinical applications. Colloids Surf B Biointerfaces. 2023; 229:113466. https://doi.org/10.1016/j.colsurfb.2023.113466 [PubMed]
- 7. Kang X, Chen Y, Yi B, Yan X, Jiang C, Chen B, Lu L, Sun Y, Shi R. An integrative microenvironment approach for laryngeal carcinoma: the role of immune/methylation/autophagy signatures on disease clinical prognosis and single-cell genotypes. J Cancer. 2021; 12:4148–71. https://doi.org/10.7150/jca.58076 [PubMed]
- 8. Malik P, Mukherjee TK. Recent advances in gold and silver nanoparticle based therapies for lung and breast cancers. Int J Pharm. 2018; 553:483–509. https://doi.org/10.1016/j.ijpharm.2018.10.048 [PubMed]
- 9. Cui J, Hu YF, Feng XM, Tian T, Guo YH, Ma JW, Nan KJ, Zhang HY. EGFR inhibitors and autophagy in cancer treatment. Tumour Biol. 2014; 35:11701–9. https://doi.org/10.1007/s13277-014-2660-z [PubMed]
- 10. Kim N, Kim HK, Lee K, Hong Y, Cho JH, Choi JW, Lee JI, Suh YL, Ku BM, Eum HH, Choi S, Choi YL, Joung JG, et al. Single-cell RNA sequencing demonstrates the molecular and cellular reprogramming of metastatic lung adenocarcinoma. Nat Commun. 2020; 11:2285. https://doi.org/10.1038/s41467-020-16164-1 [PubMed]
- 11. Dai J, Jiang M, He K, Wang H, Chen P, Guo H, Zhao W, Lu H, He Y, Zhou C. DNA Damage Response and Repair Gene Alterations Increase Tumor Mutational Burden and Promote Poor Prognosis of Advanced Lung Cancer. Front Oncol. 2021; 11:708294. https://doi.org/10.3389/fonc.2021.708294 [PubMed]
- 12. Clough E, Barrett T. The Gene Expression Omnibus Database. Methods Mol Biol. 2016; 1418:93–110. https://doi.org/10.1007/978-1-4939-3578-9_5 [PubMed]
- 13. Zhang Z, Li H, Jiang S, Li R, Li W, Chen H, Bo X. A survey and evaluation of Web-based tools/databases for variant analysis of TCGA data. Brief Bioinform. 2019; 20:1524–41. https://doi.org/10.1093/bib/bby023 [PubMed]
- 14. Nordmann E, McAleer P, Toivo W, Paterson H, DeBruine LM. Data visualization using R for researchers who do not use R. Adv Methods Pract Psychol Sci. 2022; 5:1–36. https://doi.org/10.1177/25152459221074654
- 15. Tharwat A. Principal component analysis - a tutorial. IJAPR. 2016; 3:197–240. https://doi.org/10.1504/IJAPR.2016.079733
- 16. Xiang R, Wang W, Yang L, Wang S, Xu C, Chen X. A Comparison for Dimensionality Reduction Methods of Single-Cell RNA-seq Data. Front Genet. 2021; 12:646936. https://doi.org/10.3389/fgene.2021.646936 [PubMed]
- 17. Li H, Wang W, Huang Z, Zhang P, Liu L, Sha X, Wang S, Zhou YL, Shi J. Exploration of the shared genes and signaling pathways between lung adenocarcinoma and idiopathic pulmonary fibrosis. J Thorac Dis. 2023; 15:3054–68. https://doi.org/10.21037/jtd-22-1522 [PubMed]
- 18. Chen B, Khodadoust MS, Liu CL, Newman AM, Alizadeh AA. Profiling Tumor Infiltrating Immune Cells with CIBERSORT. Methods Mol Biol. 2018; 1711:243–59. https://doi.org/10.1007/978-1-4939-7493-1_12 [PubMed]
- 19. Tian Z, He W, Tang J, Liao X, Yang Q, Wu Y, Wu G. Identification of Important Modules and Biomarkers in Breast Cancer Based on WGCNA. Onco Targets Ther. 2020; 13:6805–17. https://doi.org/10.2147/OTT.S258439 [PubMed]
- 20. Horr C, Buechler SA. Breast Cancer Consensus Subtypes: A system for subtyping breast cancer tumors based on gene expression. NPJ Breast Cancer. 2021; 7:136. https://doi.org/10.1038/s41523-021-00345-2 [PubMed]
- 21. Castanza AS, Recla JM, Eby D, Thorvaldsdóttir H, Bult CJ, Mesirov JP. Extending support for mouse data in the Molecular Signatures Database (MSigDB). Nat Methods. 2023; 20:1619–20. https://doi.org/10.1038/s41592-023-02014-7 [PubMed]
- 22. Pawar A, Chowdhury OR, Salvi O. A narrative review of survival analysis in oncology using R. Cancer Res Stat Treat. 2022; 5:554–61. https://doi.org/10.4103/crst.crst_230_22
- 23. Shahraki HR, Salehi A, Zare N. Survival Prognostic Factors of Male Breast Cancer in Southern Iran: a LASSO-Cox Regression Approach. Asian Pac J Cancer Prev. 2015; 16:6773–7. https://doi.org/10.7314/apjcp.2015.16.15.6773 [PubMed]
- 24. Dunnington DW, Libera N, Kurek J, Spooner IS, Gagnon GA. tidypaleo: Visualizing Paleoenvironmental Archives Using ggplot2. J Stat Softw. 2022; 101:1–20. https://doi.org/10.18637/jss.v101.i07
- 25. Zhou M, Zhao H, Wang Z, Cheng L, Yang L, Shi H, Yang H, Sun J. Identification and validation of potential prognostic lncRNA biomarkers for predicting survival in patients with multiple myeloma. J Exp Clin Cancer Res. 2015; 34:102. https://doi.org/10.1186/s13046-015-0219-5 [PubMed]
- 26. Jalali A, Alvarez-Iglesias A, Roshan D, Newell J. Visualising statistical models using dynamic nomograms. PLoS One. 2019; 14:e0225253. https://doi.org/10.1371/journal.pone.0225253 [PubMed]
- 27. Blaisdell A, Crequer A, Columbus D, Daikoku T, Mittal K, Dey SK, Erlebacher A. Neutrophils Oppose Uterine Epithelial Carcinogenesis via Debridement of Hypoxic Tumor Cells. Cancer Cell. 2015; 28:785–99. https://doi.org/10.1016/j.ccell.2015.11.005 [PubMed]
- 28. Wang DC, Wang W, Zhu B, Wang X. Lung Cancer Heterogeneity and New Strategies for Drug Therapy. Annu Rev Pharmacol Toxicol. 2018; 58:531–46. https://doi.org/10.1146/annurev-pharmtox-010716-104523 [PubMed]
- 29. Ugel S, Canè S, De Sanctis F, Bronte V. Monocytes in the Tumor Microenvironment. Annu Rev Pathol. 2021; 16:93–122. https://doi.org/10.1146/annurev-pathmechdis-012418-013058 [PubMed]
- 30. Zhang L, Li M, Deng B, Dai N, Feng Y, Shan J, Yang Y, Mao C, Huang P, Xu C, Wang D. HLA-DQB1 expression on tumor cells is a novel favorable prognostic factor for relapse in early-stage lung adenocarcinoma. Cancer Manag Res. 2019; 11:2605–16. https://doi.org/10.2147/CMAR.S197855 [PubMed]
- 31. Jiang L, Jiang S, Zhou W, Huang J, Lin Y, Long H, Luo Q. Oxidized low density lipoprotein receptor 1 promotes lung metastases of osteosarcomas through regulating the epithelial-mesenchymal transition. J Transl Med. 2019; 17:369. https://doi.org/10.1186/s12967-019-2107-9 [PubMed]