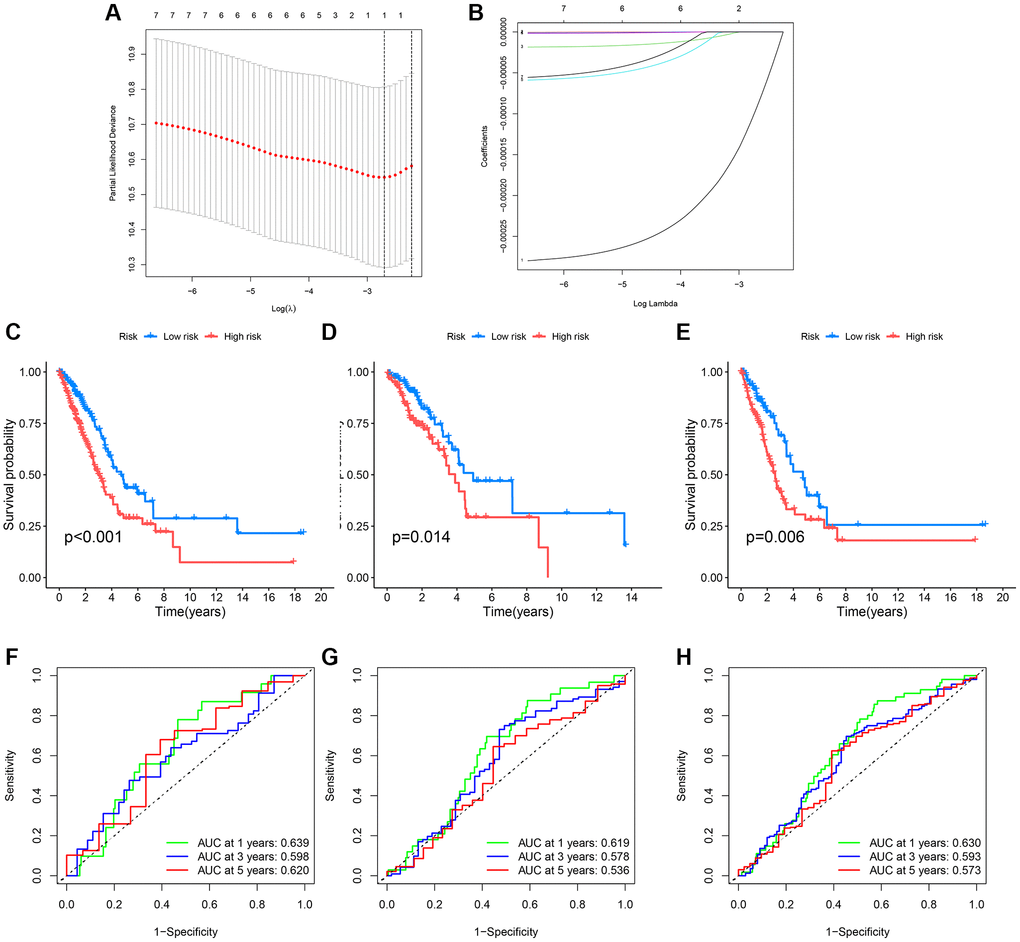
Figure 6.Survival curves and ROC analysis of the risk model in training and testing groups. (A, B) Lasso analysis display; (C–E) Survival curves showing prognostic survival status for different models; (F–H) ROC curves predicting 1-year, 3-year, and 5-year survival sensitivity and specificity based on risk scores in training, testing, and entire cohorts.