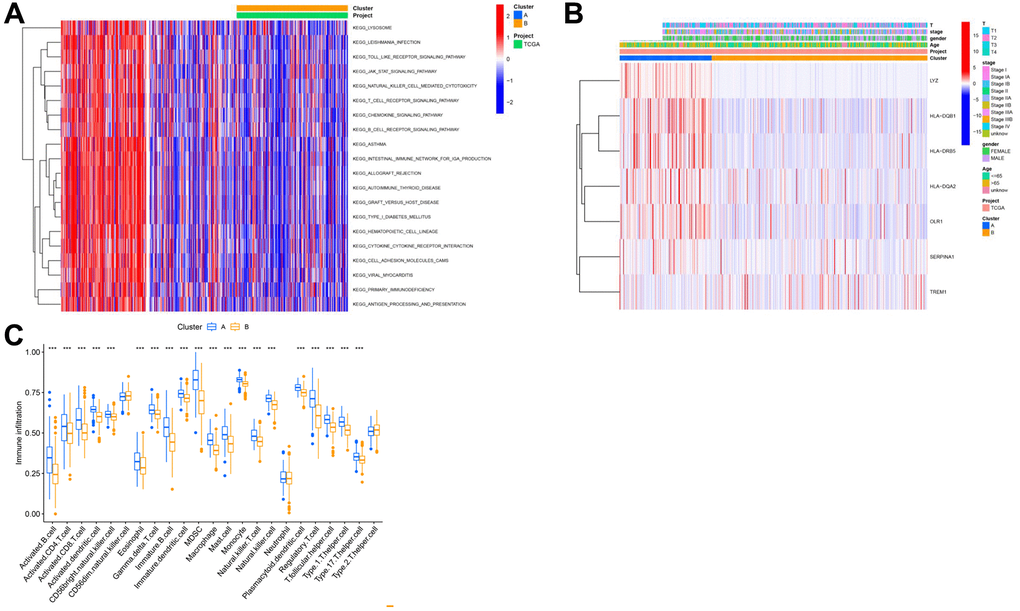
Figure 5.Analysis of subtypes based on key genes. (A) GSEA analysis results of different cluster outcomes. (B) Heatmap of cluster subgroups and clinical characteristics; (C) ssgsea analysis results of different clusters.
Figure 5 — Exploring the prognostic analysis of autophagy and tumor microenvironment based on monocyte cells in lung cancer | Aging