Submit an Article
Navigate
Home
Editorial Board
Editorial Policies
Current Volume
Archive
Scientific Integrity
Publication Ethics Statements
Interviews with Outstanding Authors
Newsroom
Sponsored Conferences
Podcast
Contact
Special Collections
Submit an Article
Online ISSN: 1945-4589
Research Paper
|
Volume 16, Issue 13
|
pp. 10931–10942
Exploring the prognostic analysis of autophagy and tumor microenvironment based on monocyte cells in lung cancer
Back to article
Figure 2
(2 of 9)
−
100%
+
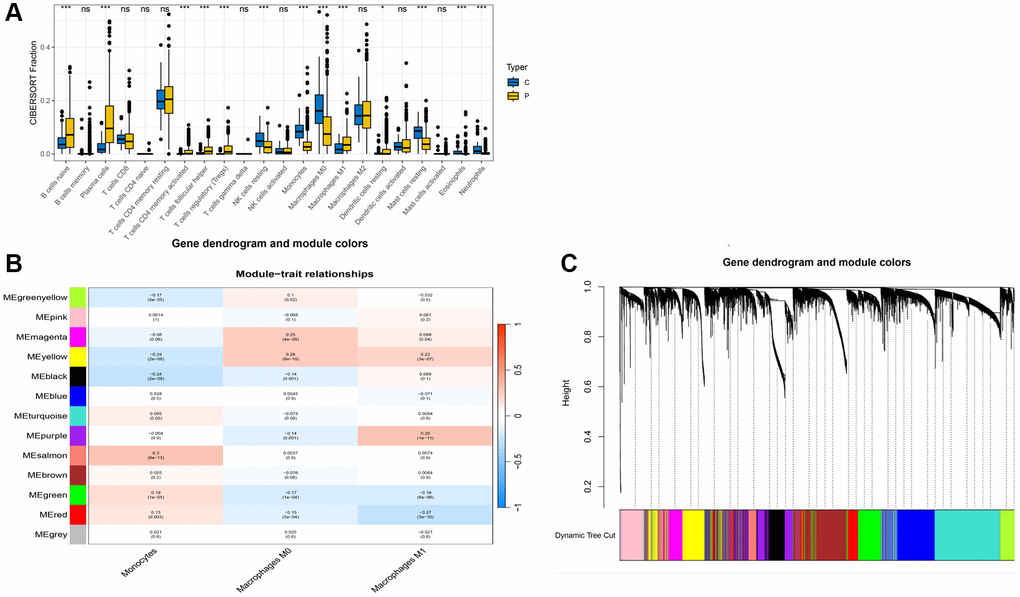
Figure 2.
WGCNA analysis results.
(
A
) Box plot of immune cell differences between groups; (
B
) Selection of modules associated with immune cells; (
C
) Distribution of subgroups in data.