


Introduction
Osteosarcoma (OS), a common primary malignant tumor, accounts for 20% of all primary malignant bone tumors. Children, adolescents, and young adults aged 10–25 years are commonly affected by OS [1], which is characterized by a high degree of malignancy, increased recurrence, and early lung metastasis [2]. Recent advances in therapeutic methods for OS, including neoadjuvant chemotherapy, surgical resection of the primary tumor, and adjuvant chemotherapy [3], have not improved the 5-year survival rates for localized disease (50%–70%) and metastatic and recurrent OS (less than 20%) [4].
The human microbiome comprises various microorganisms (such as bacteria, fungi, archaea, protozoa, and viruses) and inhabits the surface of the human epithelial barrier. The intestinal microbiome is strongly associated with host health and disease status [5–7]. Gut microbiota regulates host metabolism, immunity, and nervous system. Additionally, gut microbiota is associated with cancer development [8–11]. Recent studies have demonstrated that Helicobacter pylori is a risk factor for gastric cancer [12]. The abundance of Faecalibacterium prausnitzii and Blautia sp. is correlated with the malignancy of breast cancer [13]. Studies on the tumor-related pathway have revealed that gut microbiota can activate the calcineurin-NFAT pathway, promoting intestinal tumor development and supporting cancer stem cell survival in the mouse model [14]. Butyrate, which is produced by butyrate-producing intestinal bacteria, activates Gpr109a and suppresses colonic inflammation and carcinogenesis [15]. However, the correlation of gut microbiota and gut microbiota-related metabolites with OS has not been previously reported.
The gut microbiota composition is dynamic and is mainly influenced by various factors, including age, eating habits, and health and disease status, which modulate the diversity and metabolites of microorganisms. Additionally, variations in the gut microbiota metabolic spectrum promote physiological changes in both host and pathogenic microorganisms and consequently modulate disease progression [16]. Some metabolism and metabolic profiling studies have reported that metabolites are potential diagnostic markers for diseases [17]. Previous studies using the 16S rRNA gene sequencing approach have revealed that microbiome diversity and metabolites are correlated with disease pathogenesis. For example, enterogenous Candida albicans damages the intestinal mucosal barrier by modulating the gut microbiome [18]. Meanwhile, 3-carboxy-4-methyl-5-propyl-2-furanpropionic acid was identified in the plasma of patients with gestational diabetes, impaired glucose tolerance, and type 2 diabetes [19]. However, the OS-related microbiome composition and metabolites have not been previously reported.
This study aimed to evaluate the effects of OS on intestinal microbes and their metabolites. The fecal samples of the OS mouse model were examined to evaluate the changes in gut microbiota and gut microbiota-derived metabolites using 16S rRNA high-throughput sequencing and liquid chromatogram-mass spectrometry (LC-MS)-based non-targeted metabolomics, respectively. Additionally, the distribution of intestinal microbes and their metabolites, as well as the correlation between OS and intestinal microbes, were examined. The findings of this study can enable the development of probiotics and the identification of beneficial metabolites for OS.
Materials and Methods
Cell culture
The human OS cell line (Saos-2) was obtained from the American Type Culture Collection (Manassas, VA, USA) and cultured in Dulbecco’s modified Eagle’s medium-F12 with low glucose (Gibco, USA) supplemented with 10% fetal bovine serum, 100 U/mL penicillin and 100 lg/mL streptomycin in a humidified atmosphere at 5% CO2 and 37°C.
Animal experiments
Female BALB/c nude mice aged 4 weeks were purchased from a specific pathogen-free (SPF) animal center (Charles River Laboratory, Beijing, China). Mice were maintained at the SPF animals center under the following standard laboratory conditions: temperature, 25°C ± 3°C; humidity, 53% ± 3%, circadian cycle, 12-h light/dark cycle; access to food and water, ad libitum. After adaptive feeding for 1 week, 14 mice were randomly divided into the following two groups (7 mice/group): NCG and OG. Nude mice aged 5 weeks in the OG were subcutaneously implanted with 1 × 10⁶ Saos-2 cells mixed with 200 μL Matrigel (Corning, NY, USA) into the back flank of each mouse. Meanwhile, mice in the NCG were administered with 200 μL Matrigel (Corning, NY, USA) at the same site. The tumor exhibited good growth in the OG at week 2 post-administration. The OS animal model was successfully established at week 3 post-administration (Figure 1).
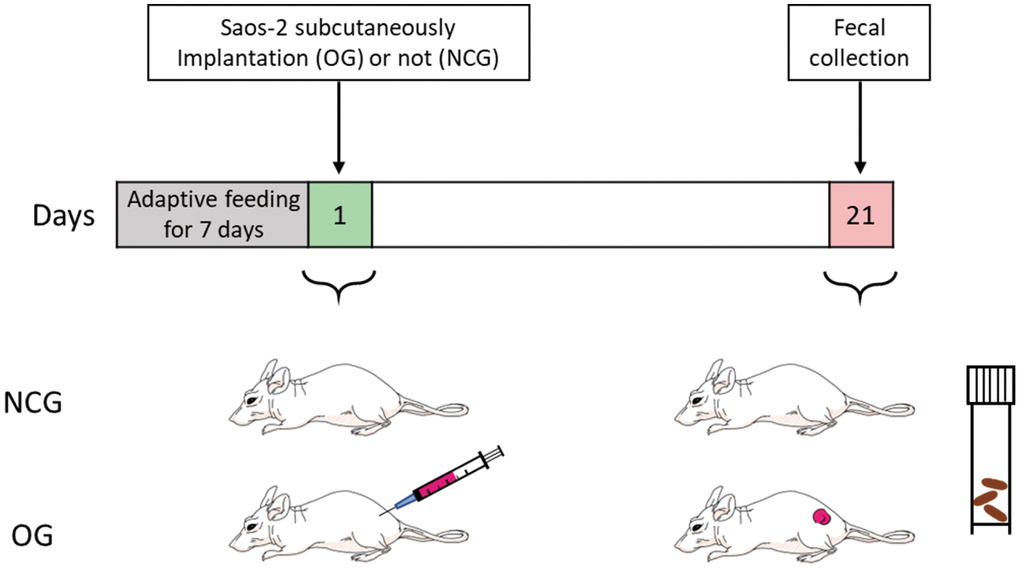
Figure 1. Construction of the osteosarcoma mouse model with Saos-2 OS cells. NCG represents the control group, OG represents the osteosarcoma group. n = 7.
Fecal sample collection
The fresh fecal samples of the NCG and OG were collected and rapidly stored at −80°C in sterile freezing tubes. Next, the fecal samples were subjected to 16S rRNA gene sequencing and untargeted metabolomics analysis. All mice were anesthetized via CO2 inhalation and humanely euthanized.
DNA extraction and 16S rRNA gene sequencing
The fecal samples from the NCG and OG were subjected to 16S rRNA sequencing and metabolomics analyses. The genomic DNA was extracted from the fecal samples using the MagPure soil DNA LQ kit (Magen, Guangdong, China), following the manufacturer’s instructions. DNA concentrations and integrities were determined using a NanoDrop 2000C spectrophotometer (Thermo Fisher Scientific, Waltham, MA, USA) and gel electrophoresis. To analyze fecal bacterial diversity, V3–V4 hypervariable regions of the bacterial 16S rRNA genes were amplified with the universal primers 343 F (5′-TACGGRAGGCAGCAG-3′) and 798 R (5′-AGGGTATCTAATCCT-3′). The reverse primer comprised a sample barcode, while both forward and reverse primers were ligated with an Illumina sequencing adapter. Sequencing was performed using an Illumina NovaSeq6000 platform with two paired-end read cycles of 250 bases each (Illumina Inc., San Diego, CA, USA; OE BioTech Company; Shanghai, China). The quality of amplicons was tested, and the raw data were obtained in the FASTQ format. The assembly parameters were as follows: minimum overlap, 10 bp; maximum overlap, 200 bp; maximum error ratio, 20%. Homologous sequences with a size of < 200 bp were removed, whereas sequences with 75% of the base readings above Q20 were retained. Clean tags were removed using UCHIME [20] to obtain valid tags for preparing operational taxonomic units (OTUs). After removing the primer sequences and clustering with a cutoff value of 97% similarity, the OTUs were classified using Vsearch software (version 2.4.2) [21]. The QIIME package was used to select the representative reading of each OTU. The species of all representative reads above the confidence threshold of 70% were annotated using the RDP classifier with the Silva database (version 123) [22].
Metabolomic data processing and analysis
The fecal samples from the NCG and OG were subjected to metabolomics analysis, which was performed by OE BioTech (Shanghai China). Each fecal sample (50 mg) was mixed with 500 μL of extraction solvent (methanol/water 4:1 ratio, v/v) and 40 μL of internal standard solution (2-chloro-L-phenylalanine in methanol, 3 g/L) in a 2-mL microcentrifuge tube, and the mixture was sonicated at 60 Hz for 3 min. Next, the samples were incubated with 120 μL of chloroform, vigorously vortexed, and subjected to ultrasonic extraction at 25°C for 20 min. The samples were then centrifuged at 13,680 g and 4°C for 20 min. The supernatant was dried under vacuum for 30 min at 25°C and dissolved in 80 μL methoxyamine hydrochloride in pyridine (15 mg/μL). After vigorously vortexing for 10 min, the products were incubated at room temperature for 80 min, followed by incubation with 20 μL of n-hexane and 60 μL of N, O-bis(trimethylsilyl)trifluoroacetamide (containing 2% trimethylchlorosilane), vigorous vortexing for 3 min, and derivatization at 65°C for 70 min. The results were analyzed using a gas chromatography system (Agilent 7890 B System) coupled to the Agilent 5977 A MSD System (Agilent Technology, Santa Clara, CA, USA). Based on the standard protocol, the derivatives were separated using a DB-5MS fused silica capillary column (30 mm × 0.25 mm × 0.25 μm) (Agilent Technology, USA). Mass spectrometry data (m/z 50–500) were obtained under the full-scan mode. To check the data reproducibility, quality control samples were injected regularly throughout the analysis process [23, 24].
Untargeted metabolomics data analysis
The metabolome raw data were collected using Unifi 1.8.1 and processed using the Progenesis Qi V2.3 software (Nonlinear Dynamics, Newcastle, UK). The compounds were identified using The Human Metabolome Database, Lipidmaps (V2.3), METLIN databases, and self-built databases based on the accurate mass number, secondary fragments, and isotope distribution. The compounds were qualitatively screened according to the screening standard of 36 points. Compounds with < 36 points were considered to be inaccurate and deleted (full score = 60 points). Principal component analysis (PCA) and orthogonal partial least squares discriminant analysis (OPLS-DA) were performed to examine the differential metabolic profiles between the two groups. The Hotelling’s T2 region demonstrated an ellipse shape in the model score, which was defined at a 95% confidence interval for model variation. In OPLS-DA, variable importance in projection (VIP) was employed to measure the influence and explanatory ability of the samples in each group. A VIP score of > 1 was considered the cutoff value. Differential metabolites were selected according to the threshold of significant variables obtained from the OPLS-DA model based on VIP values and p-values obtained from two-tailed Student’s t-test of normalized peak areas. Metabolites with VIP values > 1.0 and p < 0.05 were considered to be differential metabolites.
Statistical analysis
Means were compared using Student’s t-test with SPSS 22.0 software. The levels of the gut microbiota and metabolites were analyzed using the Wilcoxon test, Bray-Curtis distance, Euclidean distance, and Unifrac and presented as mean ± standard error of mean. Differences were considered significant at P < 0.05. The correlation between the gut microbiome and metabolites was analyzed based on Pearson’s correlation coefficients.
Results
Alterations of the diversity and abundance of gut microbiota species in the OS mouse model
This study performed 16S rRNA high-throughput gene sequencing to examine the effect of OS on the gut microbiota. Venn diagram of the OTU distribution revealed changes in the microbiota composition in the OG. In total, 6,444 OTUs were identified in the NCG and OG. Of these, the NCG and OG had 1,421 and 1,243 unique OTUs, respectively. Additionally, 3,780 and 1291 were shared and differential OTUs, respectively, between the groups (Figure 2A and Supplementary Table 1). Alpha diversity analysis was performed to evaluate community diversity and abundance in gut microbiota. Rarefaction curve, Chao1 index, and Good’s coverage index revealed that the sequencing depth was sufficient and could provide coverage of the majority of microbiota diversity in each sample (Figure 2B, 2C). Compared with those in the NCG, the Shannon and Simpson diversity indices were lower in the OS. This indicated that OS decreased the bacterial community diversity and richness (P < 0.05) (Figure 2D, 2E). Next, beta diversity, which reflects differential species abundance between the two groups, was examined. Two-dimensional (2D) and three-dimensional (3D) PCA revealed that the gut microbiota of the NCG and OG separated into two distinct clusters, indicating the differential gut microbiota composition between the NCG and OG (P < 0.05) (Figure 3A, 3B).
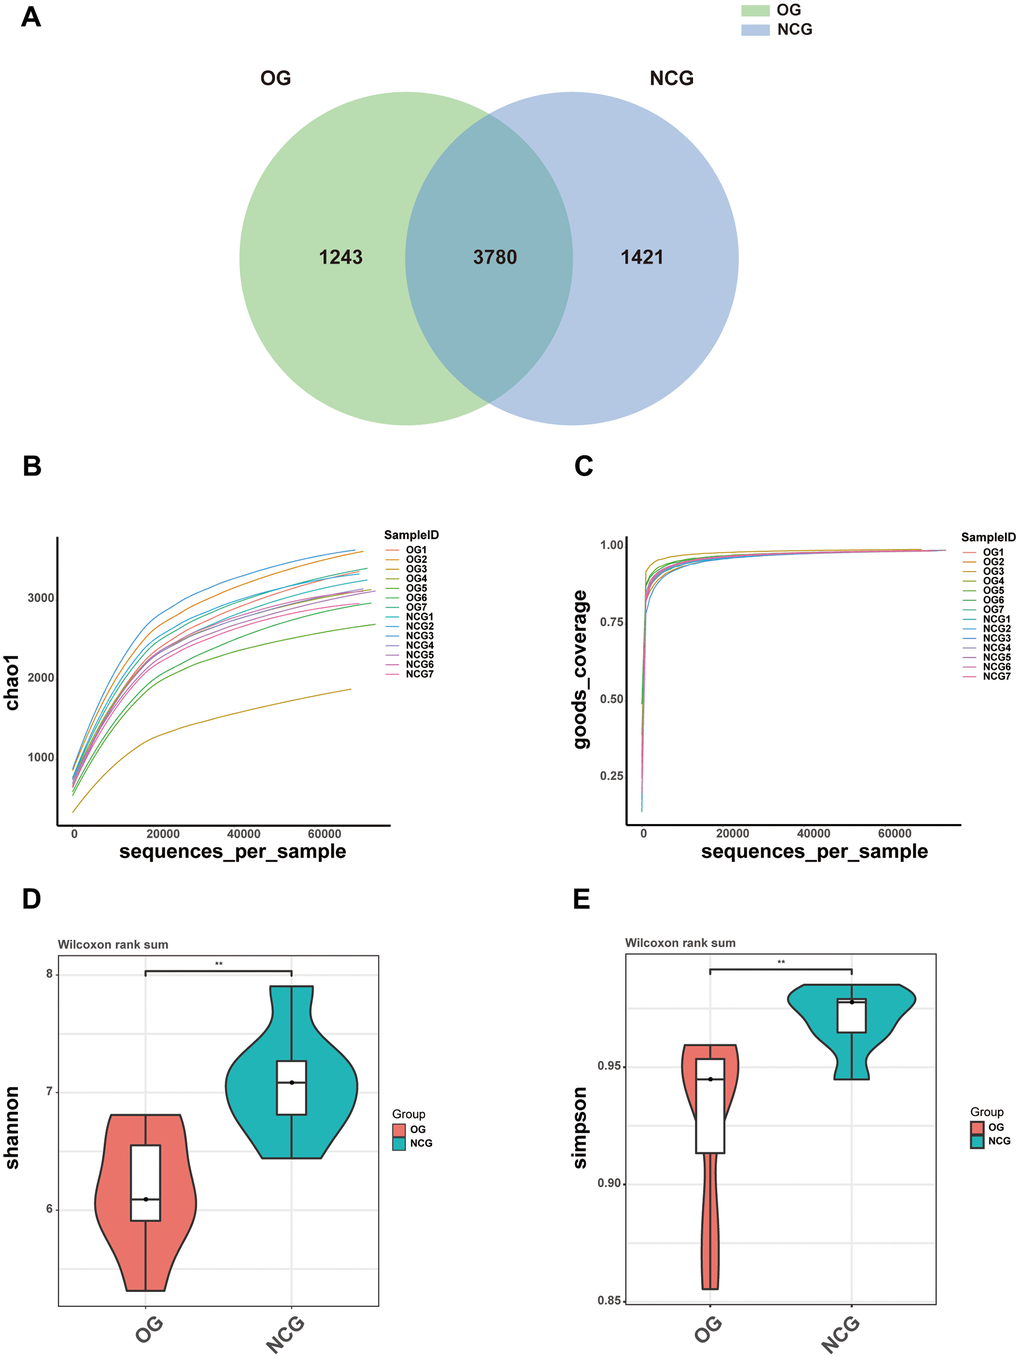
Figure 2. (A) Venn diagram showing the numbers of operational taxonomic units (OTUs) between NCG and OG. (B–E) Alpha diversity of samples from the NCG and OG groups. (B) Rarefaction curves with Chao1 index. (C) Rarefaction curves with Good’s coverage index. (D) Violin plot of Shannon index. (E) Violin plot of Simpson index. Data are represented as mean ± standard error of mean. n = 7; *P < 0.05, **P < 0.01, ***P < 0.001, and ****P < 0.0001; ns, non-significant.
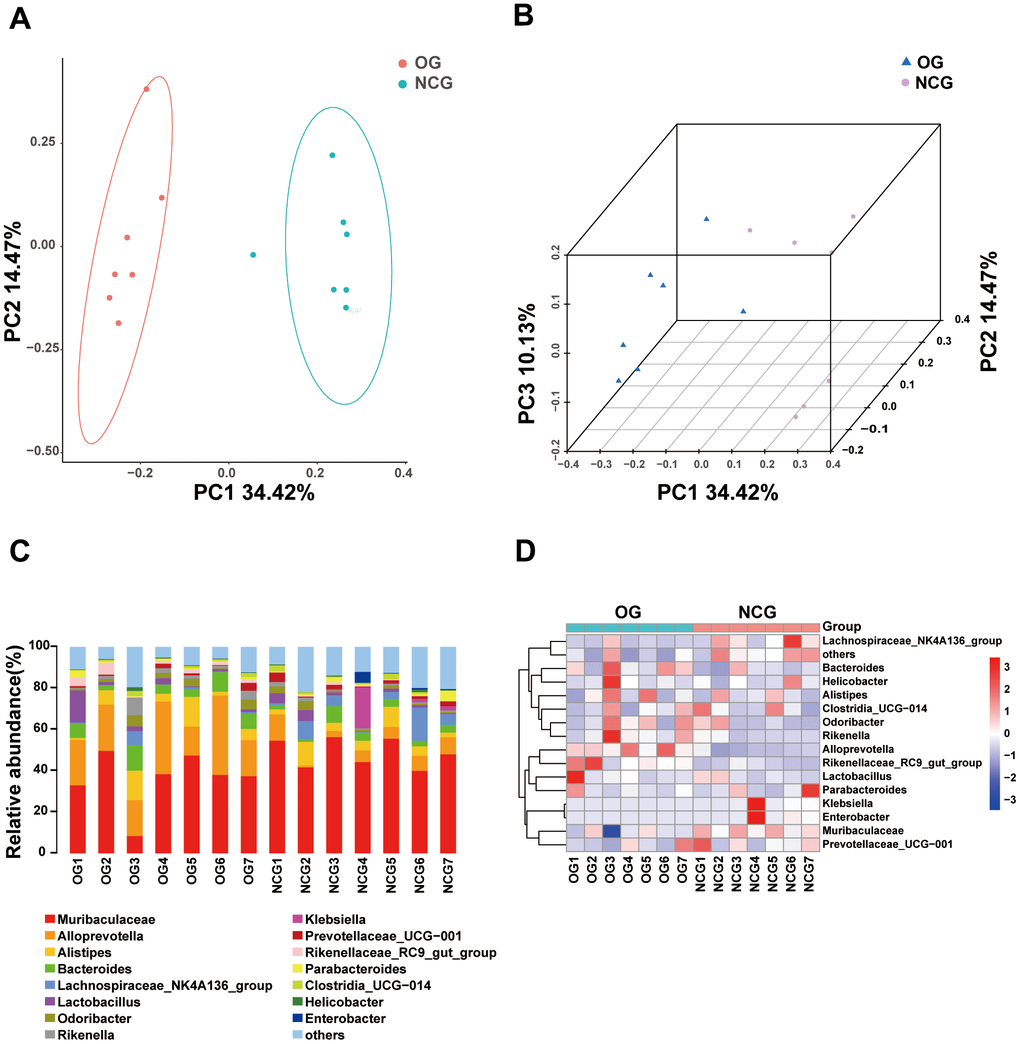
Figure 3. (A) Two-dimensional principal coordinate analysis (PCA) model of gut microbiota. NCG: green, OG: orange. (B) Two-dimensional PCA of gut microbiota. NCG: purple, OS: blue. (C) Stacked bar chart of the abundance of microbes at the genus level. (D) Heatmap of the abundance of microbes at the genus level. n = 7.
Stacked bar charts and heatmaps of the top 15 phylum, classes, orders, families, genus, and species were generated to perform a species analysis. The genus-level analysis result is shown in Figure 3C, 3D, while the results of analysis at other levels are shown in Supplementary Figure 1. Further, a linear discriminant analysis effect size analysis was performed to assess the significant differences in the abundance of the species between the two groups. The correlation between different taxa from the phylum to the species levels is shown in the cladogram in Figure 4A, 4B. The histograms and heatmaps of abundances at the genus level are shown in Figure 4C, 4D. Among the top 10 differential genera between the NCG and OG, Alloprevotella and Rikenellaceae_RC9_gut_group were upregulated, whereas Muribaculaceae, Klebsiella, Colidextribacter, Lachnospiraceae_FCS020_group, Muribaculum, A2, Oscillibacter, and Roseburia were downregulated.
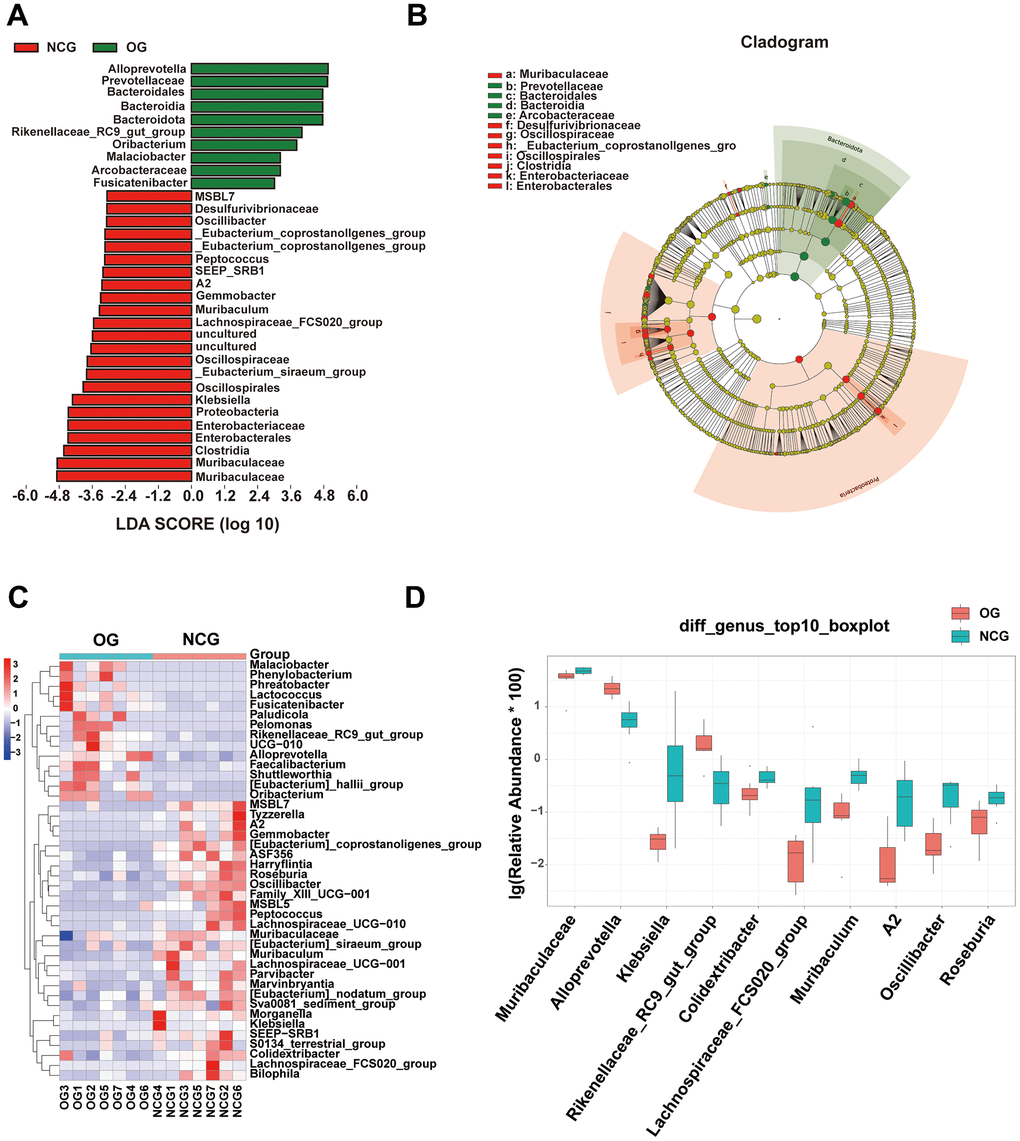
Figure 4. (A) Linear discriminant analysis effect size of gut microbiota in the NCG and OG. Red represents increased microbial abundance in the NCG; green represents increased microbial abundance in the OG. (B) The correlations among different taxa from the phylum to species levels are shown in the cladogram. (C) Heatmap showing differential bacterial genera. (D) Histogram of the top 10 differential bacteria at the genus level. Wilcoxon test (P < 0.05; n = 7).
OS altered the composition of gut microbiota-derived metabolites
This study aimed to examine the effects of OS on intestinal microbes and their metabolites. Changes in the metabolic spectrum may indicate changes in the dynamics of the intestinal microbiome. Metabolic changes are correlated with the host’s health status and are considered a crucial hallmark of disease [25]. To evaluate the effect of OS on the metabolic profiles of gut microbiota in the mouse model, untargeted metabolomics analysis (LC-MS and GC-MS) was performed by OE BioTech (Shanghai, China) to detect differentially expressed metabolites and potential key metabolic pathways in the NCG and OG.
Multivariate analysis utilizes unsupervised PCA to examine the overall distribution between samples and the stability of the whole analysis process. Next, supervised PLS-DA and OPLS-DA were performed to distinguish the overall differences in metabolic profiles among the groups and identify the differential metabolites between the groups. Two-dimensional and three-dimensional PCA, PLS-DA, and OPLS-DA were performed to identify the differential metabolic profiles between the two groups (Figure 5A). Univariate analysis focuses on the description of univariate and statistical inference, which are used to select differential metabolites, and reflects the basic information contained in a large number of sample data in the simplest summary form. Additionally, the centralized or discrete trend in the sample data is described. The univariate statistical inference provides the overall information of the sample data, mainly including interval estimation and statistical hypothesis testing. Volcano maps and heatmaps were used to visualize the differential metabolites (Figure 5C–5F). The volcano diagram revealed different levels of metabolites in the two groups. LC-MS revealed 1094 differential metabolites (424 upregulated and 670 downregulated metabolites) between the two groups, while GC-MS revealed 115 differential metabolites (92 upregulated and 23 downregulated metabolites). The differential fecal metabolites between the two groups were subjected to Kyoto Encyclopedia of Genes and Genomes (KEGG) enrichment analysis. The top 20 differential metabolites are listed in Figure 5B. This study focused on the following three metabolic pathways associated with bone metabolism: aminoacyl-tRNA biosynthesis; mTOR signaling pathway; arginine and proline metabolism. The metabolites of these three pathways are shown in Supplementary Table 2.

Figure 5. (A) Orthogonal partial least squares discriminant analysis (OPLS-DA) of fecal metabolites between the NCG and OG. (B) Bubble diagram of the top 20 enriched Kyoto Encyclopedia of Genes and Genomes (KEGG) pathways. (C) Heatmap of fecal metabolites identified using gas chromatography-mass spectrometry (GC-MS). (D) Heatmap of fecal metabolites identified using liquid chromatography-mass spectrometry (LC-MS). (E) Volcano map displaying differential fecal metabolites identified using GC-MS. (F) Volcano map displaying differential fecal metabolites identified using LC-MS. n = 7.
Correlation between differential gut microbial genera and fecal metabolome
The correlation heatmap and network of fecal differential metabolites in the three bone metabolism-related metabolic pathways and the top 10 differential genera are shown in Figure 6A, 6B (|r| > 0.5, P < 0.05). The analysis revealed multiple correlations between these fecal differential metabolites and the top 10 differential bacterial genera. For example, Alloprevotella was positively related with creatine (r = 0.778, P = 0.001), putrescine (r = 0.691, P = 0.006), L-proline (r = 0.649, P = 0.012), 4-hydroxyproline (r = 0.642, P = 0.013), L-tryptophan (r = 0.624, P = 0.017), L-histidine (r = 0.613, P = 0.019), ornithine (r = 0.599, P = 0.024), L-lysine (r = 0.576, P = 0.031), creatinine (r = 0.565, P = 0.035), adenosine-5′-monophosphate (r = 0.561, P = 0.037), and 5-aminovaleric acid (r = 0.561, P = 0.037). Rikenellaceae_RC9_gut_group was positively correlated with ornithine (r = 0.759, P = 0.002), putrescine (r = 0.698, P = 0.006), L-tryptophan (r = 0.690, P = 0.006), 5-aminovaleric acid (r = 0.608, P = 0.021), L-histidine (r = 0.605, P = 0.022), L-serine (r = 0.576, P = 0.032), adenosine-5’-monophosphate (r = 0.560, P = 0.037), L-phenylalanine (r = 0.552, P = 0.041), L-threonine (r = 0.549, P = 0.041), L-isoleucine (r = 0.537, P = 0.048), and creatine (r = 0.533, P = 0.049). Muribaculum was negatively correlated with ornithine (r = −0.723, P = 0.003), 4-hydroxyproline (r = −0.621, P = 0.018), L-phenylalanine (r = −0.594, P = 0.025), putrescine (r = −0.593, P = 0.025), creatine (r = −0.592, P = 0.026), L-tryptophan (r = −0.581, P = 0.029), creatinine (r = −0.579, P = 0.030), L-histidine (r = −0.551, P = 0.041), L-proline (r = −0.545, P = 0.044), spermidine (r = −0.539, P = 0.047), and 5-aminovaleric acid (r = −0.535, P = 0.048). These results suggest that the occurrence and development of OS are closely related to amino acid metabolism.
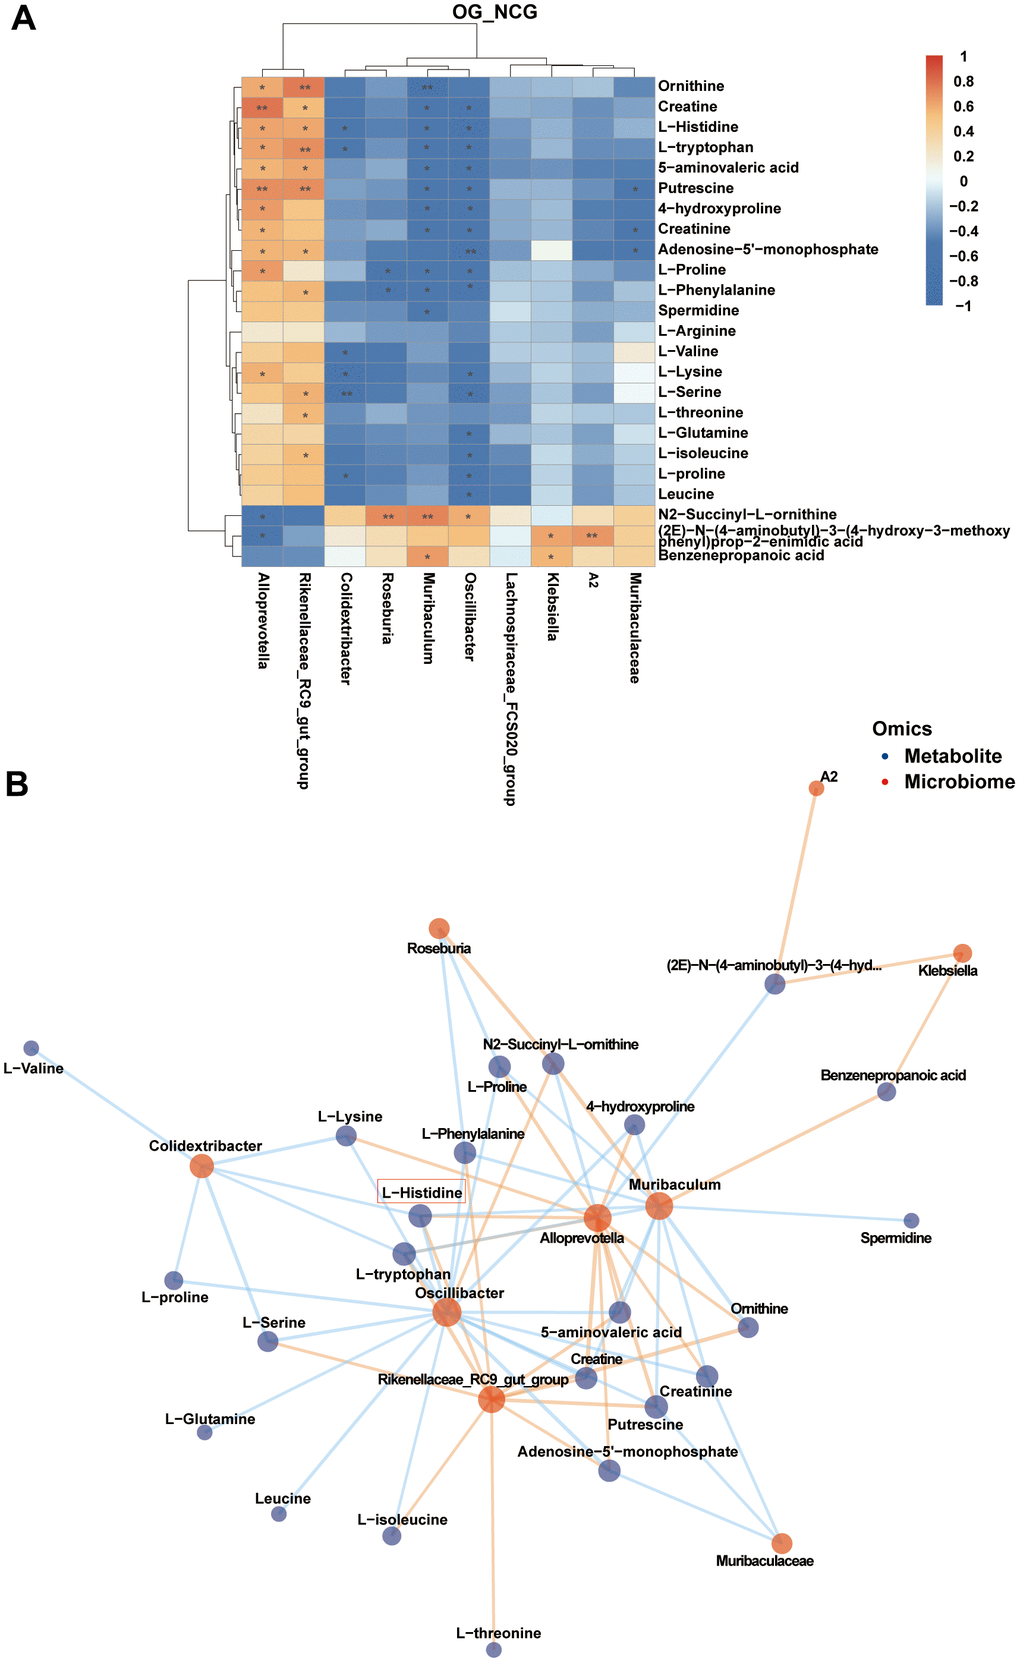
Figure 6. (A) Correlation heatmap between the top 10 differential bacterial genera and fecal metabolites associated with three metabolic pathways related to bone metabolism in the top 10 Kyoto Encyclopedia of Genes and Genomes (KEGG) pathways. |r| > 0.5, P < 0.05. (B) Correlation network map of the top 10 differential bacterial genera and fecal metabolites associated with three metabolic pathways related to bone metabolism in the top 10 KEGG pathways. |r| > 0.5, P < 0.05. n = 7.
Discussion
The number of genes encoded by the gut microbiota, which comprises the intestinal commensal, symbiotic, and pathogenic microorganisms, is more than 3 million, which is approximately 150 times higher than that encoded by the host genome. The gut microbiota regulates various functions of the host and consequently influences host health, phenotype, and diseases [26, 27]. Recently, examining the role of GM in various diseases has become a research hotspot. Dysbiosis is associated with several complex human intestinal and extra-intestinal diseases, obesity, diabetes, non-alcoholic liver disease, cardiovascular disease, malnutrition, gastrointestinal diseases, depression, Parkinson’s disease, and cancers [25, 28, 29]. Gut microbiota is involved in the development and progression of cancers [30]. Extra-intestinal tumor-associated microbiota has been identified in multiple human cancers, including breast, lung, and pancreatic cancers, melanoma tumors, and soft tissue sarcoma [31, 32]. Alice Tzeng et al. characterized the microbiome of human breast tissue. The breast tumor tissue exhibited distinct microbiome profiles, including increased proportions of Pseudomonas, Proteus, Porphyromonas, and Azomonas and decreased proportions of Propionibacterium and Staphylococcus at the genus level [33]. Erick Riquelme et al. examined the gut microbiota of short-term and long-term survivors among patients with pancreatic cancer who underwent tumor resection. The alpha diversity was upregulated in the long-term survivors. Additionally, an intra-tumoral microbiome signature that can predict long-term survival was identified. Deborah Nejman et al. revealed that the abundance of Proteobacteria phylum was upregulated in the lung tumors of smokers. Additionally, the authors reported that different tumor types exhibit distinct microbial composition [34]. Recently, Lauren M Perry et al. used metagenomic classification to investigate the gut microbiome in patients with soft tissue sarcoma [35]. However, the gut microbiota and gut microbiota-derived metabolites have not been elucidated for OS, which is the most common bone sarcoma.
Animal models, which cannot be replaced by in vitro models, are an important component of translational research [36]. Athymic nude mice, which are widely used as models in cancer research, bear spontaneous FOXN1 deletion and have dysfunctional or absent thymus, resulting in an impaired immune system with downregulation of T cells [37]. In this model, natural immunosuppression enables the development of the target tumor after the inoculation of cancer cells. Additionally, the tumor can be easily observed in athymic nude mice after subcutaneous injection due to the natural lack of hair [37]. In addition to analyzing tumor behavior, athymic mice have been used to examine the gut microbiome and its relation to cancer [32]. Therefore, this study established an athymic nude mouse model of OS to examine the abundance of gut microbiota and gut microbiota-derived metabolites and develop novel therapeutic strategies for OS.
Microbial diversity was evaluated using 16S rDNA sequencing, which enables high-throughput sequencing of all bacteria in a particular environmental sample to explore the correlation between the microbe and the host. Traditional microbial research relies on laboratory culture. The recent development of 16S amplicon sequencing and other high-throughput sequencing methods has filled the gap in microbial research, especially for microorganisms that cannot be cultured in traditional laboratories, and expanded the utilization space of microbial resources. These sequencing methods are effective for studying microbial interaction. Alpha and beta diversity analyses are the two main components of 16S rDNA sequencing. Alpha diversity indicates the diversity within a particular environment or ecosystem and is primarily used to reflect species richness and evenness, as well as sequencing depth [38]. Beta diversity indicates the similarity or dissimilarity among different environmental communities [39]. In this study, 16S rDNA sequencing analysis revealed that the beta diversity of gut microbiota varied between the NCG and OG. Additionally, alpha diversity analysis revealed that the richness and diversity of gut microbiota were downregulated in the OG. The relative abundance of the genera Alloprevotella and Rikenellaceae_RC9_gut_group was upregulated, whereas that of Muribaculum was downregulated in the OG. The abundance of Alloprevotella is reported to be upregulated in multiple cancers. Wu et al. reported that Alloprevotella was associated with an increased risk of cardia cancer [40]. Wei et al. investigated the correlation between bacterial profiles and the symptoms of pancreatic adenocarcinoma (PDCA). The abundance of Alloprevotella was upregulated in patients with PDCA exhibiting bloating [41]. Wang et al. developed an ulcerative colitis (UC) carcinogenesis mouse model. The abundance of Alloprevotella was upregulated in the intestinal mucosa of the UC mouse model [42]. Moreover, the relative abundance of the genera Alloprevotella was upregulated in various cancers, including breast, thyroid, colorectal, and oral cancers [43–46]. Rikenellaceae_RC9_gut_group is also reported to be associated with the pathogenesis of some cancers. The relative abundance of Rikenellaceae was significantly upregulated in patients with prostate cancer belonging to the high-risk group [47]. Yang et al. reported that the abundance of Rikenellaceae_RC9_gut_group was significantly upregulated in proximal gastric cancer tissues and positively correlated with cancer-promoting metabolites [48]. Previous studies have reported that Rikenellaceae_RC9_gut_group is associated with inflammation [49]. Cancer development and therapy response are regulated by inflammation, which may facilitate tumor progression and treatment resistance [50]. Muribaculum, which is associated with improved response to immunotherapy, is a cancer-related bacterium [51]. Zhao et al. used a combination of probiotics and PD-1 inhibitors to treat melanoma. The authors reported that the beneficial bacteria Akkermansia, Prevotellaceae_NK3B31_group, and Muribaculum were enriched in the combination treatment group [52]. However, in this study, the relative abundance of Muribaculum in the OG was significantly lower than that in the NCG. These findings suggest that the increased abundance of Alloprevotella and Rikenellaceae_RC9_gut_group and the decreased abundance of Muribaculum are associated with OS pathogenesis.
Dysregulated metabolism is a hallmark of cancer [53]. To elucidate the regulatory effects of gut microbiota on OS pathogenesis, the metabolome was examined to determine the pathogenic mechanism of OS. Metabolomics is an emerging omics discipline that can identify and quantify most small molecules in living organisms [54]. As metabolites exhibit a wide range of functions in the cells and organisms and reflect the overall effect of the genome, proteome, and external stimuli, the metabolome can indicate the phenotype [55]. Metabolomics is now widely used in many fields, such as environmental science and food safety [56]. Based on research applications, metabolomics can be divided into non-targeted metabolomics and targeted metabolomics. Several analytical techniques are now used in non-targeted metabolomics, including nuclear magnetic resonance spectroscopy, GC-MS, and LC-MS [57–59]. In this study, GC-MS and LC-MS (dual mode) were used to comprehensively screen the differential metabolites. Fecal metabolomics revealed the differential metabolites between the NCG and OG. Next, KEGG enrichment analysis of the differential fecal metabolites between the two groups was performed. The metabolites of three bone metabolism-related metabolic pathways were annotated. Amino acid metabolism had an important role in OS pathogenesis, which is consistent with the findings of a previous study [60].
In addition to their role in protein synthesis, amino acids play an important role in energy production, nucleotide synthesis, and the maintenance of redox homeostasis [61, 62]. Early studies on cancer metabolism focused on glucose metabolism. Recent studies have demonstrated the importance of amino acids in cancer progression [63]. Amino acid-derived metabolites support cancer growth and metastasis. The catabolism of amino acids results in the production of metabolic intermediates that regulate tumor cell growth and survival [64]. Additionally, amino acids modulate reactive oxygen species homeostasis and are involved in epigenetic regulation through methylation and acetylation, which can enhance tumor aggressiveness [64]. Amino acids are reported to be involved in cancer metabolism. However, limited studies have examined the metabolomic changes in OS. Recently, the elucidation of the role of amino acids in primary bone sarcomas has become the focus of research. Phosphoglycerate dehydrogenase inhibition can lead to the upregulation of SLC7A5 (LAT1) and SLC3A2 (CD98) transporters that drive the transport of leucine into the lysosome, resulting in mTORC1 activation [65]. Previous studies have demonstrated that mTORC1 regulates OS cell proliferation partly by modulating serine/glycine metabolism [66]. In this study, the mTOR signaling pathway and amino acid metabolism were dysregulated in the OG. Therefore, these results suggest that amino acid metabolism may play a vital role in the carcinogenesis of OS. To further examine the crosstalk between gut microbiota and metabolites, correlation analysis was performed. For example, L-histidine was associated with Alloprevotella, Rikenellaceae_RC9_gut_group, and Muribaculum to varying degrees. A previous study reported that the serum contents of metabolites, especially histidine, markedly varied between the OS and healthy control groups [67]. Previously, we reported that histidine metabolism was upregulated in OS 3D cells and 3D cell-printed tissues [60]. Hence, histidine metabolism is a key pathway involved in OS progression.
This study has some limitations. The sample size in this study is relatively small. Studies must be performed with a large sample size to identify an ideal biomarker for OS. Additionally, this study examined the correlation between the gut microbiota of the OG and metabolites but did not establish a causal relationship.
Conclusions
This study demonstrated that gut microbiota and gut microbiota-related metabolites are correlated with OS. Thus, gut microbiota plays an important role in the pathogenesis of OS. These findings provided novel insights into the pathogenesis of OS and can enable the development of novel therapeutic strategies for OS.
Author Contributions
ZL, ZT, and YF designed the experiment. KZ and RZ maintained the animals. YL and LY performed the experiments. SY and YP collected the fecal samples. XW, CX, TY, and PL provided technical guidance. XQ and YL drafted the manuscript. ZL, YF, and ZT revised the manuscript. All authors contributed to the manuscript and approved its final version.
Acknowledgments
We thank Bullet Edits Limited for language editing and proofreading of the manuscript and Shanghai OE BioTech Co., Ltd for performing 16S rDNA sequencing and mass spectrometry.
Conflicts of Interest
The authors declare that they have no conflicts of interest.
Ethical Statement
Animal experiments were approved by the Ethical Committee of Experimental Animal Care of Shanxi Medical University (approval number DW2022017). All animal experiments were performed according to the National Institutes of Health Guidelines for the Care and Use of Experimental Animals. This study was performed according to the ARRIVE guidelines.
Funding
This work was supported by the National Natural Science Foundation of China (No. U21A20353, No. 82172503 and 82302769), the Natural Science Foundation of Shanxi Province (No. 20210302123263, 20210302124410, and 202204041101023), the special fund for Science and Technology Innovation Teams of Shanxi Province (No. 202304051001048), the Second Hospital of Shanxi Medical University, and four in-house research funding projects (No. 2020001-10 and SXEYRC202001).
References
- 1. Isakoff MS, Bielack SS, Meltzer P, Gorlick R. Osteosarcoma: Current Treatment and a Collaborative Pathway to Success. J Clin Oncol. 2015; 33:3029–35. https://doi.org/10.1200/JCO.2014.59.4895 [PubMed]
- 2. Ritter J, Bielack SS. Osteosarcoma. Ann Oncol. 2010; 21:vii320–5. https://doi.org/10.1093/annonc/mdq276 [PubMed]
- 3. Gill J, Ahluwalia MK, Geller D, Gorlick R. New targets and approaches in osteosarcoma. Pharmacol Ther. 2013; 137:89–99. https://doi.org/10.1016/j.pharmthera.2012.09.003 [PubMed]
- 4. Gaspar N, Occean BV, Pacquement H, Bompas E, Bouvier C, Brisse HJ, Castex MP, Cheurfa N, Corradini N, Delaye J, Entz-Werlé N, Gentet JC, Italiano A, et al, SFCE (Société Française des Cancers de l’Enfant et l’adolescent), GSF-GETO (Groupe Sarcome Français), and UNICANCER sarcoma group. Results of methotrexate-etoposide-ifosfamide based regimen (M-EI) in osteosarcoma patients included in the French OS2006/sarcome-09 study. Eur J Cancer. 2018; 88:57–66. https://doi.org/10.1016/j.ejca.2017.09.036 [PubMed]
- 5. Cho I, Blaser MJ. The human microbiome: at the interface of health and disease. Nat Rev Genet. 2012; 13:260–70. https://doi.org/10.1038/nrg3182 [PubMed]
- 6. Costello EK, Stagaman K, Dethlefsen L, Bohannan BJ, Relman DA. The application of ecological theory toward an understanding of the human microbiome. Science. 2012; 336:1255–62. https://doi.org/10.1126/science.1224203 [PubMed]
- 7. Marchesi JR, Adams DH, Fava F, Hermes GD, Hirschfield GM, Hold G, Quraishi MN, Kinross J, Smidt H, Tuohy KM, Thomas LV, Zoetendal EG, Hart A. The gut microbiota and host health: a new clinical frontier. Gut. 2016; 65:330–9. https://doi.org/10.1136/gutjnl-2015-309990 [PubMed]
- 8. Sharon G, Garg N, Debelius J, Knight R, Dorrestein PC, Mazmanian SK. Specialized metabolites from the microbiome in health and disease. Cell Metab. 2014; 20:719–30. https://doi.org/10.1016/j.cmet.2014.10.016 [PubMed]
- 9. Rooks MG, Garrett WS. Gut microbiota, metabolites and host immunity. Nat Rev Immunol. 2016; 16:341–52. https://doi.org/10.1038/nri.2016.42 [PubMed]
- 10. Tan HE, Sisti AC, Jin H, Vignovich M, Villavicencio M, Tsang KS, Goffer Y, Zuker CS. The gut-brain axis mediates sugar preference. Nature. 2020; 580:511–6. https://doi.org/10.1038/s41586-020-2199-7 [PubMed]
- 11. Yachida S, Mizutani S, Shiroma H, Shiba S, Nakajima T, Sakamoto T, Watanabe H, Masuda K, Nishimoto Y, Kubo M, Hosoda F, Rokutan H, Matsumoto M, et al. Metagenomic and metabolomic analyses reveal distinct stage-specific phenotypes of the gut microbiota in colorectal cancer. Nat Med. 2019; 25:968–76. https://doi.org/10.1038/s41591-019-0458-7 [PubMed]
- 12. Polk DB, Peek RM
Jr . Helicobacter pylori: gastric cancer and beyond. Nat Rev Cancer. 2010; 10:403–14. https://doi.org/10.1038/nrc2857 [PubMed] - 13. Luu TH, Michel C, Bard JM, Dravet F, Nazih H, Bobin-Dubigeon C. Intestinal Proportion of Blautia sp. is Associated with Clinical Stage and Histoprognostic Grade in Patients with Early-Stage Breast Cancer. Nutr Cancer. 2017; 69:267–75. https://doi.org/10.1080/01635581.2017.1263750 [PubMed]
- 14. Peuker K, Muff S, Wang J, Künzel S, Bosse E, Zeissig Y, Luzzi G, Basic M, Strigli A, Ulbricht A, Kaser A, Arlt A, Chavakis T, et al. Epithelial calcineurin controls microbiota-dependent intestinal tumor development. Nat Med. 2016; 22:506–15. https://doi.org/10.1038/nm.4072 [PubMed]
- 15. Singh N, Gurav A, Sivaprakasam S, Brady E, Padia R, Shi H, Thangaraju M, Prasad PD, Manicassamy S, Munn DH, Lee JR, Offermanns S, Ganapathy V. Activation of Gpr109a, receptor for niacin and the commensal metabolite butyrate, suppresses colonic inflammation and carcinogenesis. Immunity. 2014; 40:128–39. https://doi.org/10.1016/j.immuni.2013.12.007 [PubMed]
- 16. Cameron EA, Sperandio V. Frenemies: Signaling and Nutritional Integration in Pathogen-Microbiota-Host Interactions. Cell Host Microbe. 2015; 18:275–84. https://doi.org/10.1016/j.chom.2015.08.007 [PubMed]
- 17. Ursell LK, Haiser HJ, Van Treuren W, Garg N, Reddivari L, Vanamala J, Dorrestein PC, Turnbaugh PJ, Knight R. The intestinal metabolome: an intersection between microbiota and host. Gastroenterology. 2014; 146:1470–6. https://doi.org/10.1053/j.gastro.2014.03.001 [PubMed]
- 18. Zhai B, Ola M, Rolling T, Tosini NL, Joshowitz S, Littmann ER, Amoretti LA, Fontana E, Wright RJ, Miranda E, Veelken CA, Morjaria SM, Peled JU, et al. High-resolution mycobiota analysis reveals dynamic intestinal translocation preceding invasive candidiasis. Nat Med. 2020; 26:59–64. https://doi.org/10.1038/s41591-019-0709-7 [PubMed]
- 19. Prentice KJ, Luu L, Allister EM, Liu Y, Jun LS, Sloop KW, Hardy AB, Wei L, Jia W, Fantus IG, Sweet DH, Sweeney G, Retnakaran R, et al. The furan fatty acid metabolite CMPF is elevated in diabetes and induces β cell dysfunction. Cell Metab. 2014; 19:653–66. https://doi.org/10.1016/j.cmet.2014.03.008 [PubMed]
- 20. Caporaso JG, Kuczynski J, Stombaugh J, Bittinger K, Bushman FD, Costello EK, Fierer N, Peña AG, Goodrich JK, Gordon JI, Huttley GA, Kelley ST, Knights D, et al. QIIME allows analysis of high-throughput community sequencing data. Nat Methods. 2010; 7:335–6. https://doi.org/10.1038/nmeth.f.303 [PubMed]
- 21. Rognes T, Flouri T, Nichols B, Quince C, Mahé F. VSEARCH: a versatile open source tool for metagenomics. PeerJ. 2016; 4:e2584. https://doi.org/10.7717/peerj.2584 [PubMed]
- 22. Wang Q, Garrity GM, Tiedje JM, Cole JR. Naive Bayesian classifier for rapid assignment of rRNA sequences into the new bacterial taxonomy. Appl Environ Microbiol. 2007; 73:5261–7. https://doi.org/10.1128/AEM.00062-07 [PubMed]
- 23. Liu Z, Liu F, Li G, Chi X, Wang Y, Wang H, Ma L, Han K, Zhao G, Guo X, Xu B. Metabolite Support of Long-Term Storage of Sperm in the Spermatheca of Honeybee (Apis mellifera) Queens. Front Physiol. 2020; 11:574856. https://doi.org/10.3389/fphys.2020.574856 [PubMed]
- 24. Xiong QQ, Shen TH, Zhong L, Zhu CL, Peng XS, He XP, Fu JR, Ouyang LJ, Bian JM, Hu LF, Sun XT, Xu J, Zhou HY, et al. Comprehensive metabolomic, proteomic and physiological analyses of grain yield reduction in rice under abrupt drought-flood alternation stress. Physiol Plant. 2019; 167:564–84. https://doi.org/10.1111/ppl.12901 [PubMed]
- 25. Fan Y, Pedersen O. Gut microbiota in human metabolic health and disease. Nat Rev Microbiol. 2021; 19:55–71. https://doi.org/10.1038/s41579-020-0433-9 [PubMed]
- 26. D'Amelio P, Sassi F. Gut Microbiota, Immune System, and Bone. Calcif Tissue Int. 2018; 102:415–25. https://doi.org/10.1007/s00223-017-0331-y [PubMed]
- 27. Chen Y, Wang X, Zhang C, Liu Z, Li C, Ren Z. Gut Microbiota and Bone Diseases: A Growing Partnership. Front Microbiol. 2022; 13:877776. https://doi.org/10.3389/fmicb.2022.877776 [PubMed]
- 28. Xu X, Feng X, He M, Zhang Z, Wang J, Zhu H, Li T, Wang F, Sun M, Wang Z. The effect of acupuncture on tumor growth and gut microbiota in mice inoculated with osteosarcoma cells. Chin Med. 2020; 15:33. https://doi.org/10.1186/s13020-020-00315-z [PubMed]
- 29. Liang J, Zhang M, Wang X, Ren Y, Yue T, Wang Z, Gao Z. Edible fungal polysaccharides, the gut microbiota, and host health. Carbohydr Polym. 2021; 273:118558. https://doi.org/10.1016/j.carbpol.2021.118558 [PubMed]
- 30. Sędzikowska A, Szablewski L. Human Gut Microbiota in Health and Selected Cancers. Int J Mol Sci. 2021; 22:13440. https://doi.org/10.3390/ijms222413440 [PubMed]
- 31. Kleber KT, Iranpur KR, Perry LM, Cruz SM, Razmara AM, Culp WT, Kent MS, Eisen JA, Rebhun RB, Canter RJ. Using the canine microbiome to bridge translation of cancer immunotherapy from pre-clinical murine models to human clinical trials. Front Immunol. 2022; 13:983344. https://doi.org/10.3389/fimmu.2022.983344 [PubMed]
- 32. Le D, Chambers MM, Mercado K, Gutowski CJ. Characterization of the gut microbiome in an osteosarcoma mouse model. J Orthop Res. 2023; 41:2730–9. https://doi.org/10.1002/jor.25635 [PubMed]
- 33. Tzeng A, Sangwan N, Jia M, Liu CC, Keslar KS, Downs-Kelly E, Fairchild RL, Al-Hilli Z, Grobmyer SR, Eng C. Human breast microbiome correlates with prognostic features and immunological signatures in breast cancer. Genome Med. 2021; 13:60. https://doi.org/10.1186/s13073-021-00874-2 [PubMed]
- 34. Nejman D, Livyatan I, Fuks G, Gavert N, Zwang Y, Geller LT, Rotter-Maskowitz A, Weiser R, Mallel G, Gigi E, Meltser A, Douglas GM, Kamer I, et al. The human tumor microbiome is composed of tumor type-specific intracellular bacteria. Science. 2020; 368:973–80. https://doi.org/10.1126/science.aay9189 [PubMed]
- 35. Perry LM, Cruz SM, Kleber KT, Judge SJ, Darrow MA, Jones LB, Basmaci UN, Joshi N, Settles ML, Durbin-Johnson BP, Gingrich AA, Monjazeb AM, Carr-Ascher J, et al. Human soft tissue sarcomas harbor an intratumoral viral microbiome which is linked with natural killer cell infiltrate and prognosis. J Immunother Cancer. 2023; 11:e004285. https://doi.org/10.1136/jitc-2021-004285 [PubMed]
- 36. Ribitsch I, Baptista PM, Lange-Consiglio A, Melotti L, Patruno M, Jenner F, Schnabl-Feichter E, Dutton LC, Connolly DJ, van Steenbeek FG, Dudhia J, Penning LC. Large Animal Models in Regenerative Medicine and Tissue Engineering: To Do or Not to Do. Front Bioeng Biotechnol. 2020; 8:972. https://doi.org/10.3389/fbioe.2020.00972 [PubMed]
- 37. Szadvari I, Krizanova O, Babula P. Athymic nude mice as an experimental model for cancer treatment. Physiol Res. 2016 (Suppl 4); 65:S441–53. https://doi.org/10.33549/physiolres.933526 [PubMed]
- 38. Hagerty SL, Hutchison KE, Lowry CA, Bryan AD. An empirically derived method for measuring human gut microbiome alpha diversity: Demonstrated utility in predicting health-related outcomes among a human clinical sample. PLoS One. 2020; 15:e0229204. https://doi.org/10.1371/journal.pone.0229204 [PubMed]
- 39. Su X. Elucidating the Beta-Diversity of the Microbiome: from Global Alignment to Local Alignment. mSystems. 2021; 6:e0036321. https://doi.org/10.1128/mSystems.00363-21 [PubMed]
- 40. Wu J, Xu S, Xiang C, Cao Q, Li Q, Huang J, Shi L, Zhang J, Zhan Z. Tongue Coating Microbiota Community and Risk Effect on Gastric Cancer. J Cancer. 2018; 9:4039–48. https://doi.org/10.7150/jca.25280 [PubMed]
- 41. Wei AL, Li M, Li GQ, Wang X, Hu WM, Li ZL, Yuan J, Liu HY, Zhou LL, Li K, Li A, Fu MR. Oral microbiome and pancreatic cancer. World J Gastroenterol. 2020; 26:7679–92. https://doi.org/10.3748/wjg.v26.i48.7679 [PubMed]
- 42. Wang C, Li W, Wang H, Ma Y, Zhao X, Zhang X, Yang H, Qian J, Li J. Saccharomyces boulardii alleviates ulcerative colitis carcinogenesis in mice by reducing TNF-α and IL-6 levels and functions and by rebalancing intestinal microbiota. BMC Microbiol. 2019; 19:246. https://doi.org/10.1186/s12866-019-1610-8 [PubMed]
- 43. Zhang L, Liu Y, Zheng HJ, Zhang CP. The Oral Microbiota May Have Influence on Oral Cancer. Front Cell Infect Microbiol. 2020; 9:476. https://doi.org/10.3389/fcimb.2019.00476 [PubMed]
- 44. Jiao J, Zheng Y, Zhang Q, Xia D, Zhang L, Ma N. Saliva microbiome changes in thyroid cancer and thyroid nodules patients. Front Cell Infect Microbiol. 2022; 12:989188. https://doi.org/10.3389/fcimb.2022.989188 [PubMed]
- 45. Liu E, Zhang F, Xu T, Ye L, Ma SS, Ji ZS. Relationship between tumor microbiota transcriptional activity and gene expression in breast cancer. BMC Cancer. 2023; 23:252. https://doi.org/10.1186/s12885-023-10726-4 [PubMed]
- 46. Li Y, Cao H, Fei B, Gao Q, Yi W, Han W, Bao C, Xu J, Zhao W, Zhang F. Gut Microbiota Signatures in Tumor, Para-Cancerous, Normal Mucosa, and Feces in Colorectal Cancer Patients. Front Cell Dev Biol. 2022; 10:916961. https://doi.org/10.3389/fcell.2022.916961 [PubMed]
- 47. Matsushita M, Fujita K, Motooka D, Hatano K, Fukae S, Kawamura N, Tomiyama E, Hayashi Y, Banno E, Takao T, Takada S, Yachida S, Uemura H, et al. The gut microbiota associated with high-Gleason prostate cancer. Cancer Sci. 2021; 112:3125–35. https://doi.org/10.1111/cas.14998 [PubMed]
- 48. Yang Y, Dai D, Jin W, Huang Y, Zhang Y, Chen Y, Wang W, Lin W, Chen X, Zhang J, Wang H, Zhang H, Teng L. Microbiota and metabolites alterations in proximal and distal gastric cancer patients. J Transl Med. 2022; 20:439. https://doi.org/10.1186/s12967-022-03650-x [PubMed]
- 49. Cai B, Pan J, Chen H, Chen X, Ye Z, Yuan H, Sun H, Wan P. Oyster polysaccharides ameliorate intestinal mucositis and improve metabolism in 5-fluorouracil-treated S180 tumour-bearing mice. Carbohydr Polym. 2021; 256:117545. https://doi.org/10.1016/j.carbpol.2020.117545 [PubMed]
- 50. Zhao H, Wu L, Yan G, Chen Y, Zhou M, Wu Y, Li Y. Inflammation and tumor progression: signaling pathways and targeted intervention. Signal Transduct Target Ther. 2021; 6:263. https://doi.org/10.1038/s41392-021-00658-5 [PubMed]
- 51. Uribe-Herranz M, Bittinger K, Rafail S, Guedan S, Pierini S, Tanes C, Ganetsky A, Morgan MA, Gill S, Tanyi JL, Bushman FD, June CH, Facciabene A. Gut microbiota modulates adoptive cell therapy via CD8α dendritic cells and IL-12. JCI Insight. 2018; 3:e94952. https://doi.org/10.1172/jci.insight.94952 [PubMed]
- 52. Zhao J, Wang Y, Wang J, Lv M, Zhou C, Jia L, Geng W. Lactobacillus kefiranofaciens ZW18 from Kefir enhances the anti-tumor effect of anti-programmed cell death 1 (PD-1) immunotherapy by modulating the gut microbiota. Food Funct. 2022; 13:10023–33. https://doi.org/10.1039/d2fo01747d [PubMed]
- 53. Hanahan D, Weinberg RA. Hallmarks of cancer: the next generation. Cell. 2011; 144:646–74. https://doi.org/10.1016/j.cell.2011.02.013 [PubMed]
- 54. Zhong Z, Mao S, Lin H, Li H, Lin J, Lin JM. Alteration of intracellular metabolome in osteosarcoma stem cells revealed by liquid chromatography-tandem mass spectrometry. Talanta. 2019; 204:6–12. https://doi.org/10.1016/j.talanta.2019.05.088 [PubMed]
- 55. Guijas C, Montenegro-Burke JR, Warth B, Spilker ME, Siuzdak G. Metabolomics activity screening for identifying metabolites that modulate phenotype. Nat Biotechnol. 2018; 36:316–20. https://doi.org/10.1038/nbt.4101 [PubMed]
- 56. Wishart DS. Emerging applications of metabolomics in drug discovery and precision medicine. Nat Rev Drug Discov. 2016; 15:473–84. https://doi.org/10.1038/nrd.2016.32 [PubMed]
- 57. Probert F, Walsh A, Jagielowicz M, Yeo T, Claridge TD, Simmons A, Travis S, Anthony DC. Plasma Nuclear Magnetic Resonance Metabolomics Discriminates Between High and Low Endoscopic Activity and Predicts Progression in a Prospective Cohort of Patients With Ulcerative Colitis. J Crohns Colitis. 2018; 12:1326–37. https://doi.org/10.1093/ecco-jcc/jjy101 [PubMed]
- 58. Ibáñez C, Simó C, Palazoglu M, Cifuentes A. GC-MS based metabolomics of colon cancer cells using different extraction solvents. Anal Chim Acta. 2017; 986:48–56. https://doi.org/10.1016/j.aca.2017.07.019 [PubMed]
- 59. Wang Y, Caldwell R, Cowan DA, Legido-Quigley C. LC-MS-Based Metabolomics Discovers Purine Endogenous Associations with Low-Dose Salbutamol in Urine Collected for Antidoping Tests. Anal Chem. 2016; 88:2243–9. https://doi.org/10.1021/acs.analchem.5b03927 [PubMed]
- 60. Yang S, Tian Z, Feng Y, Zhang K, Pan Y, Li Y, Wang Z, Wei W, Qiao X, Zhou R, Yan L, Li Q, Guo H, et al. Transcriptomics and metabolomics reveal changes in the regulatory mechanisms of osteosarcoma under different culture methods in vitro. BMC Med Genomics. 2022; 15:265. https://doi.org/10.1186/s12920-022-01419-1 [PubMed]
- 61. Choi BH, Coloff JL. The Diverse Functions of Non-Essential Amino Acids in Cancer. Cancers (Basel). 2019; 11:675. https://doi.org/10.3390/cancers11050675 [PubMed]
- 62. Vettore L, Westbrook RL, Tennant DA. New aspects of amino acid metabolism in cancer. Br J Cancer. 2020; 122:150–6. https://doi.org/10.1038/s41416-019-0620-5 [PubMed]
- 63. Jiménez JA, Lawlor ER, Lyssiotis CA. Amino acid metabolism in primary bone sarcomas. Front Oncol. 2022; 12:1001318. https://doi.org/10.3389/fonc.2022.1001318 [PubMed]
- 64. Lieu EL, Nguyen T, Rhyne S, Kim J. Amino acids in cancer. Exp Mol Med. 2020; 52:15–30. https://doi.org/10.1038/s12276-020-0375-3 [PubMed]
- 65. Rathore R, Caldwell KE, Schutt C, Brashears CB, Prudner BC, Ehrhardt WR, Leung CH, Lin H, Daw NC, Beird HC, Giles A, Wang WL, Lazar AJ, et al. Metabolic compensation activates pro-survival mTORC1 signaling upon 3-phosphoglycerate dehydrogenase inhibition in osteosarcoma. Cell Rep. 2021; 34:108678. https://doi.org/10.1016/j.celrep.2020.108678 [PubMed]
- 66. Wang DW, Wu L, Cao Y, Yang L, Liu W, E XQ, Ji G, Bi ZG. A novel mechanism of mTORC1-mediated serine/glycine metabolism in osteosarcoma development. Cell Signal. 2017; 29:107–14. https://doi.org/10.1016/j.cellsig.2016.06.008 [PubMed]
- 67. Quintero Escobar M, Costa TB, Martins LG, Costa SS, vanHelvoort Lengert A, Boldrini É, Morini da Silva
SR , Lopes LF, Vidal DO, Krepischi AC, Maschietto M, Tasic L. Insights in Osteosarcoma by Proton Nuclear Magnetic Resonance Serum Metabonomics. Front Oncol. 2020; 10:506959. https://doi.org/10.3389/fonc.2020.506959 [PubMed]