Submit an Article
Navigate
Home
Editorial Board
Editorial Policies
Current Volume
Archive
Scientific Integrity
Publication Ethics Statements
Interviews with Outstanding Authors
Newsroom
Sponsored Conferences
Podcast
Contact
Special Collections
Submit an Article
Online ISSN: 1945-4589
Research Paper
|
Volume 16, Issue 13
|
pp. 10841–10859
Characterization of the gut microbiota and fecal metabolome in the osteosarcoma mouse model
Back to article
Figure 1
(1 of 6)
−
100%
+
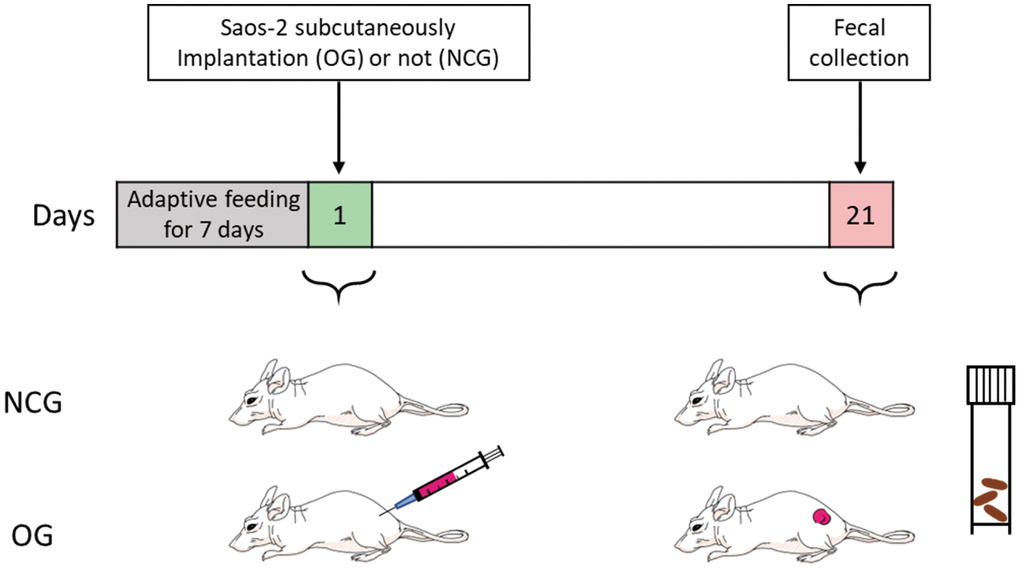
Figure 1.
Construction of the osteosarcoma mouse model with Saos-2 OS cells.
NCG represents the control group, OG represents the osteosarcoma group. n = 7.