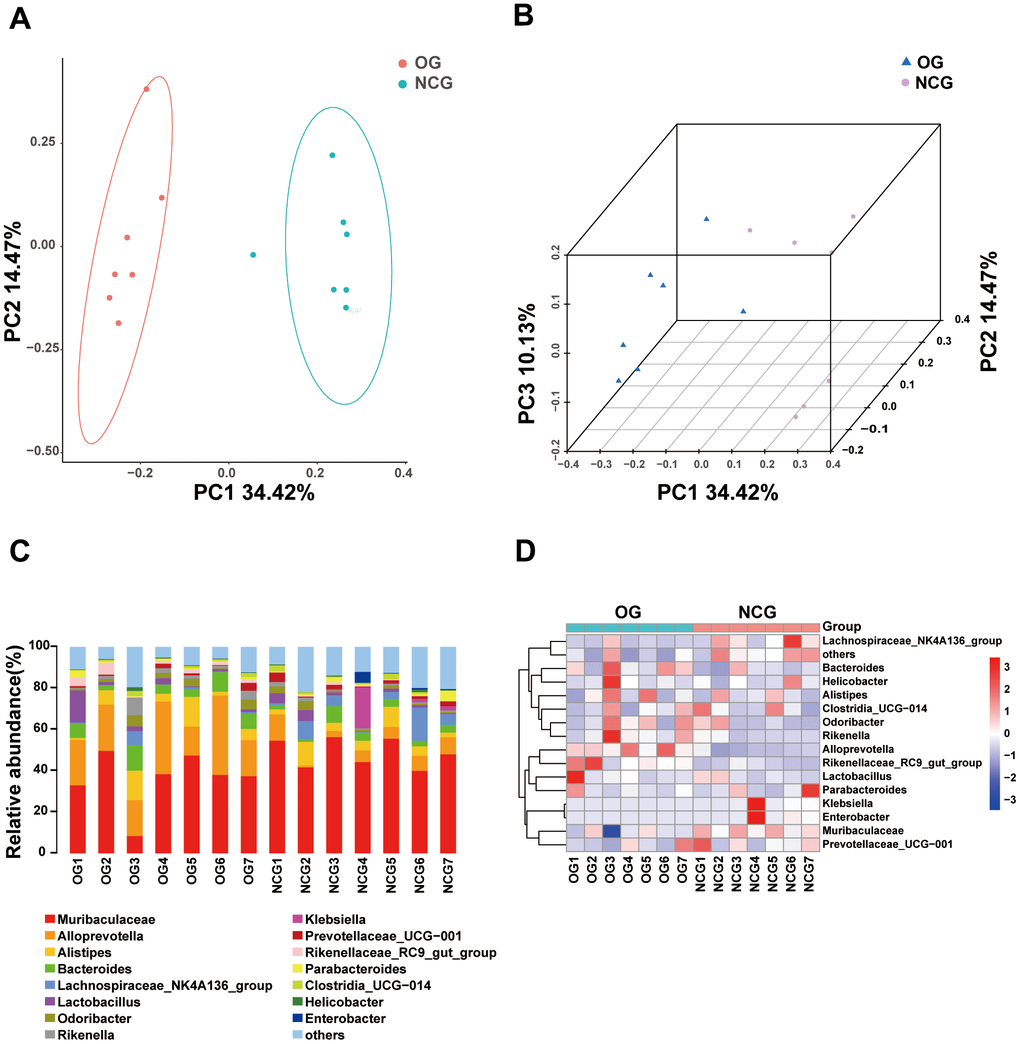
Figure 3.(A) Two-dimensional principal coordinate analysis (PCA) model of gut microbiota. NCG: green, OG: orange. (B) Two-dimensional PCA of gut microbiota. NCG: purple, OS: blue. (C) Stacked bar chart of the abundance of microbes at the genus level. (D) Heatmap of the abundance of microbes at the genus level. n = 7.