


Introduction
Lung cancer has the second highest incidence and the highest mortality in the world (https://www.iarc.fr/faq/latest-global-cancer-data-2020-qa/) [1]. Non-small-cell lung cancer (NSCLC) accounts for about 80% of all lung cancer. Chemotherapy is the primary treatment of lung cancer [2] and great progress has been made in chemotherapy treatment, but the prognosis is still poor [1]. Therefore, it is imperative that searching for effective targets for the diagnostic of NSCLC.
Resveratrol is a natural polyphenolic phytoalexin that is extracted from grapes, mulberries, and peanuts [3]. As an activator of sirtuin 1 (SIRT1), resveratrol has been reported to affect many physiological processes including senescence, and many diseases including metabolic syndrome, hypertension, Alzheimer’s disease, cardiovascular diseases, and inflammatory disease [4, 5]. The potential of resveratrol on cancer treatment has been reported and a large number of studies have confirmed that resveratrol has a good inhibitory effect on various tumors including NSCLC [6]. Wang et al. found that resveratrol might inhibit proliferation but induce apoptosis and autophagy via inhibiting Akt/mTOR pathway and activating p38-MAPK pathway in A549 and H1299 NSCLC cells [7]. Resveratrol also inhibits proliferation, migration, invasion and promotes apoptosis via inhibiting the messenger RNA (mRNA) and protein expression of signal transducer and activator of transcription 3 (STAT3) in A549 cells [8]. Resveratrol has been studied in phase I clinical trials, but most phase I studies have not been successful because of side effects and other unknown reasons [8–11]. Reports about new targets of resveratrol in NSCLC are still few and further investigations are urgently needed.
Cluster of differentiation (CD), also known as leukocyte differentiation antigen, which are often used as cellular markers for immune antigen recognition. CD molecules are used to distinguish between different lineages, different stages of differentiation and different levels of activation. In addition, mounting evidences have shown alterations in the expression level of CD molecules in many cancers. The above four CD antigens were all downregulated in NSCLC, but some other CDs have opposite effect in tumors. Wang et al. have found that mRNA and protein expression level of CD44v6 are significantly increased in malignant ovarian tumor tissues, compared with normal ovarian tissues. Meanwhile, experiments in ovarian cancer cell lines have proved that CD44v6 positively regulates cell migration, invasion and clone formation by activating nuclear factor kappa-B (NF-κB) pathway [12]. Another data from a meta-analysis reveals that high expression of CD44 indicates poorer survival and higher potential of metastasis in osteosarcoma patients [13]. It suggests one or several specific CDs may be as diagnostic markers for certain cancers and strategies of target CDs would be a viable way for cancer treatment.
The traditional single studies are limited by the finite number of samples and cannot systematically analyze the key genes and their molecular functions in complex biological processes. Whereas bioinformatics analysis based on high throughput platforms, is a powerful tool to identify meaningful genes as biomarker in cancer for diagnosis or prognosis. One previous study found that resveratrol inhibited NSCLC H1299 cell proliferation and induced cell senescence by leading to mitochondrial dysfunction and increasing of reactive oxygen species (ROS) [14]. Another study reported the effect of resveratrol on spontaneous tumors in individuals. Data in the annual fish Nothobranchius guentheri suggested that resveratrol inhibited age-dependent spontaneous tumorigenesis by increasing the expression of SIRT1 and activating its downstream targets [15]. Microarray (GSE9008) has been performed to evaluate the effect of resveratrol on A549 cells [16]. In this study, we performed a deeply bioinformatics analysis to predict the candidate genes effected by resveratrol treatment in NSCLC. By compared GSE9008 and GSE29250 datasets, 271 DEGs were selected. Functional enrichment analyses and protein-protein interaction (PPI) network of potential genes were performed and 10 hub genes were chosen. Finally, we identified ANPEP, ITGAL, CD69, and PTPRC as candidate genes associated with treatment of resveratrol in NSCLC via expression and survival analysis of hub genes.
Materials and Methods
Data preparation
Expression data of mRNA for Non-small Cell Lung Cancer (NSCLC) patients was downloaded from NCBI-GEO (GSE29250). Dataset GSE29250 was based on GPL8179 and GPL10558 Platforms [Illumina Human v2 MicroRNA expression beadchip and Illumina HumanHT-12 V4.0 expression beadchip]. Expression data of human A549 mRNA was downloaded from NCBI-GEO (GSE9008), A549 cells were treated with 25 μM resveratrol for 48 hours and gene expression profiles were compiled using an oligonucleotide microarray to determine altered expression levels. It was based on GPL570 Platforms ([HG-U133_Plus_2] Affymetrix Human Genome U133 Plus 2.0 Array). The two datasets were analyzed with GRO2R. The t-test was applied to filter the DEGs, which were selected according to the original P-values <0.05 and fold change >1, and then DEGs in two datasets were merged and selected as potential targets for the further analysis.
Data analysis
To assess functional enrichment, Gene ontology (GO) biological processes, cellular component and molecular function of DEGs were performed using Database for Annotation, Visualization, and Integration Discovery (DAVID) (https://david.ncifcrf.gov/home.jsp) [17]. The STRING (version 11.0) online database (https://string-db.org) was used to construct the protein-protein interaction (PPI) network [18]. Then the PPI network was visualized with Cytoscape software (version 3.6.0), and cytoHubba, a plugin of Cytoscape was used to calculate the key targets (hub genes) from the network [19]. There are 11 topological analysis methods in cytoHubba, and we chose Maximal Clique Centrality (MCC), which is based on the discovery of featured nodes and edges, and performs better than the others method in yeast PPI network [19]. To increase the sensitivity and specificity the intuition behind MCC is that essential proteins tend to be clustered in a yeast protein-protein interaction network [19]. Given a node v, the MCC of v is defined as
To confirm the expression of hub genes in clinical samples, we screened the expression of the 10 hub genes in the online platform, Gene Expression Profiling Interactive Analysis (GEPIA), which was a web server for analyzing the RNA sequencing expression data of 9,736 tumors and 8,587 normal samples from the TCGA and the GTEx projects, using a standard processing pipeline. A P-value <0.01 and a fold change >1 were considered as the threshold with expression between tumor and normal samples.
Furthermore, we did sample Meta analysis of hub genes with Oncomine™ (https://www.oncomine.org/resource/login.html). Six datasets of lung adenocarcinoma (LUAD) and four datasets of squamous cell lung carcinoma (LUSC) were selected to perform the Meta analysis. A P-value <1e-4 and a fold change >2 were considered as the threshold with gene ranking in the top 10%. Oncomine™ datasets are composed of samples represented as microarray data measuring either mRNA expression or DNA copy number on primary tumors, cell lines, or xenografts, usually from published research.
Moreover, survival curves of hub genes survival between high-expression and low-expression patients were validated in Kaplan Meier plotter (http://kmplot.com/analysis/). The Kaplan Meier plotter was a meta-analysis based tool to discover and validate of survival biomarkers. It was capable to assess the effect of 54k genes on survival in 21 cancer types. The largest datasets included breast (n = 6,234), and lung (n = 3,452) cancer [20].
Gene Set Cancer Analysis (GSCA) database was a web-based analysis platform for gene set cancer analysis (http://bioinfo.life.hust.edu.cn/web/GSCALite/). The platform integrated cancer genomics data of 33 cancer types from TCGA as well as normal tissue data from GTEx. The hub genes validated by Oncomine™ and Kaplan Meier plotter were further analyzed by GSCA for genetic alterations and methylation [21].
Results
Data mining
To investigate the effect of resveratrol on the expression of DEGs in NSCLC, we analyzed the dataset GSE29250 and dataset GSE9008 from NCBI-GEO. GSE29250 was an integrated analysis of miRNA and mRNA expressions of NSCLC by compared 12 NSCLC samples and their adjacent normal tissues. It contained 2401 DEGs (P < 0.05 and fold change >1), 1134 genes were up-regulated, while 1267 genes were down-regulated (Figure 1A). Data of GSE9008 were from one group of control NSCLC cell line-A549 and three groups of resveratrol treated A549. This dataset contained 2069 DEGs (P < 0.05 and fold change >1), 1436 genes were up-regulated, while 633 genes were down-regulated after (Figure 1B). Compared with the two groups of DEGs, 271 DEGs were selected for the further analysis. Of the 271 DEGs, 135 genes were down-regulated in NSCLC compared with adjacent tissue, and resveratrol treatment up-regulated these genes expression in A549 cells. Thirty-three genes were up-regulated in NSCLC compared with adjacent tissue, and resveratrol treatment reversed these genes expression (Figure 1C and 1D). All these 168 genes might be candidate genes of resveratrol which was beneficial for the treatment of NSCLC cancer. Meanwhile, 47 genes were found down-regulated in NSCLC, while decreased by resveratrol, too (Figure 1E). 56 genes were increased in NSCLC and the expressions were even higher after treatment with resveratrol (Figure 1F). These changes in gene expression may have the opposite effect or side effects in the treatment with resveratrol. Taken together, 271 DEGs were selected for the effect of resveratrol on NSCLC.
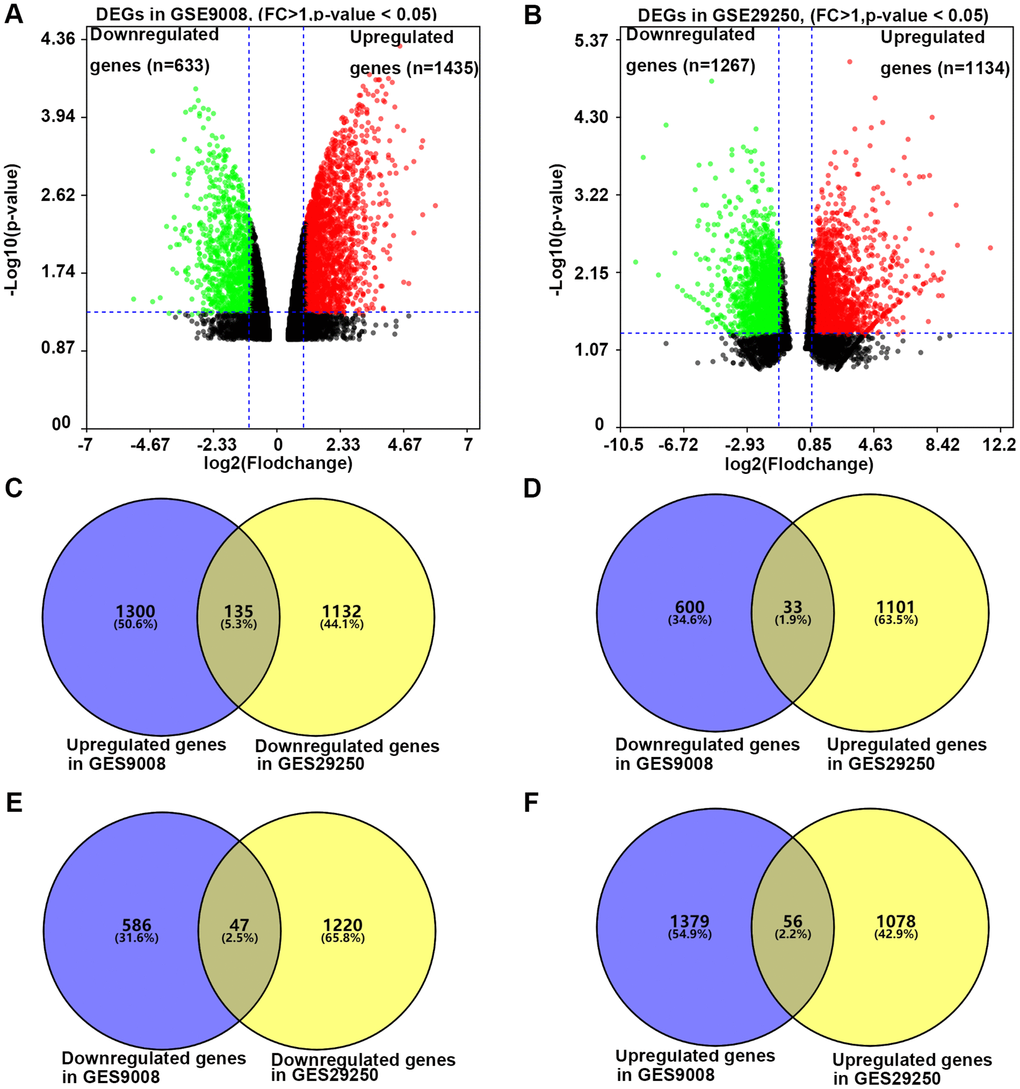
Figure 1. The process of screening candidate genes. (A) The DEGs in A549 cells treated with or without 25 microM resveratrol for 48 hours. Fold change >1 and p-value <0.05 was considered to be significant. (B) The DEGs in NSCLC tissue and adjacent normal tissue. Fold change >1 and p-value <0.05 was considered to be significant (C) Genes down-regulated in NSCLC and unregulated by resveratrol in A549 (n = 135). (D) Genes unregulated in NSCLC and down-regulated by resveratrol in A549 (n = 33). (E) Genes down-regulated in both NSCLC and resveratrol treated A549 (n = 47). (F) Genes upregulated in both NSCLC and resveratrol treated A549 (n = 56).
Gene ontology analysis
To understand the function of the 271 DEGs, DAVID database was used to perform gene ontology analysis. As shown in Table 1, biological processes of DEGs were significantly enriched in the regulation of “signal transduction”, “positive regulation of transcription from RNA polymerase II promoter”, “cell adhesion”, “inflammatory response”, “negative regulation of cell proliferation”, and “cell surface receptor signaling pathway”. As to cellular component, the DEGs were significantly enriched in “cytoplasm”, “plasma membrane”, “extracellular exosome”, “integral component of plasma membrane”, “extracellular space”, and “cell surface”. About molecular function, the DEGs were significantly enriched in “calcium ion binding”, “protein homodimerization activity”, and “receptor activity”.
Table 1. Functional enrichment analysis of DEGs.
| Term | Description | Count | P-Value | ||||||||||||||||||||||||||||||||||||||||||||||||||||||||||||||||||||||||||||||||||||||||||||||||
| BP | GO:0007165 | Signal transduction | 37 | 4.04E-06 | |||||||||||||||||||||||||||||||||||||||||||||||||||||||||||||||||||||||||||||||||||||||||||||||
| GO:0045944 | Positive regulation of transcription from RNA polymerase II promoter | 23 | 0.0173101 | ||||||||||||||||||||||||||||||||||||||||||||||||||||||||||||||||||||||||||||||||||||||||||||||||
| GO:0007155 | Cell adhesion | 18 | 2.25E-04 | ||||||||||||||||||||||||||||||||||||||||||||||||||||||||||||||||||||||||||||||||||||||||||||||||
| GO:0006954 | Inflammatory response | 12 | 0.01637743 | ||||||||||||||||||||||||||||||||||||||||||||||||||||||||||||||||||||||||||||||||||||||||||||||||
| GO:0008285 | Negative regulation of cell proliferation | 11 | 0.0489155 | ||||||||||||||||||||||||||||||||||||||||||||||||||||||||||||||||||||||||||||||||||||||||||||||||
| GO:0007166 | Cell surface receptor signaling pathway | 10 | 0.01416262 | ||||||||||||||||||||||||||||||||||||||||||||||||||||||||||||||||||||||||||||||||||||||||||||||||
| CC | GO:0005737 | Cytoplasm | 83 | 0.03877089 | |||||||||||||||||||||||||||||||||||||||||||||||||||||||||||||||||||||||||||||||||||||||||||||||
| GO:0005886 | Plasma membrane | 81 | 9.98E-05 | ||||||||||||||||||||||||||||||||||||||||||||||||||||||||||||||||||||||||||||||||||||||||||||||||
| GO:0070062 | Extracellular exosome | 58 | 5.01E-04 | ||||||||||||||||||||||||||||||||||||||||||||||||||||||||||||||||||||||||||||||||||||||||||||||||
| GO:0005887 | Integral component of plasma membrane | 39 | 2.19E-05 | ||||||||||||||||||||||||||||||||||||||||||||||||||||||||||||||||||||||||||||||||||||||||||||||||
| GO:0005615 | Extracellular space | 27 | 0.03352491 | ||||||||||||||||||||||||||||||||||||||||||||||||||||||||||||||||||||||||||||||||||||||||||||||||
| GO:0009986 | Cell surface | 20 | 1.14E-04 | ||||||||||||||||||||||||||||||||||||||||||||||||||||||||||||||||||||||||||||||||||||||||||||||||
| MF | GO:0005509 | Calcium ion binding | 21 | 0.00217256 | |||||||||||||||||||||||||||||||||||||||||||||||||||||||||||||||||||||||||||||||||||||||||||||||
| GO:0042803 | Protein homodimerization activity | 17 | 0.04504788 | ||||||||||||||||||||||||||||||||||||||||||||||||||||||||||||||||||||||||||||||||||||||||||||||||
| GO:0004872 | Receptor activity | 10 | 0.00315823 | ||||||||||||||||||||||||||||||||||||||||||||||||||||||||||||||||||||||||||||||||||||||||||||||||
| Abbreviations: BP: Biology Pathway; CC: Cellular Component; MF: Molecular Function. | |||||||||||||||||||||||||||||||||||||||||||||||||||||||||||||||||||||||||||||||||||||||||||||||||||
PPI network construction and identification of hub genes
To understand the interaction of DEGs at protein level, the 271 DEGs were analyzed in STRING, 255 nodes and 342 edges were shown in the PPI network (PPI enrichment P-value <1.0e-16). Cytoscape was used to visualize and analyze the PPI network. After removing the disconnected nodes, 177 nodes and 342 edges were shown in Figure 2. CytoHubba, a plugin of Cytoscape was used to calculate the hub genes from the network. ANPEP, CD69, ITGAL, PECAM1, PTPRC, CD34, ITGA1, CCL2, SOX2, and EGFR were identified as the hub genes of the network according to the high scores (Figure 3). Hub gene ranks were shown in Supplementary Table 1. In these genes, the mRNA levels of ANPEP, CD69, ITGAL, PTPRC, CD34, ITGA1, and CCL2 were reduced in NSCLC and up-regulated by resveratrol treatment. PECAM1 was also down-regulated in NSCLC and the expression was even lower by resveratrol treatment. Both EGFR and SOX2 were up-regulated in NSCLC; resveratrol treatment promoted EGFR and inhibited SOX2. In this condition, we predicted that the regulation of resveratrol on ANPEP, CD69, ITGAL, PTPRC, CD34, ITGA1, CCL2, and SOX2 expression were beneficial to the treatment of NSCLC. However, it was worth paying attention to the effect of resveratrol treatment on PECAM1 and EGFR.
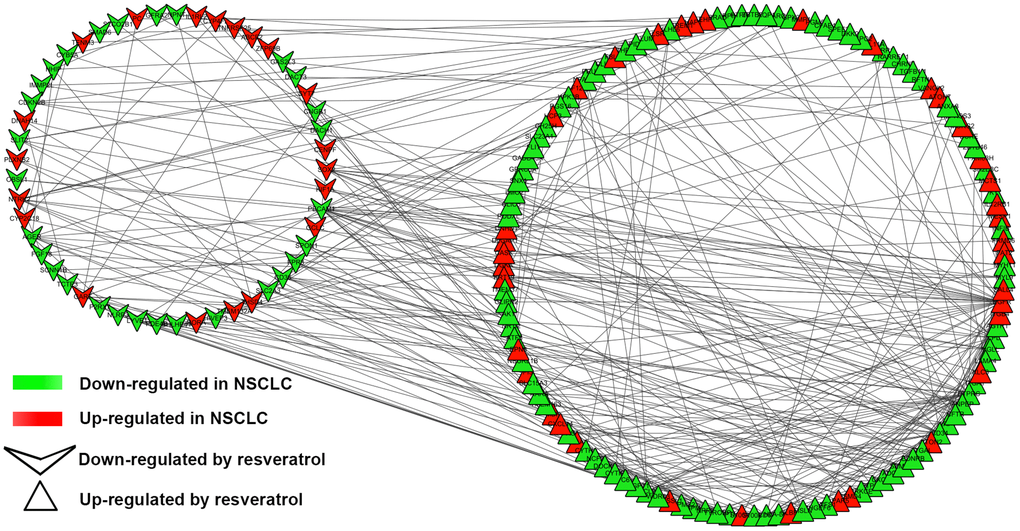
Figure 2. PPI network of DEGs. PPI network exported from STRING and visualized in Cytoscape. A total of 177 nodes and 342 edges were shown in the PPI network (disconnected nodes were removed). A node represents a gene. The genes reduced in NSCLC tissue were shown in green color. The genes increased in NSCLC tissue were shown in red color; at the same time, the genes which down-regulated in A549 by resveratrol were posted in triangles, and the genes which up-regulated by resveratrol were posted in shape “V”.
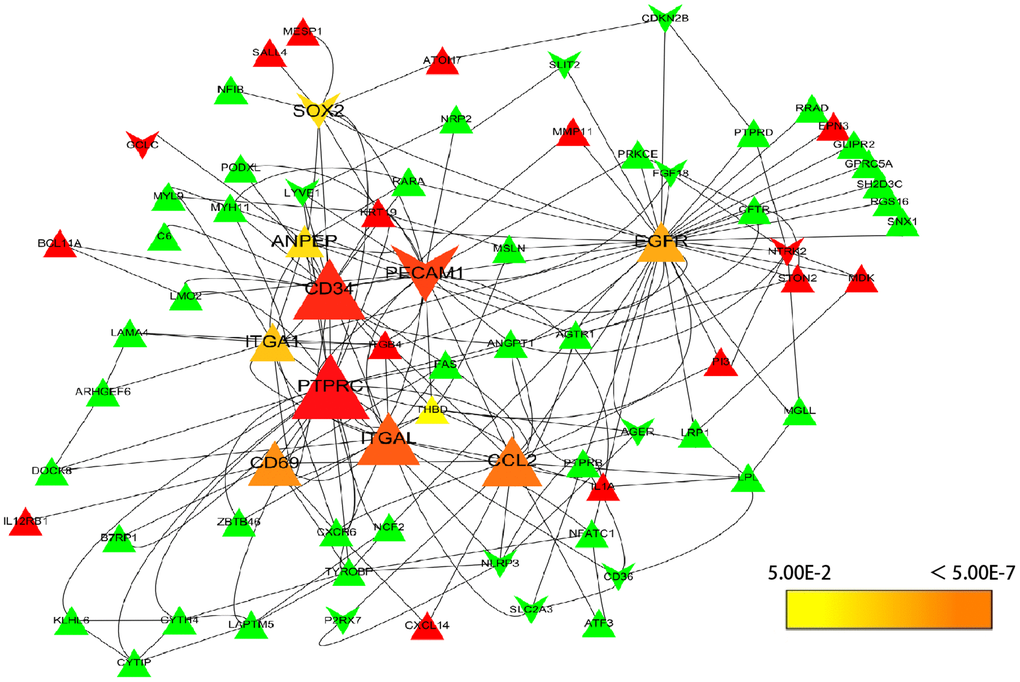
Figure 3. Selection of hub genes. PPI network was analyzed by cytohubba, a plugin of Cytoscape. A node represents a gene. The genes reduced in NSCLC tissue were shown in green color. The genes increased in NSCLC tissue were shown in red color; at the same time, the genes which down-regulated in A549 by resveratrol were posted in triangles, and the genes which up-regulated by resveratrol were posted in shape “V”. The hub genes with higher scores were demonstrated with larger size.
Validation hub genes in clinical samples
In order to validate whether the DEGs identified were also abnormally expressed in NSCLC, we determined the expression of hub genes in clinical samples of LUAD and LUSC from GEPIA and Oncomine™. With the exception of EGFR, the expression trends of the other genes were as same as our analysis in LUAD and LUSC samples compared with normal samples (P < 0.05) (Figure 4). Moreover, the expression of DEGs was analyzed in ten datasets (Figure 5). The P value of SOX2, EGFR, and CD34 were higher than 0.05, the expression trends of ANPEP, CD69, ITGAL, PTPRC, ITGA1, CCL2, and PECAM1 were as same as our analysis in LUAD and LUSC samples compared with normal samples (P < 0.05). To determine the effect of DEGs on prognosis of lung cancer patients, Kaplan-Meier plotter was used to predict the prognostic value of 10 hub genes. Our results found that low expression of PECAM1 was associated with worse overall survival (OS) of NSCLC patients, as well as ANPEP, CD69, ITGAL, and PTPRC (P < 0.05) (Figure 6). Additionally, high expression of SOX2 and EGFR was associated with worse OS of NSCLC patients (P < 0.05) (Figure 6). The expression of CCL2 and CD34 had no associated with OS of NSCLC patients (CCL2, P = 0.068; CD34, P = 0.76). Unfortunately, the result of ITGA1 on OS of NSCLC patients was not retrieved in the Kaplan-Meier plotter database. It was interesting that high expression of PECAM1 was associated with better OS. However, in our study PECAM1 was decreased in NSCLC patients, and resveratrol treatment reduced the expression of PECAM1.
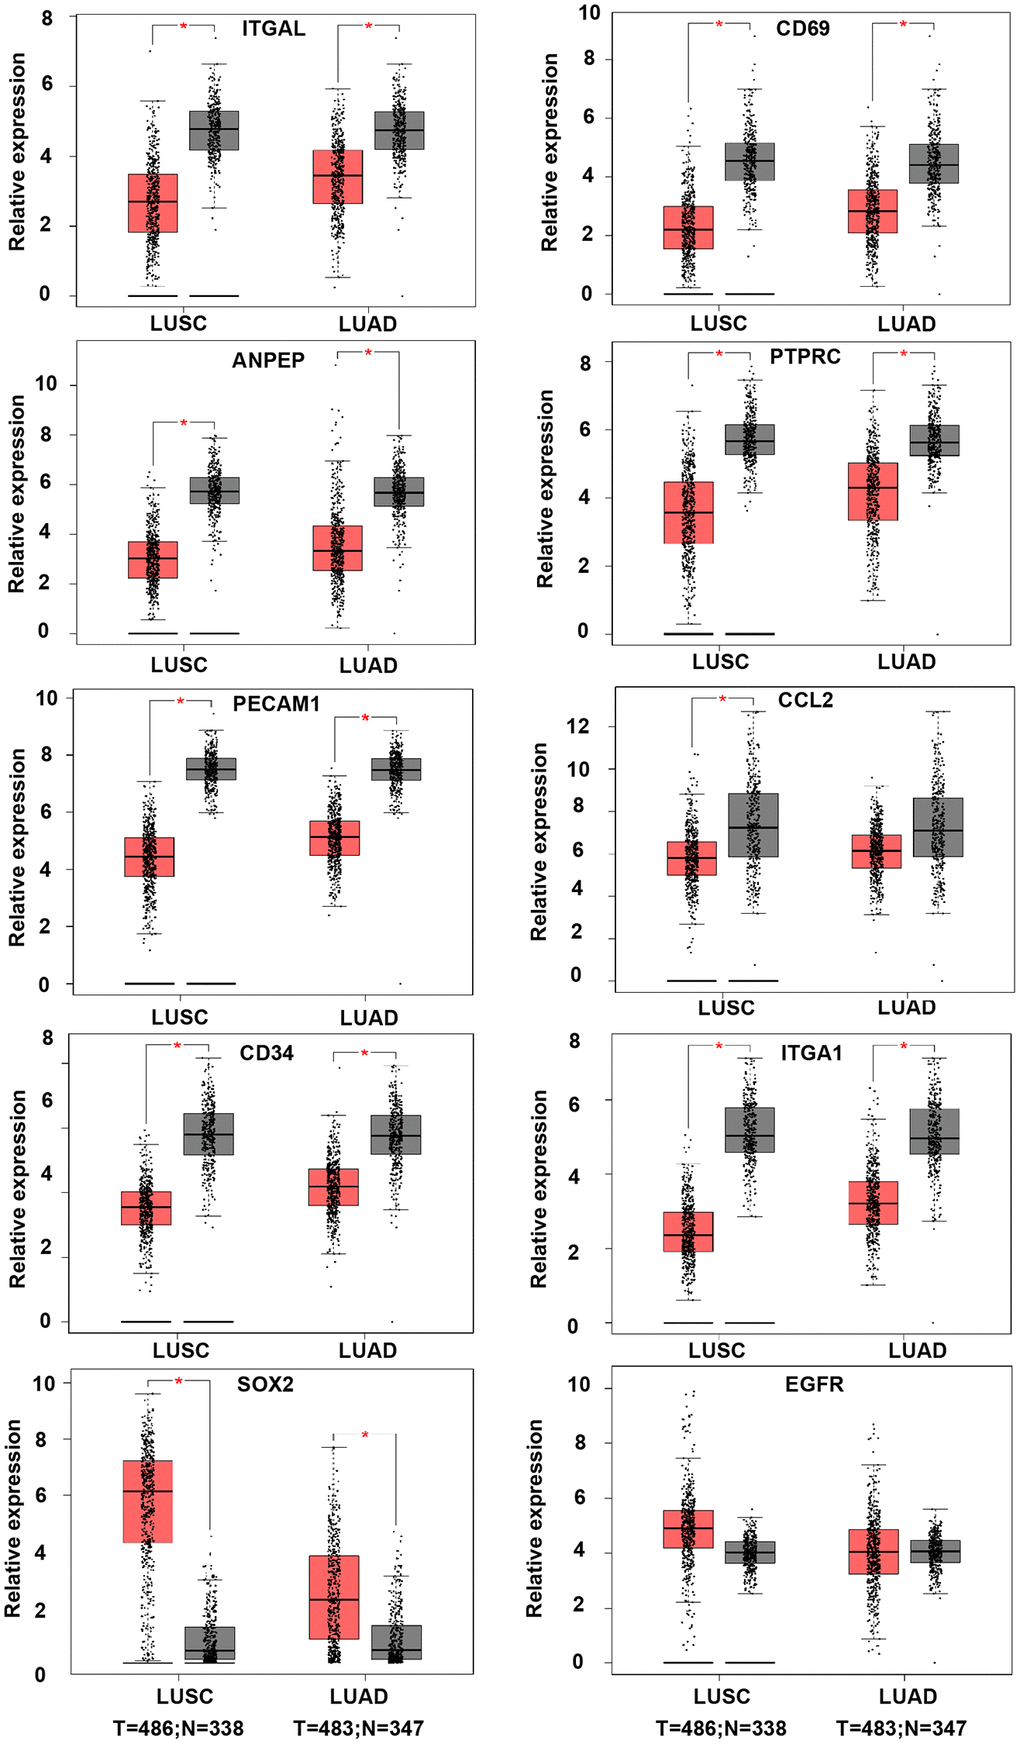
Figure 4. The expression of hub genes in LUSC and LUAD samples of TCGA. The LUAD database was containing 486 tumor and 338 normal samples. LUAD datasets was containing 483 tumor and 347 normal samples. ANPEP, CD69, ITGAL, PTPRC, ITGA1, CCL2, and PECAM1 were down-regulated in both LUSC and LUAD samples. SOX2 was up-regulated in both LUSC and LUAD samples. There was no significant different on EGFR expression between tumor and normal samples (*P < 0.05).
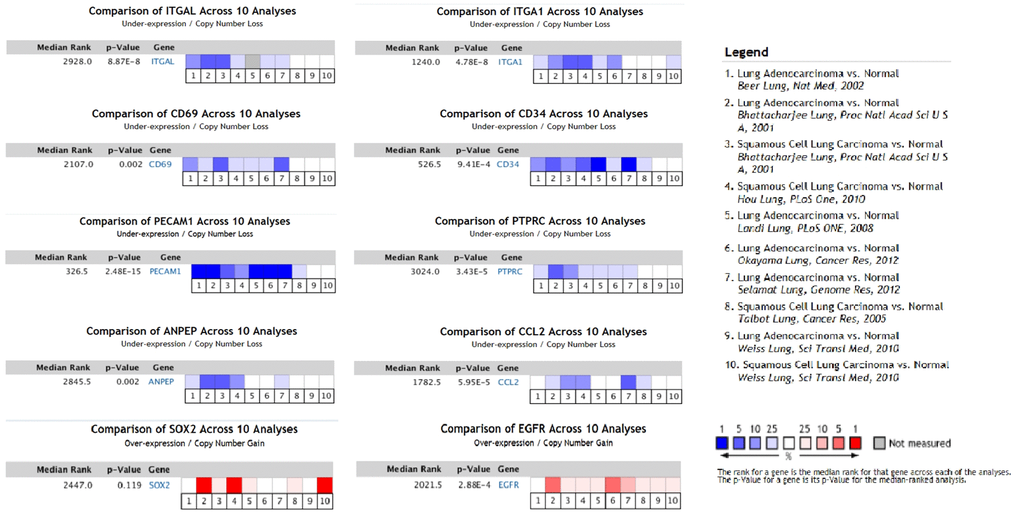
Figure 5. The expression of hub genes in Oncomine™. Six LUAD and four LUSC datasets were selected and the expression of the hub genes was compared across the ten datasets. Normal tissues were chosen as control. Blue colors represented under-expression, and red colors referred to over-expression of hub genes. Colors were shown in blue or red from light to dark according to the quantity of expression (from low to high). ANPEP, CD69, ITGAL, PTPRC, ITGA1, CCL2, and PECAM1 were considered to down-regulate in LUSC and LUAD datasets (P < 0.05). EGFR was up-regulated in LUSC and LUAD datasets (P < 0.05). There was no significant different on SOX2 expression between tumor and normal samples (P = 0.119).
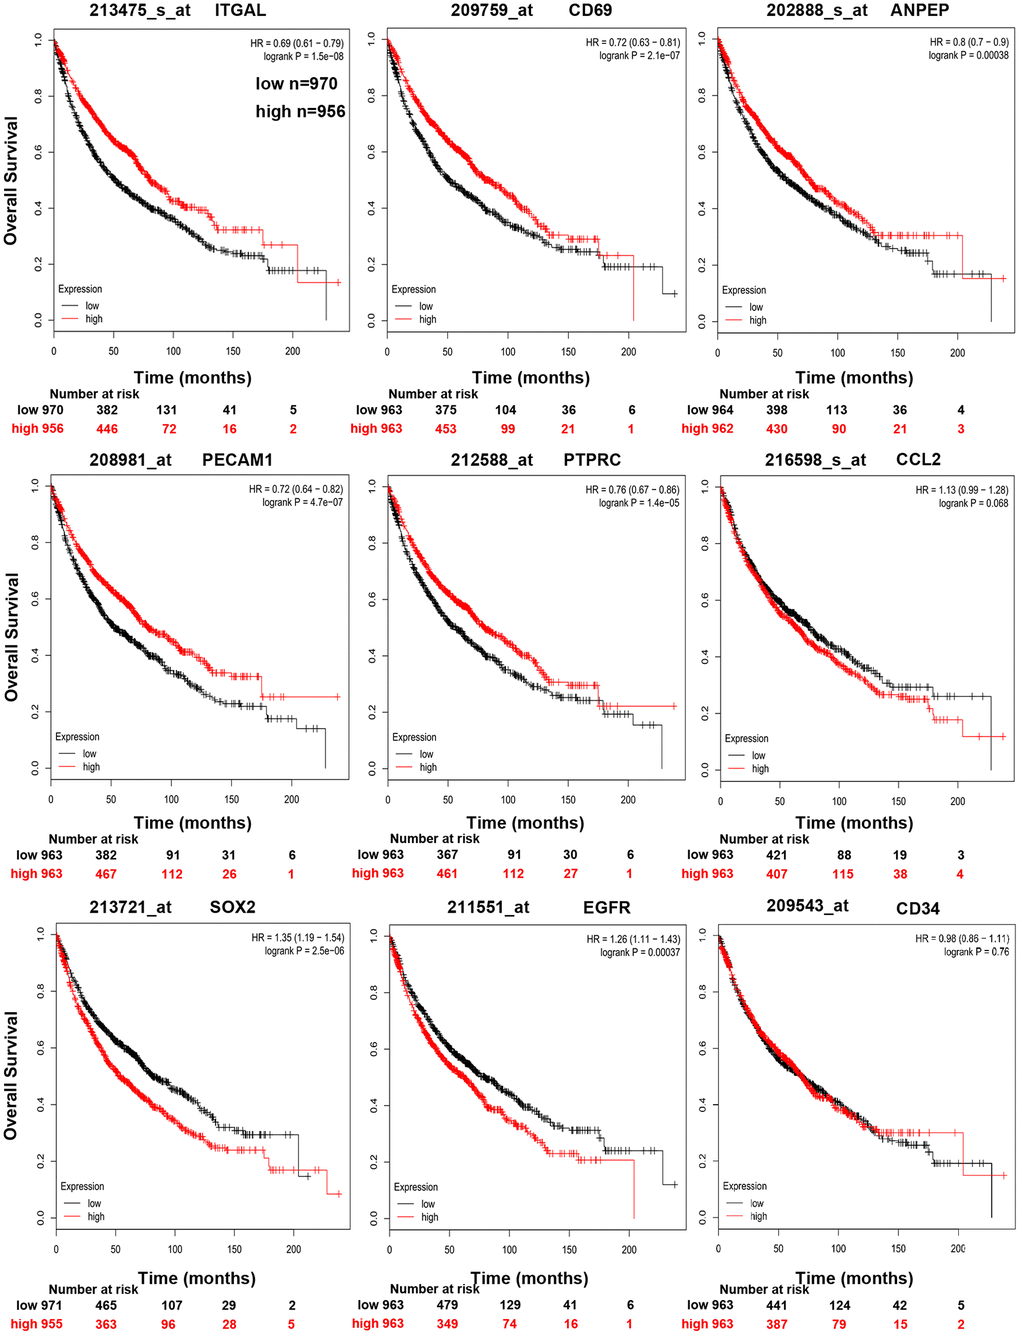
Figure 6. Kaplan-Meier curves displaying OS of NSCLC with high and low expression of ANPEP, CD69, ITGAL, PTPRC, CCL2, PECAM1, CD34, SOX2, and EGFR.
Single nucleotide variation, methylation and pathway activity of validated genes
According to the results verified in clinical samples, ANPEP, CD69, ITGAL, and PTPRC were considered as candidate genes and analyzed in GSCA database. Single nucleotide variations (SNV) of 4 hub genes were detected in 115 of 712 samples (Figure 7A). The SNV frequency of PTPRC was the highest among 4 hub genes, reaching 60% in 115 samples. Missense mutation was the most important mutation type. Gene expression was significantly influenced by genome methylation, we also detected the methylation difference of hub genes in cancer and normal samples. As shown in Figure 7B, methylation of ITGAL and ANPEP were down-regulated, while methylation of CD69 and PTPRC were up-regulated in cancer. We further evaluated the effect of methylation on hub gene expression, and found that methylation of all 4 hub genes was negatively correlated with gene expression. This result demonstrated that down-regulation of CD69 and PTPRC in NSCLC might be regulated by methylation, and other mechanism should be considered to regulate expression of ITGAL and ANPEP in NSCLC. Effect of hub genes on pathway activity has also been considered in the work (Figure 7C). Hub genes were involved in the regulation of apoptosis, cell cycle, EMT, and hormone signal pathway, which are important signal pathways for tumor genesis and development.
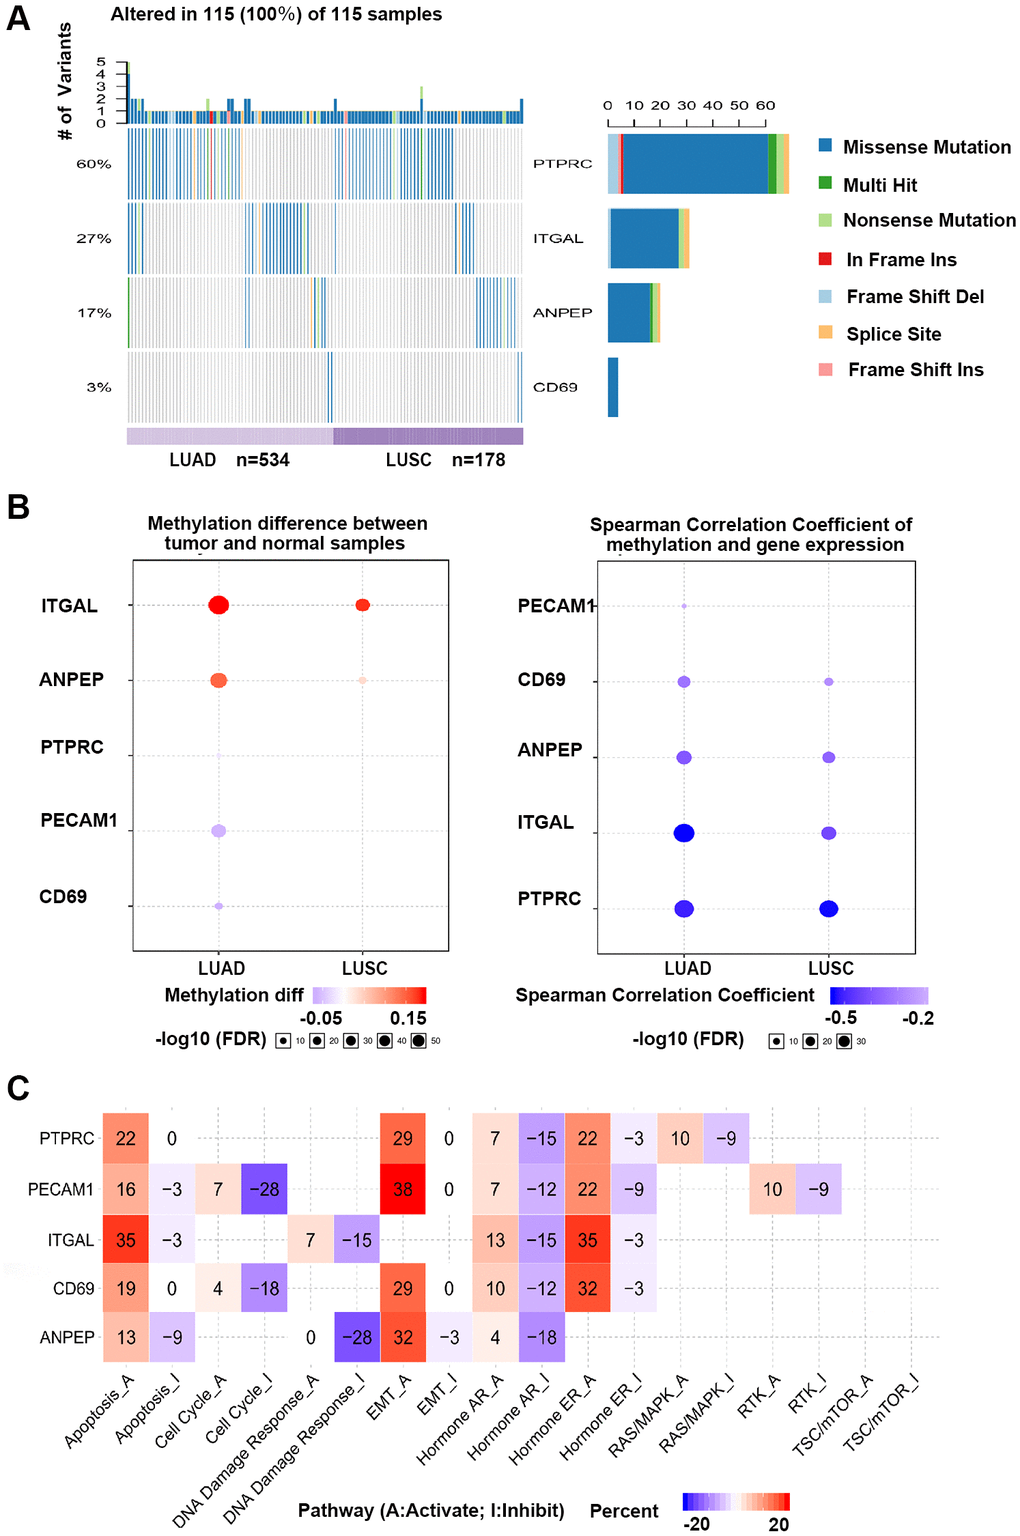
Figure 7. GSCA online database was selected to analyze the single nucleotide variation, methylation and pathway activity of validated genes. (A) Waterfall plots, gives a single nucleotide variation of in LUAD and LUSC gene sets. (B) Methylation of hub genes, Blue points represented a methylation upregulation in tumors, red points represented a methylation downregulation in tumors, the deeper of color, the higher the difference. Student T test were performed to define the methylation difference between tumor and normal samples. The association between mRNA expression and methylation was based on Person’s product moment correlation coefficient, and followed a t distribution. Blue points represented negative correlation, and red represented positive correlation, the deeper of color, the higher the correlation. P value was adjusted by false discovery rate (FDR), FDR ≤ 0.05 was considered as significant. Size of the point represents statistic significance (C) Effects of validated gene on cell pathway activity, gene expression was divided into 2 groups (High and Low) by median expression, the difference of pathway activity score (PAS) between groups was defined by student T test, P value was adjusted by FDR, FDR ≤ 0.05 was considered as significant. Pathway Activity module presents the correlation of genes expression with pathway activity groups (activation and inhibition) that defined by pathway scores.
Discussion
Resveratrol is a phytoestrogen that has been reported to possess wide biological effects, such as anti-oxidant, anti-inflammatory, cardioprotective, and anti-cancer properties [22]. Resveratrol suppresses cancer growth, induces cancer cell apoptosis, and inhibits tumor angiogenesis and metastasis [23]. Although some signal pathways mentioned above have explained the anti-cancer effects of resveratrol, the full mechanisms of resveratrol interfere with cancer are not defined in NSCLC [24].
In this study, a total of 271 DEGs were identified, including 135 genes were increased by resveratrol treatment and down-regulated in NSCLC, 33 genes were reduced by resveratrol and up-regulated in NSCLC. 47 genes were found decreased by resveratrol and down-regulated in NSCLC, 56 genes were increased in NSCLC and the expressions were even higher after resveratrol treatment. In these genes, ANPEP, CD69, ITGAL, PECAM1, PTPRC, CD34, ITGA1, CCL2, SOX2, and EGFR were identified as key DEGs in the treatment of resveratrol in NSCLC, then expression analysis and survival analysis of these ten genes demonstrated that ANPEP, CD69, ITGAL, and PTPRC were the potential candidate genes significantly correlated with resveratrol treatment in NSCLC. Resveratrol treatment increased expression of ANPEP, CD69, ITGAL and PTPRC. The relationship between potential candidate genes expression and methylation was analyzed. As showed in Figure 7, methylation of ANPEP, and ITGAL in tumor cells was elevated compared with normal tissue. DNA methylation of ANPEP, CD69, ITGAL, and PTPRC are negative related to the gene expression. The expression of PTPRC was negatively correlated with the promoter methylation levels in all hematological cells [25]. Knockout of the lysine methyltransferase KMT1E (Setdb1) in thymocyte caused the reduction of CD69 in T cells [26]. It has been reported that the methylation patterns of ITGAL contributed to the development of autoimmunity, aging and cancer [27]. In Jurkat cells, spermine treatment inhibited lymphocyte function by increasing DNA methyltransferase, which enhanced demethylation of the ITGAL promoter and reduced ITGAL expression [28]. The expression of ANPEP was high associated with DNA methylation status of the ANPEP promoter in melanoma cells [29]. Inhibition of DNA methyltransferase increased ANPEP expression and reduced APN-dependent migration of melanoma cells [29]. In prostate cancer patients, low expression and aberrant promoter hypermethylation of ANPEP have been considered as a new independent adverse prognostic factor for patients [30]. Previous studies revealed that resveratrol treatment induced epigenetic changes in many diseases including cancer [31]. Resveratrol treatment has inhibited DNA methyltransferases (DNMTs) including DNMT1, DNMT3a, and DNMT3b expression and activity in human cancer cells [32, 33]. In NSCLC, resveratrol inhibited the expression of DNA (cytosine-5)-methyltransferase 1 and induced demethylation of the DNA (cytosine-5)-methyltransferase 1 target gene [34]. All these evidences suggest that resveratrol affects gene expression by regulating of methylation.
Both protein tyrosine phosphatase receptor type C (PTPRC, also known as CD45) and integrin alpha L chain (ITGAL, also known as CD11a) are pan-leukocyte markers. PTPRC participates in various biological processes including cell growth, mitosis, and malignant transformation [35]. The expression of PTPRC is highly associated with the methylation in testicular germ cell tumors (TGCT) [36]. It has been reported that PTPRC was associated with LUAD patients overall survival and recurrence free survival time [37]. Data of liver biopsy from 65 primary tumor patients showed that positive PTPRC staining in liver tissue was associated with better cumulative survival rate [38]. This study is consistent with our results herein NSCLC, that high expression of PTPRC was associated with better overall survival for NSCLC patients. In dataset GSE9008, resveratrol treatment increased mRNA level of PTPRC in A549 cells, which could be the potential target of resveratrol inhibit tumor progress. PTPRC negatively regulates STAT3 activities by dephosphorylation of JAKs [39]. STAT3 is crucial for tumor development and as a target for anti-tumor therapy [40]. Meanwhile resveratrol has been proved to inhibit STAT3 activity in lung cancer [41]. However, the mechanisms of resveratrol inhibit STAT3 activity via regulating PTPRC need to be further explored. ITGAL forms LFA-1 with ITGB2 [42]. LFA-1 participated in cell-interaction, adhesion and cytotoxic T-cell killing [43]. The anti-tumor role of ITGAL has been confirmed in fibrosarcoma [44]. ITGAL combined with other five peripheral blood derived genes has been used to predicate OS in cancer patients [43]. Another study has been reported that SNPs of ITGAL was associated with high risk of death in castration-resistant prostate cancer (CRPC); there was no substantial relation between SNPs and ITGAL expression [45]. In adenocarcinoma patients, ITGAL was associated with N stage of tumor [46].The effects of resveratrol on ITGAL were less reported. Previous study showed that chemotherapy with propranolol and etodolac increased ITGAL expression and improved recurrence-free survival rates in mice undergoing primary melanoma or Lewis lung carcinoma excision [47]. This result suggested that high level of ITGAL was beneficial for the survival of mice models and was also consistent with our result that increased expression of ITGAL was associated with better overall survival (OS) for NSCLC patients.
CD69 is a type-2 glycoprotein and involved in inflammatory diseases including cancer by interacting with nonspecific legends [48]. The role of CD69 in cancer therapy is ambiguous. It has been reported that lost of CD69 enhanced anti-tumor immunity in CD69−/− mice, CD69−/− mice or CD69 antibody significantly inhibited RM-1 prostate carcinoma growth and metastasis [49, 50]. The expression of CD69 caused retention of tumor-infiltrating CD8 T cells and increased TGFβ production, and these may be the main incentives that induced exhaustion of CD8 T cells [49, 50]. However, during tumor progression, lymphocytes were damaged in tumor microenvironment, and tumor infiltrating lymphocytes (TILs) with CD103+CD8+CD69+ were important for eliminating of tumor cells. Increased TILs with CD69+ were a positive prognostic marker in NSCLC models [51]. Clinical research demonstrated that the level of CD44+, CD54+, and CD69+ lymphocytes in peripheral blood of lung cancer patients were significantly lower than the health and rose after chemotherapy [52]. Treatment with plasma of lung cancer patients inhibited lymphocytes proliferation and reduced CD69 expression, which caused suppression of lymphocyte activity [53]. These results consisted with our finding that CD69 was lower expressed than adjacent tissue. Resveratrol has been reported to increase CD69 expression by inhibiting expression of BCL-6 and subsequently induced apoptosis of transformed follicular lymphoma [54]. It is worth noting that resveratrol also inhibited TGF-β1 expression and substantially prevented TGF-β1/SMADs signal pathway [55], which suggested that resveratrol may prevent exhaustion of CD8+ T cells by inhibiting TGF-β1 signal pathway. Indeed, it has been reported that resveratrol combined treatment with anti-tumor drugs sensitized leukemic lymphocytes and protected normal lymphocytes [56, 57].
Aminopeptidase N (ANPEP or CD13) was a specificity aminopeptidase which had an important role in angiogenesis [58] and participated in drug resistance via regulating ephrine receptor A2 in melanoma cells [59]. The target role of ANPEP on cancer therapy has been summarized before, and evaluation of ANPEP could be a diagnostic and prognostic factor in solid malignancies [60]. We found that mRNA level of ANPEP was down-regulated and the promoter of ANPEP was hypermethylated in NSCLC samples. Down-regulation of ANPEP was associated with worse overall survival for NSCLC patient in Kaplan Meier plotter (n = 1926). Consistent with previous reports that low expression and hypermethylation of ANPEP were correlated inversely with survival in prostate cancer [30]. Of interesting, the soluble form of ANPEP was secreted into serum and the plasma levels of ANPEP were increased in patients with NSCLC [61]. High serum ANPEP was associated with worse tumor progression stage and overall survival rate [61]. The studies using immunohistochemical assay showed that the expression of ANPEP was positive in one-third of the patients and 5-year survival rate was lower than ANPEP negative patients [62]. Another study containing 96 patients demonstrated that the expression of ANPEP was positive only in 9% cases, and there was no significant difference of 5-year survival rate between groups based on ANPEP status [63]. Recently, studies about 270 NSCLC patients reported that ANPEP expression in endothelial cells, vessel-associated stroma cells and tumor cells had no prognostic effect in entire NSCLC [64]. However, ANPEP expression in endothelial cell and vessel-associated stroma cell had positive prognostic effect on NSCLC patients with squamous cell carcinoma, and with negative prognostic effect on tumor stage III patients, and for patients with pN2 lymph node status. In this study univariate prognostic models showed that tumor cells ANPEP mRNA expression was associated with increased over-all survival. They attributed discrepancies, about the effect of ANPEP on prognostic effect and survival, between different groups to heterogeneity in patient cohorts or methodology [64]. Though results which compared the mRNA data with protein data were contradictory, post-transcriptional regulation of ANPEP could explain. Resveratrol up-regulated mRNA level of ANPEP, which was positive associated with survival of NSCLC patients. However, the effect of resveratrol on the post-transcriptional regulation of ANPEP needs to be in-depth study.
In conclusion, we demonstrated that resveratrol mainly effects the molecular involved in signal transduction, cell adhesion, and inflammatory response. We found that ANPEP, CD69, ITGAL, and PTPRC are down-regulated in patients of NSCLC and the expression of these genes is regulated by DNA methylation. Resveratrol increases mRNA expression of the above four molecules. Data of clinical samples confirmed that high expression of these molecules were associated with better prognosis. We suggested that ANPEP, CD69, ITGAL, and PTPRC might be important targets associated with NSCLC treatment by resveratrol and the mechanism required further study.
Supplementary Materials
Author Contributions
Guanghui Ren and Peng Gao contributed to the data acquisition and analysis; Guanghui Ren prepared the figures and wrote the manuscript draft; Peng Gao design the study and reviewed the final manuscript.
Conflicts of Interest
The authors declare no conflicts of interest related to this study.
Funding
This work was supported by foundation of Qianfoshan Hospital (QYPY2020NSFC0820), grants from the Natural Science Foundation of Shandong Province (ZR2019BH007).
References
- 1. Bray F, Ferlay J, Soerjomataram I, Siegel RL, Torre LA, Jemal A. Global cancer statistics 2018: GLOBOCAN estimates of incidence and mortality worldwide for 36 cancers in 185 countries. CA Cancer J Clin. 2018; 68:394–424. https://doi.org/10.3322/caac.21492 [PubMed]
- 2. Shang S, Su Y, Zhu Z, Li B, Guo M, Xu Y, Sun X, Wang L, Yu J. Local ablative therapy with or without chemotherapy for non-small-cell lung cancer patients with postoperative oligometastases. Cancer Manag Res. 2018; 10:6421–29. https://doi.org/10.2147/CMAR.S185592 [PubMed]
- 3. Jang M, Cai L, Udeani GO, Slowing KV, Thomas CF, Beecher CW, Fong HH, Farnsworth NR, Kinghorn AD, Mehta RG, Moon RC, Pezzuto JM. Cancer chemopreventive activity of resveratrol, a natural product derived from grapes. Science. 1997; 275:218–20. https://doi.org/10.1126/science.275.5297.218 [PubMed]
- 4. Liu S, Zheng Z, Ji S, Liu T, Hou Y, Li S, Li G. Resveratrol reduces senescence-associated secretory phenotype by SIRT1/NF-κB pathway in gut of the annual fish Nothobranchius guentheri. Fish Shellfish Immunol. 2018; 80:473–79. https://doi.org/10.1016/j.fsi.2018.06.027 [PubMed]
- 5. Singh AP, Singh R, Verma SS, Rai V, Kaschula CH, Maiti P, Gupta SC. Health benefits of resveratrol: Evidence from clinical studies. Med Res Rev. 2019; 39:1851–91. https://doi.org/10.1002/med.21565 [PubMed]
- 6. Huminiecki L, Horbańczuk J. The functional genomic studies of resveratrol in respect to its anti-cancer effects. Biotechnol Adv. 2018; 36:1699–708. https://doi.org/10.1016/j.biotechadv.2018.02.011 [PubMed]
- 7. Wang J, Li J, Cao N, Li Z, Han J, Li L. Resveratrol, an activator of SIRT1, induces protective autophagy in non-small-cell lung cancer via inhibiting Akt/mTOR and activating p38-MAPK. Onco Targets Ther. 2018; 11:7777–86. https://doi.org/10.2147/OTT.S159095 [PubMed]
- 8. Li X, Wang D, Zhao QC, Shi T, Chen J. Resveratrol Inhibited Non-small Cell Lung Cancer Through Inhibiting STAT-3 Signaling. Am J Med Sci. 2016; 352:524–30. https://doi.org/10.1016/j.amjms.2016.08.027 [PubMed]
- 9. Howells LM, Berry DP, Elliott PJ, Jacobson EW, Hoffmann E, Hegarty B, Brown K, Steward WP, Gescher AJ. Phase I randomized, double-blind pilot study of micronized resveratrol (SRT501) in patients with hepatic metastases--safety, pharmacokinetics, and pharmacodynamics. Cancer Prev Res (Phila). 2011; 4:1419–25. https://doi.org/10.1158/1940-6207.CAPR-11-0148 [PubMed]
- 10. Popat R, Plesner T, Davies F, Cook G, Cook M, Elliott P, Jacobson E, Gumbleton T, Oakervee H, Cavenagh J. A phase 2 study of SRT501 (resveratrol) with bortezomib for patients with relapsed and or refractory multiple myeloma. Br J Haematol. 2013; 160:714–17. https://doi.org/10.1111/bjh.12154 [PubMed]
- 11. Han Y, Jo H, Cho JH, Dhanasekaran DN, Song YS. Resveratrol as a Tumor-Suppressive Nutraceutical Modulating Tumor Microenvironment and Malignant Behaviors of Cancer. Int J Mol Sci. 2019; 20:925. https://doi.org/10.3390/ijms20040925 [PubMed]
- 12. Wang Y, Yang X, Xian S, Zhang L, Cheng Y. CD44v6 may influence ovarian cancer cell invasion and migration by regulating the NF-κB pathway. Oncol Lett. 2019; 18:298–306. https://doi.org/10.3892/ol.2019.10306 [PubMed]
- 13. Liu T, Yan Z, Liu Y, Choy E, Hornicek FJ, Mankin H, Duan Z. CRISPR-Cas9-Mediated Silencing of CD44 in Human Highly Metastatic Osteosarcoma Cells. Cell Physiol Biochem. 2018; 46:1218–30. https://doi.org/10.1159/000489072 [PubMed]
- 14. Ji S, Zheng Z, Liu S, Ren G, Gao J, Zhang Y, Li G. Resveratrol promotes oxidative stress to drive DLC1 mediated cellular senescence in cancer cells. Exp Cell Res. 2018; 370:292–302. https://doi.org/10.1016/j.yexcr.2018.06.031 [PubMed]
- 15. Liu T, Ma L, Zheng Z, Li F, Liu S, Xie Y, Li G. Resveratrol inhibits age-dependent spontaneous tumorigenesis by SIRT1-mediated post-translational modulations in the annual fish Nothobranchius guentheri. Oncotarget. 2017; 8:55422–34. https://doi.org/10.18632/oncotarget.19268 [PubMed]
- 16. Whyte L, Huang YY, Torres K, Mehta RG. Molecular mechanisms of resveratrol action in lung cancer cells using dual protein and microarray analyses. Cancer Res. 2007; 67:12007–17. https://doi.org/10.1158/0008-5472.CAN-07-2464 [PubMed]
- 17. Huang da W, Sherman BT, Lempicki RA. Bioinformatics enrichment tools: paths toward the comprehensive functional analysis of large gene lists. Nucleic Acids Res. 2009; 37:1–13. https://doi.org/10.1093/nar/gkn923 [PubMed]
- 18. Szklarczyk D, Franceschini A, Wyder S, Forslund K, Heller D, Huerta-Cepas J, Simonovic M, Roth A, Santos A, Tsafou KP, Kuhn M, Bork P, Jensen LJ, von Mering C. STRING v10: protein-protein interaction networks, integrated over the tree of life. Nucleic Acids Res. 2015; 43:D447–52. https://doi.org/10.1093/nar/gku1003 [PubMed]
- 19. Chin CH, Chen SH, Wu HH, Ho CW, Ko MT, Lin CY. cytoHubba: identifying hub objects and sub-networks from complex interactome. BMC Syst Biol. 2014 (Suppl 4); 8:S11. https://doi.org/10.1186/1752-0509-8-S4-S11 [PubMed]
- 20. Nagy Á, Lánczky A, Menyhárt O, Győrffy B. Validation of miRNA prognostic power in hepatocellular carcinoma using expression data of independent datasets. Sci Rep. 2018; 8:9227. https://doi.org/10.1038/s41598-018-27521-y [PubMed]
- 21. Liu CJ, Hu FF, Xia MX, Han L, Zhang Q, Guo AY. GSCALite: a web server for gene set cancer analysis. Bioinformatics. 2018; 34:3771–72. https://doi.org/10.1093/bioinformatics/bty411 [PubMed]
- 22. Jara P, Spies J, Cárcamo C, Arancibia Y, Vargas G, Martin C, Salas M, Otth C, Zambrano A. The Effect of Resveratrol on Cell Viability in the Burkitt's Lymphoma Cell Line Ramos. Molecules. 2017; 23:0014. https://doi.org/10.3390/molecules23010014 [PubMed]
- 23. Ko JH, Sethi G, Um JY, Shanmugam MK, Arfuso F, Kumar AP, Bishayee A, Ahn KS. The Role of Resveratrol in Cancer Therapy. Int J Mol Sci. 2017; 18:2589. https://doi.org/10.3390/ijms18122589 [PubMed]
- 24. Elshaer M, Chen Y, Wang XJ, Tang X. Resveratrol: An overview of its anti-cancer mechanisms. Life Sci. 2018; 207:340–49. https://doi.org/10.1016/j.lfs.2018.06.028 [PubMed]
- 25. Calvanese V, Fernández AF, Urdinguio RG, Suárez-Alvarez B, Mangas C, Pérez-García V, Bueno C, Montes R, Ramos-Mejía V, Martínez-Camblor P, Ferrero C, Assenov Y, Bock C, et al. A promoter DNA demethylation landscape of human hematopoietic differentiation. Nucleic Acids Res. 2012; 40:116–31. https://doi.org/10.1093/nar/gkr685 [PubMed]
- 26. Martin FJ, Xu Y, Lohmann F, Ciccone DN, Nicholson TB, Loureiro JJ, Chen T, Huang Q. KMT1E-mediated chromatin modifications at the FcγRIIb promoter regulate thymocyte development. Genes Immun. 2015; 16:162–69. https://doi.org/10.1038/gene.2014.70 [PubMed]
- 27. Richardson BC. Role of DNA methylation in the regulation of cell function: autoimmunity, aging and cancer. J Nutr. 2002 (Suppl 8); 132:2401S–05S. https://doi.org/10.1093/jn/132.8.2401S [PubMed]
- 28. Kano Y, Soda K, Konishi F. Suppression of LFA-1 expression by spermine is associated with enhanced methylation of ITGAL, the LFA-1 promoter area. PLoS One. 2013; 8:e56056. https://doi.org/10.1371/journal.pone.0056056 [PubMed]
- 29. Wulfänger J, Schneider H, Wild P, Ikenberg K, Rodolfo M, Rivoltini L, Meyer S, Riemann D, Seliger B. Promoter methylation of aminopeptidase N/CD13 in malignant melanoma. Carcinogenesis. 2012; 33:781–90. https://doi.org/10.1093/carcin/bgs091 [PubMed]
- 30. Sørensen KD, Abildgaard MO, Haldrup C, Ulhøi BP, Kristensen H, Strand S, Parker C, Høyer S, Borre M, Ørntoft TF. Prognostic significance of aberrantly silenced ANPEP expression in prostate cancer. Br J Cancer. 2013; 108:420–28. https://doi.org/10.1038/bjc.2012.549 [PubMed]
- 31. Fernandes GFS, Silva GDB, Pavan AR, Chiba DE, Chin CM, Dos Santos JL. Epigenetic Regulatory Mechanisms Induced by Resveratrol. Nutrients. 2017; 9:1201. https://doi.org/10.3390/nu9111201 [PubMed]
- 32. Aldawsari FS, Aguayo-Ortiz R, Kapilashrami K, Yoo J, Luo M, Medina-Franco JL, Velázquez-Martínez CA. Resveratrol-salicylate derivatives as selective DNMT3 inhibitors and anticancer agents. J Enzyme Inhib Med Chem. 2016; 31:695–703. https://doi.org/10.3109/14756366.2015.1058256 [PubMed]
- 33. Qin W, Zhang K, Clarke K, Weiland T, Sauter ER. Methylation and miRNA effects of resveratrol on mammary tumors vs. normal tissue. Nutr Cancer. 2014; 66:270–77. https://doi.org/10.1080/01635581.2014.868910 [PubMed]
- 34. Fudhaili A, Yoon NA, Kang S, Ryu J, Jeong JY, Lee DH, Kang SS. Resveratrol epigenetically regulates the expression of zinc finger protein 36 in non-small cell lung cancer cell lines. Oncol Rep. 2019; 41:1377–86. https://doi.org/10.3892/or.2018.6898 [PubMed]
- 35. Jacobsen M, Schweer D, Ziegler A, Gaber R, Schock S, Schwinzer R, Wonigeit K, Lindert RB, Kantarci O, Schaefer-Klein J, Schipper HI, Oertel WH, Heidenreich F, et al. A point mutation in PTPRC is associated with the development of multiple sclerosis. Nat Genet. 2000; 26:495–99. https://doi.org/10.1038/82659 [PubMed]
- 36. Bo H, Cao K, Tang R, Zhang H, Gong Z, Liu Z, Liu J, Li J, Fan L. A network-based approach to identify DNA methylation and its involved molecular pathways in testicular germ cell tumors. J Cancer. 2019; 10:893–902. https://doi.org/10.7150/jca.27491 [PubMed]
- 37. Li L, Peng M, Xue W, Fan Z, Wang T, Lian J, Zhai Y, Lian W, Qin D, Zhao J. Integrated analysis of dysregulated long non-coding RNAs/microRNAs/mRNAs in metastasis of lung adenocarcinoma. J Transl Med. 2018; 16:372. https://doi.org/10.1186/s12967-018-1732-z [PubMed]
- 38. Kemper M, Strohm T, Grupp K, Ghadban T, Bogoevski D, Bachmann K, Bockhorn M, Sauter G, Izbicki JR, Reeh M. Increase of CD45-positive Immune Cells in Liver Parenchyma Indicates a More Favorable Prognosis for Patients With Barrett's Cancer. Anticancer Res. 2019; 39:1191–96. https://doi.org/10.21873/anticanres.13229 [PubMed]
- 39. Irie-Sasaki J, Sasaki T, Matsumoto W, Opavsky A, Cheng M, Welstead G, Griffiths E, Krawczyk C, Richardson CD, Aitken K, Iscove N, Koretzky G, Johnson P, et al. CD45 is a JAK phosphatase and negatively regulates cytokine receptor signalling. Nature. 2001; 409:349–54. https://doi.org/10.1038/35053086 [PubMed]
- 40. Gao P, Niu N, Wei T, Tozawa H, Chen X, Zhang C, Zhang J, Wada Y, Kapron CM, Liu J. The roles of signal transducer and activator of transcription factor 3 in tumor angiogenesis. Oncotarget. 2017; 8:69139–61. https://doi.org/10.18632/oncotarget.19932 [PubMed]
- 41. Sun L, Chen B, Jiang R, Li J, Wang B. Resveratrol inhibits lung cancer growth by suppressing M2-like polarization of tumor associated macrophages. Cell Immunol. 2017; 311:86–93. https://doi.org/10.1016/j.cellimm.2016.11.002 [PubMed]
- 42. Anikeeva N, Somersalo K, Sims TN, Thomas VK, Dustin ML, Sykulev Y. Distinct role of lymphocyte function-associated antigen-1 in mediating effective cytolytic activity by cytotoxic T lymphocytes. Proc Natl Acad Sci U S A. 2005; 102:6437–42. https://doi.org/10.1073/pnas.0502467102 [PubMed]
- 43. Giblin PA, Lemieux RM. LFA-1 as a key regulator of immune function: approaches toward the development of LFA-1-based therapeutics. Curr Pharm Des. 2006; 12:2771–95. https://doi.org/10.2174/138161206777947731 [PubMed]
- 44. Mukai S, Kagamu H, Shu S, Plautz GE. Critical role of CD11a (LFA-1) in therapeutic efficacy of systemically transferred antitumor effector T cells. Cell Immunol. 1999; 192:122–32. https://doi.org/10.1006/cimm.1998.1439 [PubMed]
- 45. Forchhammer L, Møller P, Riddervold IS, Bønløkke J, Massling A, Sigsgaard T, Loft S. Controlled human wood smoke exposure: oxidative stress, inflammation and microvascular function. Part Fibre Toxicol. 2012; 9:7. https://doi.org/10.1186/1743-8977-9-7 [PubMed]
- 46. Zheng W, Jiang C, Li R. Integrin and gene network analysis reveals that ITGA5 and ITGB1 are prognostic in non-small-cell lung cancer. Onco Targets Ther. 2016; 9:2317–27. https://doi.org/10.2147/OTT.S91796 [PubMed]
- 47. Glasner A, Avraham R, Rosenne E, Benish M, Zmora O, Shemer S, Meiboom H, Ben-Eliyahu S. Improving survival rates in two models of spontaneous postoperative metastasis in mice by combined administration of a beta-adrenergic antagonist and a cyclooxygenase-2 inhibitor. J Immunol. 2010; 184:2449–57. https://doi.org/10.4049/jimmunol.0903301 [PubMed]
- 48. Kimura MY, Koyama-Nasu R, Yagi R, Nakayama T. A new therapeutic target: the CD69-Myl9 system in immune responses. Semin Immunopathol. 2019; 41:349–58. https://doi.org/10.1007/s00281-019-00734-7 [PubMed]
- 49. Esplugues E, Sancho D, Vega-Ramos J, Martínez C, Syrbe U, Hamann A, Engel P, Sánchez-Madrid F, Lauzurica P. Enhanced antitumor immunity in mice deficient in CD69. J Exp Med. 2003; 197:1093–106. https://doi.org/10.1084/jem.20021337 [PubMed]
- 50. Esplugues E, Vega-Ramos J, Cartoixà D, Vazquez BN, Salaet I, Engel P, Lauzurica P. Induction of tumor NK-cell immunity by anti-CD69 antibody therapy. Blood. 2005; 105:4399–406. https://doi.org/10.1182/blood-2004-10-3854 [PubMed]
- 51. Bouillez A, Adeegbe D, Jin C, Hu X, Tagde A, Alam M, Rajabi H, Wong KK, Kufe D. MUC1-C promotes the suppressive immune microenvironment in non-small cell lung cancer. Oncoimmunology. 2017; 6:e1338998. https://doi.org/10.1080/2162402X.2017.1338998 [PubMed]
- 52. Luo Z, Wang Y, Lou Y, Cao C, Hubbard R, Xu N, Huang X. Unfavorable clinical implications of peripheral blood CD44+ and CD54+ lymphocytes in patients with lung cancer undergoing chemotherapy. Int J Biol Markers. 2018; 33:208–14. https://doi.org/10.5301/ijbm.5000309 [PubMed]
- 53. Sun LX, Li WD, Lin ZB, Duan XS, Li XF, Yang N, Lan TF, Li M, Sun Y, Yu M, Lu J. Protection against lung cancer patient plasma-induced lymphocyte suppression by Ganoderma lucidum polysaccharides. Cell Physiol Biochem. 2014; 33:289–99. https://doi.org/10.1159/000356669 [PubMed]
- 54. Faber AC, Chiles TC. Resveratrol induces apoptosis in transformed follicular lymphoma OCI-LY8 cells: evidence for a novel mechanism involving inhibition of BCL6 signaling. Int J Oncol. 2006; 29:1561–66. https://doi.org/10.3892/ijo.29.6.1561 [PubMed]
- 55. Farooqi AA, Khalid S, Ahmad A. Regulation of Cell Signaling Pathways and miRNAs by Resveratrol in Different Cancers. Int J Mol Sci. 2018; 19:652. https://doi.org/10.3390/ijms19030652 [PubMed]
- 56. Ivanova D, Zhelev Z, Semkova S, Aoki I, Bakalova R. Resveratrol Modulates the Redox-status and Cytotoxicity of Anticancer Drugs by Sensitizing Leukemic Lymphocytes and Protecting Normal Lymphocytes. Anticancer Res. 2019; 39:3745–55. https://doi.org/10.21873/anticanres.13523 [PubMed]
- 57. Bahrami A, Fereidouni M, Pirro M, Bianconi V, Sahebkar A. Modulation of regulatory T cells by natural products in cancer. Cancer Lett. 2019; 459:72–85. https://doi.org/10.1016/j.canlet.2019.06.001 [PubMed]
- 58. Pasqualini R, Koivunen E, Kain R, Lahdenranta J, Sakamoto M, Stryhn A, Ashmun RA, Shapiro LH, Arap W, Ruoslahti E. Aminopeptidase N is a receptor for tumor-homing peptides and a target for inhibiting angiogenesis. Cancer Res. 2000; 60:722–27. [PubMed]
- 59. Azimi A, Tuominen R, Costa Svedman F, Caramuta S, Pernemalm M, Frostvik Stolt M, Kanter L, Kharaziha P, Lehtiö J, Hertzman Johansson C, Höiom V, Hansson J, Egyhazi Brage S. Silencing FLI or targeting CD13/ANPEP lead to dephosphorylation of EPHA2, a mediator of BRAF inhibitor resistance, and induce growth arrest or apoptosis in melanoma cells. Cell Death Dis. 2017; 8:e3029. https://doi.org/10.1038/cddis.2017.406 [PubMed]
- 60. Wickström M, Larsson R, Nygren P, Gullbo J. Aminopeptidase N (CD13) as a target for cancer chemotherapy. Cancer Sci. 2011; 102:501–08. https://doi.org/10.1111/j.1349-7006.2010.01826.x [PubMed]
- 61. Tokuhara T, Hattori N, Ishida H, Hirai T, Higashiyama M, Kodama K, Miyake M. Clinical significance of aminopeptidase N in non-small cell lung cancer. Clin Cancer Res. 2006; 12:3971–78. https://doi.org/10.1158/1078-0432.CCR-06-0338 [PubMed]
- 62. Murakami H, Yokoyama A, Kondo K, Nakanishi S, Kohno N, Miyake M. Circulating aminopeptidase N/CD13 is an independent prognostic factor in patients with non-small cell lung cancer. Clin Cancer Res. 2005; 11:8674–79. https://doi.org/10.1158/1078-0432.CCR-05-1005 [PubMed]
- 63. Ito S, Miyahara R, Takahashi R, Nagai S, Takenaka K, Wada H, Tanaka F. Stromal aminopeptidase N expression: correlation with angiogenesis in non-small-cell lung cancer. Gen Thorac Cardiovasc Surg. 2009; 57:591–98. https://doi.org/10.1007/s11748-009-0445-x [PubMed]
- 64. Schmidt LH, Brand C, Stucke-Ring J, Schliemann C, Kessler T, Harrach S, Mohr M, Görlich D, Marra A, Hillejan L, Müller-Tidow C, Lenz G, Wardelmann E, et al. Correction: Potential therapeutic impact of CD13 expression in non-small cell lung cancer. PLoS One. 2017; 12:e0183201. https://doi.org/10.1371/journal.pone.0183201 [PubMed]