Submit an Article
Navigate
Home
Editorial Board
Editorial Policies
Current Volume
Archive
Scientific Integrity
Publication Ethics Statements
Interviews with Outstanding Authors
Newsroom
Sponsored Conferences
Podcast
Contact
Special Collections
Submit an Article
Online ISSN: 1945-4589
Research Paper
|
Volume 13, Issue 19
|
pp. 23245–23261
Identification of potential target genes of non-small cell lung cancer in response to resveratrol treatment by bioinformatics analysis
Back to article
Figure 6
(6 of 7)
−
100%
+
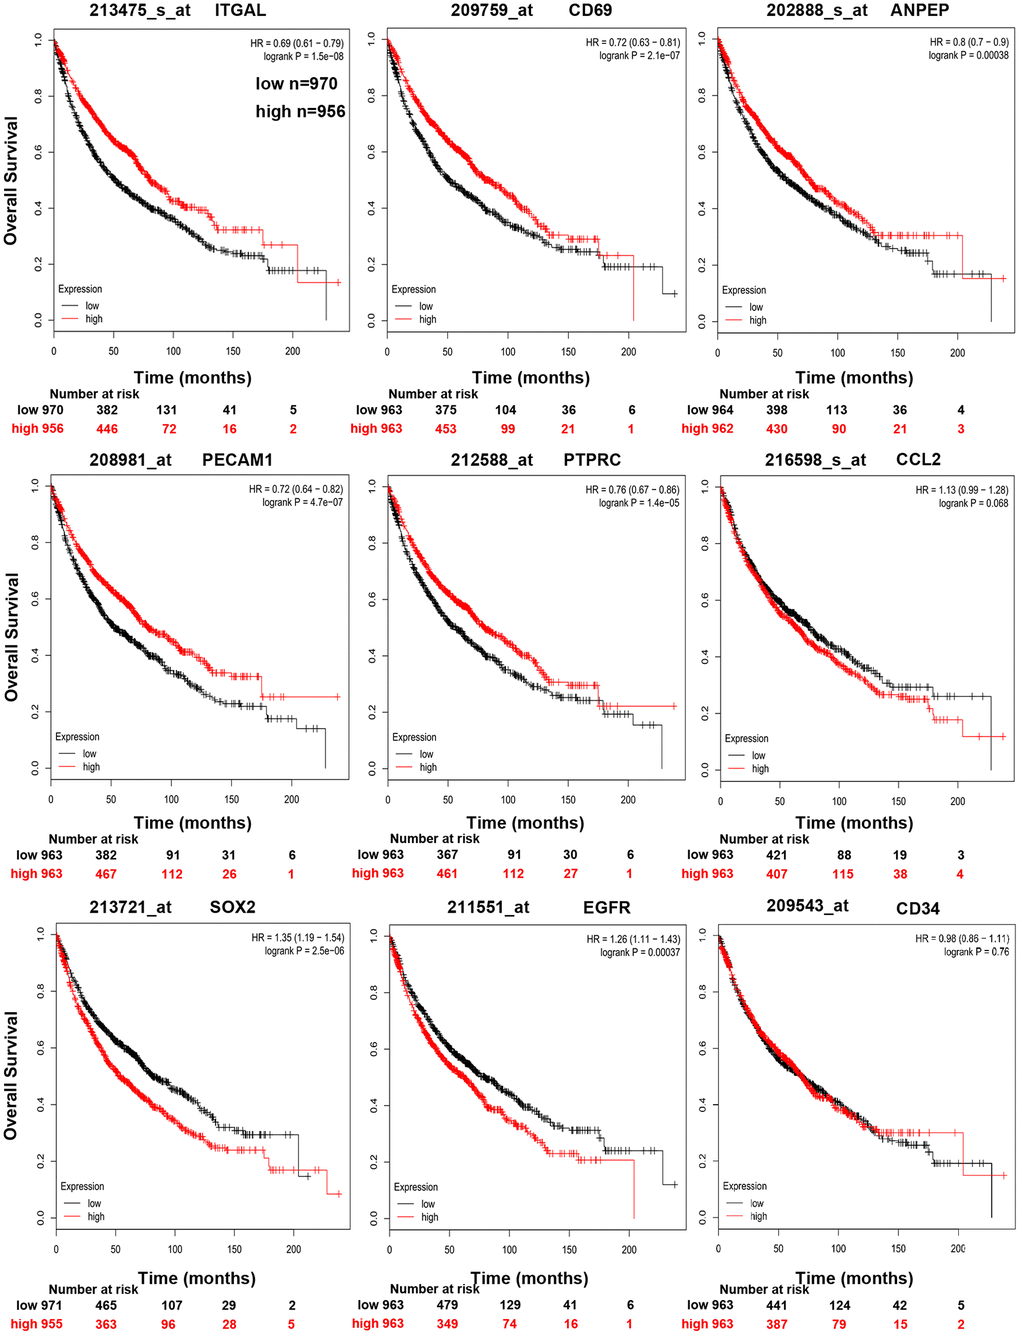
Figure 6.
Kaplan-Meier curves displaying OS of NSCLC with high and low expression of
ANPEP, CD69, ITGAL, PTPRC, CCL2, PECAM1, CD34, SOX2
, and
EGFR
.