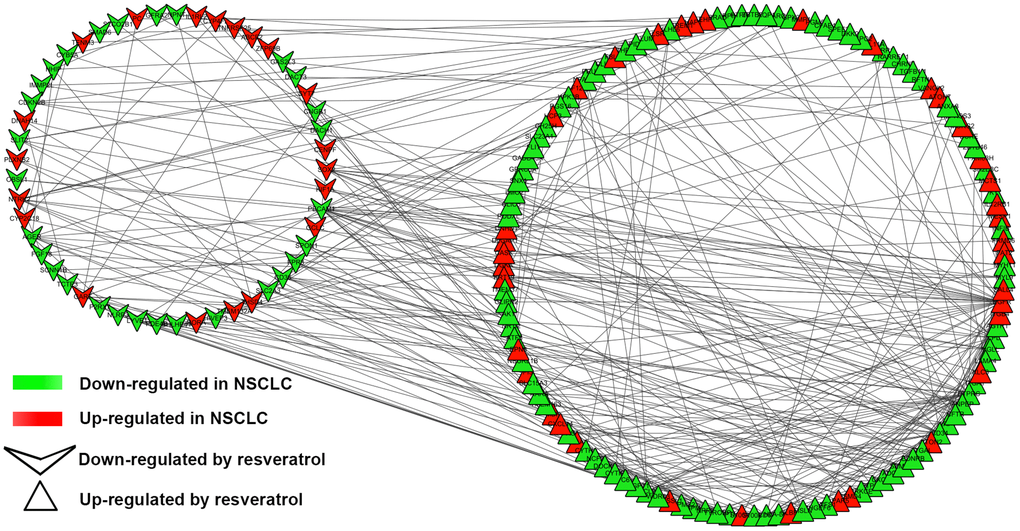
Figure 2.PPI network of DEGs. PPI network exported from STRING and visualized in Cytoscape. A total of 177 nodes and 342 edges were shown in the PPI network (disconnected nodes were removed). A node represents a gene. The genes reduced in NSCLC tissue were shown in green color. The genes increased in NSCLC tissue were shown in red color; at the same time, the genes which down-regulated in A549 by resveratrol were posted in triangles, and the genes which up-regulated by resveratrol were posted in shape “V”.