


Introduction
Bladder cancer (BLCA) is a highly heterogeneous cancer. There are three main tumor areas in the bladder. In most cases, blood in the urine (called hematuria) is the first sign of bladder cancer [1]. However, the early diagnosis and therapy response prediction of BLCA are still not satisfactory.
These malignant tumors' complexity stems from multi-dimensional genetic variation affected by changes in genetic factors, including transcription levels and genome levels. With next-generation sequencing, we can use RNAseq data to analyze genes or transcripts significantly different in BLCA patients at the transcriptome level. At the same time, we can use WES data to obtain genes or loci with high-frequency mutations in BLCA patients. Many studies have detected and confirmed differentially expressed genes and mutations in BLCA patients [2–4]. However, these variants were detected either using one approach or using one dataset of cohorts. The consistency between multiple studies is much lower than expected [5].
The canonical sequencing analysis protocols have identified a large number of genetic variations through comparison with reference sequences. However, the current human reference sequence is still incomplete [6]. There are many gaps in the human genome, including telomere regions, centromeres, as well as a large number of repetitive regions and other low complexity regions. Due to these regions' low mappability, it is challenging to obtain confidential coverage during the sequencing process, so we also call them the “dark genome” [7]. Many cancer-related genetic variants exist in these gaps, but the canonical sequencing analysis protocols often ignore or discard these results.
Another alternative approach is mapping-free protocols. In recent years, researchers have developed many analysis methods that do not rely on reference sequences. One of the commonly used algorithms is the De Bruijn graph (DBG) [8]. DBG is widely used in the de novo assembly, especially for the species without available or complete reference. DBG is the graph algorithm based on the k-mers approach, which decomposes the reads into smaller k-mers. Then a graph is constructed according to the overlap between k-mers. A variant generates a bubble structure due to the two alleles in each branch. Therefore, variants are captured by searching for bubbles from the DBG. Generally, each library is used to construct its DBG and capture variants independently. Another mapping-free protocol dealing with large numbers of cohorts is called DEkupl [9]. This algorithm first screens k-mers absent in the reference and then uses a differential test to select significant k-mers between two conditions. The differential test methods include T-test, DESeq2 [10], and LimmaVoom [11]. Finally, these selected k-mers are merged into contigs. All these contigs are supposed to harbor variants or belong to the genome gaps.
This study integrated the mapping-based protocol and mapping-free protocol to achieve a comprehensive analysis of BLCA patients. Both RNAseq and WES data were applied to obtain novel transcriptional events and convincing SNVs. A diagnostic model was constructed using signatures selected by lasso regression. We proved the accuracy of using the model to predict progressive patients on independent validation data.
Materials and Methods
Data extraction
The Binary Alignment Map (BAM) files of all BLCA patients were retrieved from the TCGA database with permission from dbGAP [12]. BAM files were converted to paired-ends fastq files using Picard tools with default parameters. Both of the RNAseq and WES sequencing data were involved in this study. All patients' clinical information was also obtained, including the survival time, stage, relapse, or metastasis. Patients were divided into two groups: complete remission and progressive group. Adapters sequences were trimmed using the cutadapt software with default parameters [13]. Duplicated reads were removed since these reads are majority generated from the PCR process instead of natural status in cells.
Canonical protocol based on genome reference
The latest version of the genome and annotation files were downloaded from the Gencode [14]. Reads from RNAseq data were mapped to the human genome of the hg38 version using the STAR software with default parameters [15]. Reads from the WES data were mapped to the human genome using the BWA algorithm with default parameters [16]. The BAM file processing is performed using the Cufflinks software [17]. Given genome annotation file (GTF) and BAM files, we performed differential expression analysis of genes using the Cuffdiff algorithm [18]. Cuffdiff calculates the FPKM of each gene in each sample by summing the FPKMs of all transcripts belonging to the host gene. Differentially expressed genes were selected by Cuffdiff with default parameters from the FPKM matrices. For WES data analysis, GATK was applied to call somatic variants using the BAM files from WES dataset, and all somatic variants were stored in the Variant Call Format (VCF) format files [19]. The single-nucleotide variants (SNVs) from all BLCA patients were aggregated as a matrix. SNVs observed in at least two patients were selected as recurrent SNVs.
Mapping-free protocol without genome reference
As the human genome is not completed and gaps are present, all variations within the 'unannotated' regions are not captured by canonical methods. Herein, we introduced a mapping-free protocol named DEkupl [9]. The reads are decomposed to k-mers, and all the k-mers different to reference are retained. In this way, we can exhaustively capture all the variations in the “dark genome regions”. The DEkupl estimates the gene expression using the Kallisto, which is also a reference-free software [20]. The expression level of both genes and k-mers were compared between the complete remission and progressive groups. Genes and k-mers with P values less than 0.05 and log2FC beyond 95% confidence interval were considered differentially expressed genes (DEGs). Consequently, the DEkupl software provides both differentially expressed genes detected by limma and novel events with variations exhibited as contigs.
Gene-level candidates through transcriptome analysis
As the gene expression estimators in the two protocols are based on different rationales, we compared the differential genes detected by both protocols between the complete remission and progressive groups. Cufflink and Kallisto were applied to detect DEGs in the mapping-based and mapping-free protocols, respectively. Only the consistent differential genes between the two protocols were considered to be bladder cancer-related candidates. Eventually, the consistent DEGs between responsive and progressive patients were selected as gene-level candidates.
Contig-level candidates through transcriptome analysis
Since we do not align reads to the reference in the mapping-free protocol, we retained all the contigs harboring differences to the reference. We can benefit from this because variations within the repeat or low complexity regions can also be kept, which would be ignored or discarded by the aligners such as STAR or BWA. Only the differentially expressed contigs (DECs) were retained and further mapped to the genome for annotation. The annotation process was done using GSNAP of version 2020-06-04 [21]. The DECs contain multiple events, including SNV, splice, split, lincRNA, polyA, repeat, and unmapped contigs. The unmapped contigs may either come from the exogenous microorganisms or unannotated human genome. All these events represented by contigs are absent in the transcriptome, thus the mapping-free protocol products were regarded as 'novel' events.
Convincing SNVs integrating WES and RNAseq analysis
In the WES data analysis, we screened recurrent SNVs present in at least two bladder cancer patients. However, many such SNVs do not make sense if their host genes do not show differential expressions or even stay silent. Only SNVs embedded in the DEGs are more likely biological factors to cancer progression. Therefore, we compared the host genes of all recurrent SNVs to the consistent DEGs (gene-level candidates) and only kept the intersection genes.
Survival analysis of genes and contigs
The convincing candidates were composed of consistent DEGs between two protocols and significant DECs detected by the mapping-free protocol. The candidates were compared to the patients' overall survival time using survival analysis. The P values were calculated using the log-rank test [22] with univariate cox regression. The Kaplan–Meier curves [23] were drawn for the top prognosis related candidates. Besides the univariate cox regression, we also applied the cox proportional-hazards model (coxPh), a multivariate regression model [24]. Genes and contigs significant in both univariate and multivariate cox analysis were selected as prognostic candidates.
Deeply investigate the novel events
The novel events detected by mapping-free protocol cannot be mapped to the reference by aligners. We cannot locate these novel events to specific genes or positions on the genome either. However, the contigs corresponding to these novel events show differential expression as cancer progresses. We compared signature contigs' expression profile between the early stage (stage I/II) and late-stage (stage III/IV) patients to deeply investigate the relationship between the novel events and cancer progression. Survival analysis was performed to select the potential signature contigs as prognostic indicators.
Diagnostic model construction integrating the signatures
The significant gene candidates were screened using the log-rank test. To take the collinearity between variables into account, we further applied the lasso regression [25] to select diagnostic signatures. The samples were randomly separated into two groups, in which 75% were training set and the rest 25% were test set. A support vector machine (SVM) model was constructed using the selected signatures [26]. Five-fold cross-validation [27] was used to assess the performance of the diagnostic model on the trainset. The samples were randomly split into five folds. We trained the model using four folds of samples in each cycle and tested it using the rest one fold. This procedure was repeated until all samples were predicted once as test sample. The ROC curve was shown with the sensitivity and specificity on the test set [28].
Validation on the independent GEO dataset
To further validate our model's performance of predicting progressive bladder cancer patients, we applied another independent dataset from the GEO database. The validation data accession is GSE31189, which comprises 52 bladder cancer patients and 40 normal samples. The performance of our diagnostic model was shown using the ROC curve.
Results
Differentially expressed genes from RNAseq data
Differentially expressed genes (DEGs) between BLCA patients and normal samples were extracted from the RNAseq data integrating mapping-based and mapping-free protocols. Up/down-regulated genes were extracted according to the P values and fold change values. The selected genes present diverse expression levels between responsive and progressive patients. The volcano graphs of DEGs consistent between canonical RNAseq pipeline and DEkupl were drawn, as shown in Figure 1A.
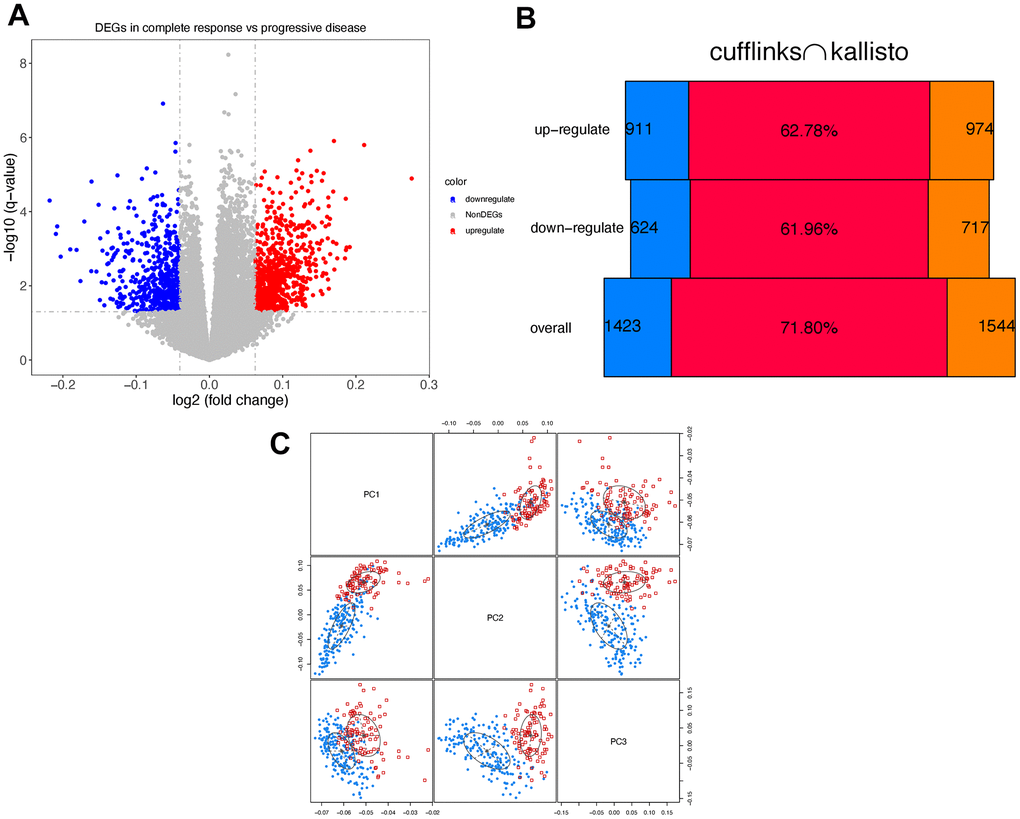
Figure 1. Differentially expressed genes. (A) Volcano graph of consistent DEGs using cufflinks and kallisto. Red/blue dots represent the up/down-regulated genes. (B) The results generated by cufflinks are marked in blue, and the results of kallisto are marked in orange. The red bars in the middle indicate the Jaccard index. (C) Principle component analysis. Response/progressive patients are marked in blue and red, respectively.
Figure 1B shows the consistent DEGs between the two protocols. The consistent DEGs were used as stable prognostic risk genes. Eventually, we obtained 1240 consistent DEGs in total, including 727 up-regulated and 513 down-regulated genes, respectively.
To check if two groups of patients present differences on DEGs level, we performed the principal component analysis (PCA) [29]. As seen in Figure 1C, the two groups of patients can be distinguished using the first three components.
To further clarify the functions regulated by the DEGs, we enriched the DEGs to both gene ontology (GO) and the KEGG pathway [30] using the clusterProfiler package [31]. The top 10 GO biology process terms are shown in Figure 2A. The significant functions include axonogenesis and morphogenesis. Figure 2B shows the four hub functions and corresponding genes. These functions are supposed to be activated as most of the involved genes were up-regulated in progressive patients. Figure 2C suggests that some enriched functions share cross-talk genes. These genes achieve the communication between functions as bridges. Figure 2D is the most significant KEGG pathway that was enriched by 23 DEGs. It implies the genetic association between Bladder cancer and melanoma.
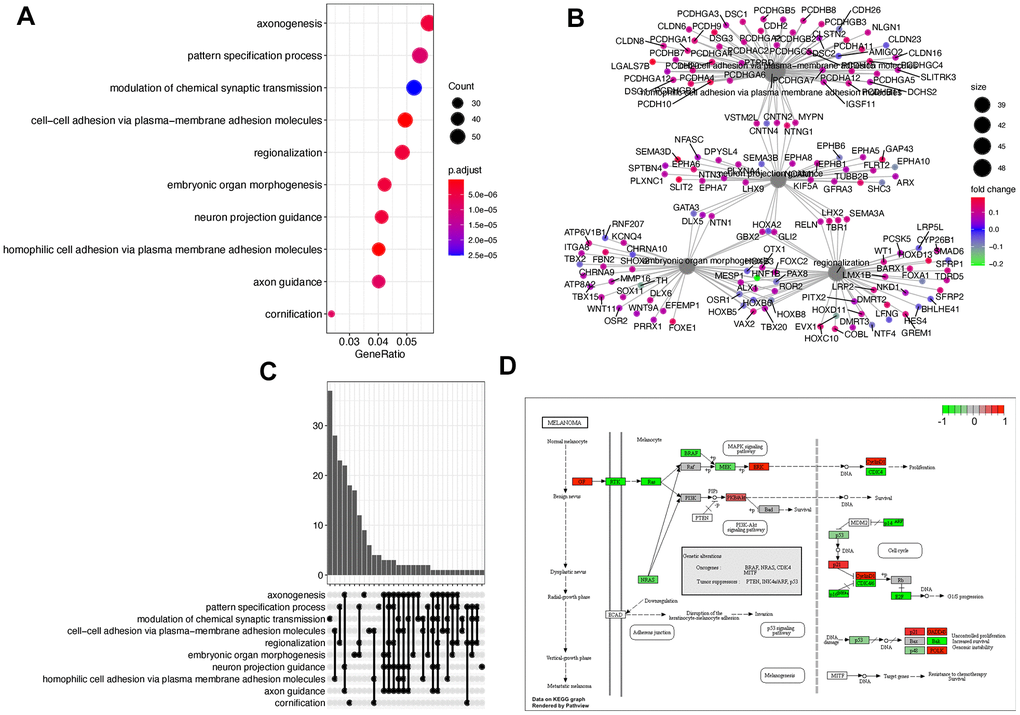
Figure 2. Function enrichment using DEGs. (A) The dotplot of the top 10 enriched gene ontology biological process terms. (B) The regulatory relationships between genes and corresponding functions. (C) The upset graph is showing the number of overlapped genes among functions. (D) The most significant KEGG pathway.
Recurrent SNVs from WES data
Large numbers of mutated genes do not express in the Bladder tissues. The significant number of SNVs is attributed to the gene length, for instance, TTN [32]. Therefore, the frequently mutated genes have little impact on the disease progression if they are not expressed. Given this hypothesis, we only investigated the SNVs from the differentially expressed genes. The most recurrently mutated genes were identified using the GATK across all patients. The frequency and patients harboring each mutated gene can be seen from Figure 3A.
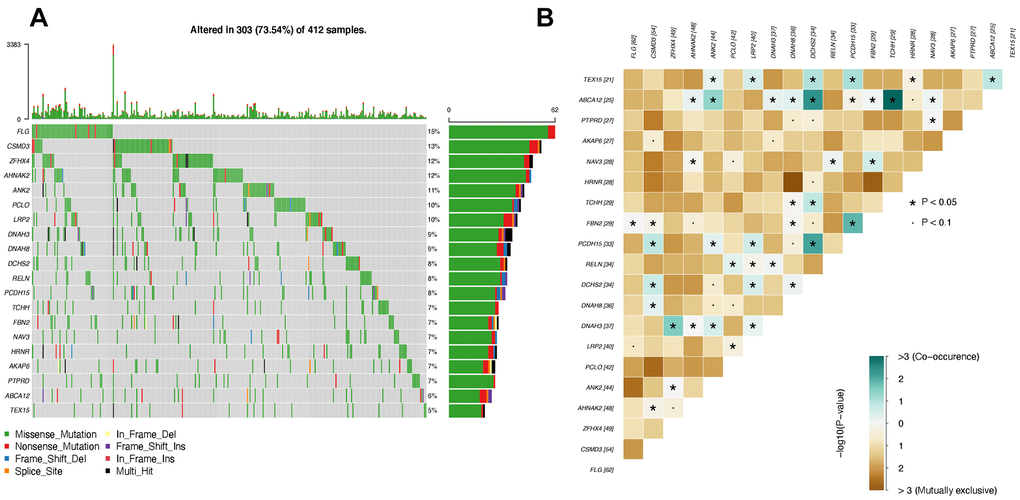
Figure 3. Top mutated genes that are also differentially expressed. (A) Oncoplot of top mutated genes. Each row indicates one gene, and each column represents one patient. (B) Interactions between mutated genes. The co-occurrence and mutually exclusive interactions are marked in blue and yellow, respectively.
As seen in Figure 3A, the top 20 differentially expressed genes with the highest mutational frequency can be observed in at least 5% of patients, in which the highest frequency is 7%. Interestingly, the most well-known cancer suppressor gene, TP53 [33], is absent in our top 20 gene list, which has a mutational frequency of 88% in bladder cancer patients. The reason is TP53 is not differentially expressed in progressive bladder cancer patients despite a high mutational frequency. In contrast, the genes in our list were recurrently mutated in bladder cancer patients and presented significant differences as the tumor progressed (Table 1).
Table 1. Limma result of the top 25 genes.
| gene | logFC | P value | direction | mean_response | mean_progressive | ||||||||||||||||||||||||||||||||||||||||||||||||||||||||||||||||||||||||||||||||||||||||||||||
| TCHH | 0.170 | 0.000 | up-regulate | 0.668 | 0.838 | ||||||||||||||||||||||||||||||||||||||||||||||||||||||||||||||||||||||||||||||||||||||||||||||
| FBN2 | 0.139 | 0.000 | up-regulate | 1.066 | 1.205 | ||||||||||||||||||||||||||||||||||||||||||||||||||||||||||||||||||||||||||||||||||||||||||||||
| ANK2 | 0.124 | 0.000 | up-regulate | 0.842 | 0.966 | ||||||||||||||||||||||||||||||||||||||||||||||||||||||||||||||||||||||||||||||||||||||||||||||
| DNAH3 | 0.091 | 0.000 | up-regulate | 0.745 | 0.836 | ||||||||||||||||||||||||||||||||||||||||||||||||||||||||||||||||||||||||||||||||||||||||||||||
| CSMD3 | 0.126 | 0.001 | up-regulate | 0.249 | 0.375 | ||||||||||||||||||||||||||||||||||||||||||||||||||||||||||||||||||||||||||||||||||||||||||||||
| AKAP6 | 0.081 | 0.001 | up-regulate | 0.855 | 0.936 | ||||||||||||||||||||||||||||||||||||||||||||||||||||||||||||||||||||||||||||||||||||||||||||||
| TEX15 | 0.141 | 0.001 | up-regulate | 0.289 | 0.43 | ||||||||||||||||||||||||||||||||||||||||||||||||||||||||||||||||||||||||||||||||||||||||||||||
| LRP2 | 0.115 | 0.002 | up-regulate | 0.483 | 0.598 | ||||||||||||||||||||||||||||||||||||||||||||||||||||||||||||||||||||||||||||||||||||||||||||||
| ZFHX4 | 0.101 | 0.002 | up-regulate | 0.912 | 1.013 | ||||||||||||||||||||||||||||||||||||||||||||||||||||||||||||||||||||||||||||||||||||||||||||||
| PCDH15 | 0.095 | 0.003 | up-regulate | 0.209 | 0.304 | ||||||||||||||||||||||||||||||||||||||||||||||||||||||||||||||||||||||||||||||||||||||||||||||
| FLG | 0.123 | 0.003 | up-regulate | 0.596 | 0.719 | ||||||||||||||||||||||||||||||||||||||||||||||||||||||||||||||||||||||||||||||||||||||||||||||
| NAV3 | 0.090 | 0.004 | up-regulate | 0.728 | 0.818 | ||||||||||||||||||||||||||||||||||||||||||||||||||||||||||||||||||||||||||||||||||||||||||||||
| PCLO | 0.092 | 0.006 | up-regulate | 0.963 | 1.056 | ||||||||||||||||||||||||||||||||||||||||||||||||||||||||||||||||||||||||||||||||||||||||||||||
| HRNR | 0.079 | 0.014 | up-regulate | 0.59 | 0.669 | ||||||||||||||||||||||||||||||||||||||||||||||||||||||||||||||||||||||||||||||||||||||||||||||
| ABCA12 | 0.098 | 0.014 | up-regulate | 0.899 | 0.997 | ||||||||||||||||||||||||||||||||||||||||||||||||||||||||||||||||||||||||||||||||||||||||||||||
| DCHS2 | 0.079 | 0.018 | up-regulate | 0.411 | 0.49 | ||||||||||||||||||||||||||||||||||||||||||||||||||||||||||||||||||||||||||||||||||||||||||||||
| AHNAK2 | 0.069 | 0.019 | up-regulate | 1.256 | 1.325 | ||||||||||||||||||||||||||||||||||||||||||||||||||||||||||||||||||||||||||||||||||||||||||||||
| DNAH8 | -0.070 | 0.020 | downregulate | 0.265 | 0.195 | ||||||||||||||||||||||||||||||||||||||||||||||||||||||||||||||||||||||||||||||||||||||||||||||
| PTPRD | 0.086 | 0.021 | up-regulate | 0.748 | 0.833 | ||||||||||||||||||||||||||||||||||||||||||||||||||||||||||||||||||||||||||||||||||||||||||||||
| RELN | 0.085 | 0.031 | up-regulate | 0.429 | 0.514 | ||||||||||||||||||||||||||||||||||||||||||||||||||||||||||||||||||||||||||||||||||||||||||||||
| The table shows the top 25 DEGs sorted by P values. The P values and logFC are calculated by Limma algorithm. Genes overexpressed in progressive group patients are up-regulated genes. | |||||||||||||||||||||||||||||||||||||||||||||||||||||||||||||||||||||||||||||||||||||||||||||||||||
To further investigate the internal relationship between the most mutated genes, we applied the maftools [34] to estimate the interactions between genes. There are two types of interactions between genes that are the co-occurrence and mutually exclusive relationship. Co-occurrence interaction indicates that two genes tend to be mutated simultaneously [35]. The mutually exclusive interaction suggests that two genes are barely observed to be mutated simultaneously [36]. It's worth mentioning that mutually exclusive interaction does not mean two genes could not be mutated simultaneously. Instead, it means the cells carrying both of the two mutated genes tend to trigger the apoptosis program and turn out to die. This phenomenon is called synthetic lethality [37], which is a significant avenue of cancer therapy.
As seen in Figure 3B, there are many mutually exclusive gene pairs whose P values are less than 0.1, marked as dots. The predominant interaction among the top 20 genes is co-occurrence. The gene pairs with co-occurrence relationships are marked with stars, suggesting significant P values less than 0.05.
Novel events identified by DEkupl
Since we also applied a mapping-free protocol, we could capture novel events unsolvable to the mapping-based methods. DEkupl captured all the k-mers absent in the human reference and then merged the k-mers into contigs. These contigs were therefore considered to be the context of local events. We eventually identified contigs composed of 139 SNVs, 412 intron events, 6 repeats, and 24 unmapped events. As DEkupl masked all the k-mers present in the reference, these contigs extended from the retained k-mers can be considered novel events. The detailed results can be seen from the Supplementary Table 1. All these novel events present significant differences between the two groups (Figure 4A).
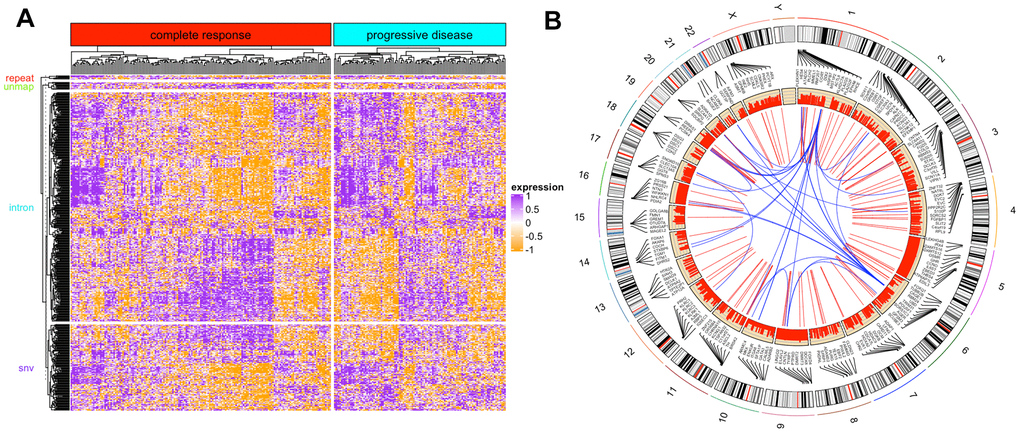
Figure 4. DEkupl contigs results. (A) The heatmap of novel events identified by DEkupl using RNAseq data. (B) The circus graph of SNVs identified by DEkupl using the WES data.
In Figure 4A, most of the novel contigs were highly expressed in the progressive group. Meanwhile, we observed that some complete remission patients exhibit similar expression patterns as the progressive patients. It suggests that patients sensitive to therapy at the initial phase might carry a risk of relapse in the following phases.
Candidates SNVs screening
Besides the shared DEGs, we also screened the SNVs detected by both of the two protocols from WES data as convincing SNVs. The contigs generated by DEkupl were mapped to the human genome using GSNAP software. Then the genomic coordinates were compared with the GATK results. Finally, we obtained 450 convincing SNVs belonging to the DECs (Figure 4B). Figure 4B shows the locations of SNVs and the correlation between the host genes. Some SNVs are found to locate at closed loci forming a local cluster. And genes from the same chromosome tend to present a positive correlation. In contrast, genes from distant genomic loci tend to have a negative correlation.
Prognosis related indicators
Since the SNVs whose host genes belong to the DEGs were considered potential indicators, we intended to extract prognosis related indicators from the whole DEGs list. We initially used the log-rank test to estimate each gene. The patients were divided into two groups according to the median expression value of the queried gene. Then the log-rank test P value was computed. After ranking the genes P values in ascending order, we selected the top 6 genes and drew the KM curves, as shown in Figure 5.
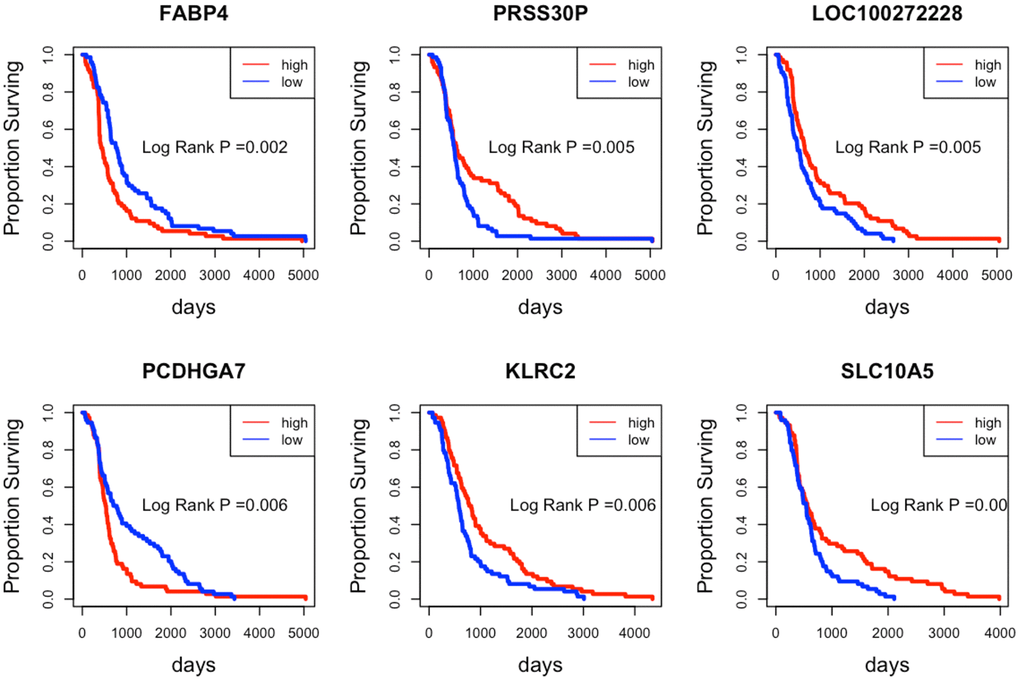
Figure 5. Kaplan-Meier curves of the top 6 prognostic indicator genes. The patients with high/low expression levels are marked in red and blue, respectively.
As seen from Figure 5, patients with different expression levels of the six genes tend to present various surviving time. The high expression levels of the gene FABP4 and PCDHGA7 always imply a poor surviving prognosis. In contrast, the low expression levels of the gene PRSS30P, LOC100272228, KLRC2, and SLC10A5 indicate a poor surviving prognosis.
We also applied the coxPh, a multivariable regression method, to select prognostic indicators from the DEGs. The top 20 genes can be seen in Table 2.
Table 2. CoxPh results.
| beta | HR (95% CI for HR) | Wald test | P value | ||||||||||||||||||||||||||||||||||||||||||||||||||||||||||||||||||||||||||||||||||||||||||||||||
| APOBEC3G | -2.5 | 0.081 (0.022-0.29) | 15 | 0.00011 | |||||||||||||||||||||||||||||||||||||||||||||||||||||||||||||||||||||||||||||||||||||||||||||||
| DENND2D | -4.5 | 0.011 (0.0012-0.11) | 15 | 0.00011 | |||||||||||||||||||||||||||||||||||||||||||||||||||||||||||||||||||||||||||||||||||||||||||||||
| SEMA3A | 2.1 | 7.9 (2.8-23) | 15 | 0.00011 | |||||||||||||||||||||||||||||||||||||||||||||||||||||||||||||||||||||||||||||||||||||||||||||||
| CCL15 | -0.86 | 0.42 (0.27-0.66) | 15 | 0.00012 | |||||||||||||||||||||||||||||||||||||||||||||||||||||||||||||||||||||||||||||||||||||||||||||||
| COLQ | -2.3 | 0.1 (0.031-0.32) | 15 | 0.00012 | |||||||||||||||||||||||||||||||||||||||||||||||||||||||||||||||||||||||||||||||||||||||||||||||
| PCDHGA2 | 2 | 7.5 (2.7-21) | 15 | 0.00012 | |||||||||||||||||||||||||||||||||||||||||||||||||||||||||||||||||||||||||||||||||||||||||||||||
| PLIN5 | -1.2 | 0.31 (0.17-0.56) | 15 | 0.00013 | |||||||||||||||||||||||||||||||||||||||||||||||||||||||||||||||||||||||||||||||||||||||||||||||
| SLC26A8 | -2.1 | 0.12 (0.043-0.36) | 15 | 0.00013 | |||||||||||||||||||||||||||||||||||||||||||||||||||||||||||||||||||||||||||||||||||||||||||||||
| TXK | -1.5 | 0.23 (0.11-0.49) | 15 | 0.00013 | |||||||||||||||||||||||||||||||||||||||||||||||||||||||||||||||||||||||||||||||||||||||||||||||
| AGER | -3 | 0.049 (0.011-0.23) | 15 | 0.00014 | |||||||||||||||||||||||||||||||||||||||||||||||||||||||||||||||||||||||||||||||||||||||||||||||
| AHNAK2 | 1.9 | 6.8 (2.5-18) | 15 | 0.00014 | |||||||||||||||||||||||||||||||||||||||||||||||||||||||||||||||||||||||||||||||||||||||||||||||
| NAT8B | -1.3 | 0.26 (0.13-0.52) | 15 | 0.00014 | |||||||||||||||||||||||||||||||||||||||||||||||||||||||||||||||||||||||||||||||||||||||||||||||
| FOXD4 | -1.9 | 0.14 (0.052-0.39) | 14 | 0.00015 | |||||||||||||||||||||||||||||||||||||||||||||||||||||||||||||||||||||||||||||||||||||||||||||||
| PCDHGA1 | 2.1 | 7.8 (2.7-23) | 14 | 0.00015 | |||||||||||||||||||||||||||||||||||||||||||||||||||||||||||||||||||||||||||||||||||||||||||||||
| TMIGD2 | -1.5 | 0.22 (0.1-0.48) | 14 | 0.00015 | |||||||||||||||||||||||||||||||||||||||||||||||||||||||||||||||||||||||||||||||||||||||||||||||
| ACCN2 | 2.2 | 9.1 (2.9-29) | 14 | 0.00016 | |||||||||||||||||||||||||||||||||||||||||||||||||||||||||||||||||||||||||||||||||||||||||||||||
| SPRR2E | 0.72 | 2.1 (1.4-3) | 14 | 0.00016 | |||||||||||||||||||||||||||||||||||||||||||||||||||||||||||||||||||||||||||||||||||||||||||||||
| CD96 | -1.7 | 0.19 (0.078-0.45) | 14 | 0.00017 | |||||||||||||||||||||||||||||||||||||||||||||||||||||||||||||||||||||||||||||||||||||||||||||||
| WNT11 | 1.3 | 3.8 (1.9-7.6) | 14 | 0.00017 | |||||||||||||||||||||||||||||||||||||||||||||||||||||||||||||||||||||||||||||||||||||||||||||||
| AMY2B | -2.1 | 0.12 (0.042-0.37) | 14 | 0.00018 | |||||||||||||||||||||||||||||||||||||||||||||||||||||||||||||||||||||||||||||||||||||||||||||||
| The P value was calculated by log-rank test. The HR stands for hazard ratios. | |||||||||||||||||||||||||||||||||||||||||||||||||||||||||||||||||||||||||||||||||||||||||||||||||||
| Top 20 genes sorted by P value were shown in the first column. | |||||||||||||||||||||||||||||||||||||||||||||||||||||||||||||||||||||||||||||||||||||||||||||||||||
The top indicator lists in the coxPh and log-rank test are not the same. This is because coxPh considers the internal interactions among genes, while the log-rank test treats each gene independently. However, among the 1240 DEGs, 4 of the top 6 genes detected by the log-rank test rank in the top25%. The ranks of PRSS30P, LOC100272228, PCDHGA7, and SLC10A5 are 79, 124, 310, and 43, respectively.
Survival analysis using the contigs of novel events
Besides DEGs, we also captured some novel events from the RNAseq data. These novel events were composed of SNVs, intron, splice, repeat, and unmapped contigs. It's worth mentioning that the unmapped contigs may come from transcripts produced by rearranged genes or result from exogenous viral genomes and could thus be highly relevant biologically. We therefore investigated the correlation between surviving time and the novel events, including unmapped contigs.
We compared the expression of contigs corresponding to the novel events, as shown in Figure 6A. The violin graph indicates the transcriptional difference between the early and late-stage patients. Survival analysis also proves the correlation between these novel events and survival prognosis. Interestingly, we showed the top 6 most significant contigs in Figure 6B. All the patients with high expressions of these 6 contigs tend to have a worse prognosis than the others. Our findings imply that the overexpression of these unannotated events may promote cancer progression.
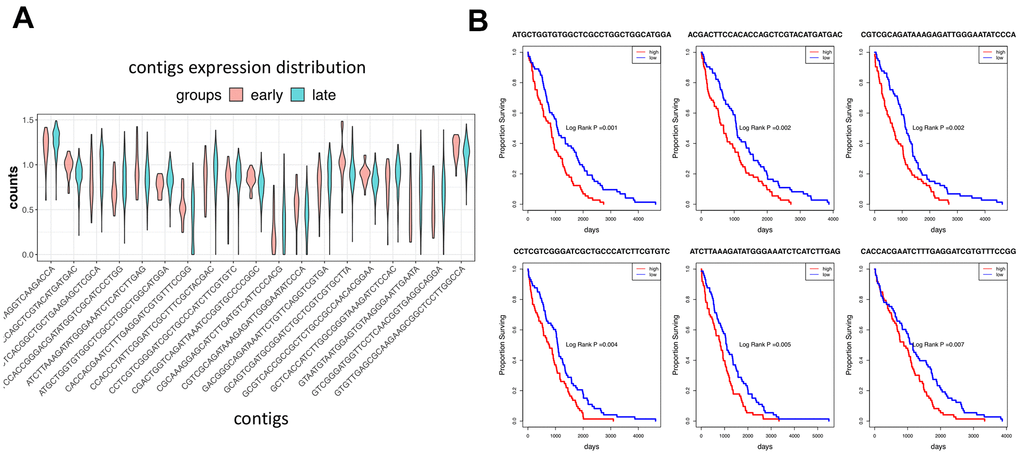
Figure 6. Expression of contigs in different cancer groups. (A) The violin graph shows the expression of the top 20 contigs of novel events in the early and late-stage patients. (B) Survival analysis shows the top 6 most significant contigs.
Diagnostic model construction
To screen the diagnostic signatures, we herein applied a machine learning feature selection algorithm called lasso regression. We combined all the DEGs and convincing SNVs as features. Lasso regression determined the best combination of features according to the Log gamma criteria.
In Figure 7A, 17 signatures were selected by lasso regression via the cutoff of log gamma. The best log gamma cutoff was determined automatically by lasso regression. The coefficient of each signature can be seen in the Figure 7B. Positive and negative signatures were marked in blue and red, respectively. Finally, the SVM model was trained using the 17 signatures, and the AUC was 90% on the test set (Figure 8A). Our results demonstrate that the signatures in our findings can distinguish progressive patients from responsive patients. Many of the 17 genes are already verified by previous studies to be cancer related. Thorsen K found that ACSL5 shows tumor-specific alternative TSS usage in cancer samples [38]. The gene of ACSS3 is proved to promote BLCA cell growth [39]. ART3 and ASAH2B are two well-known cancer driver genes, especially in breast cancer patients [40–43]. AZGP1 is involved in colorectal cancer and androgen receptor-induced prostate cancer [44, 45]. DENND2D, PCDHB7, FAM113B, and GBX2 have prognostic impact on various cancers, including lung cancer, gastric cancer, ovarian and esophageal cancer [46–50]. TLR4 and NR1H3 are the prognostic factors of bladder cancer patients [51–53].
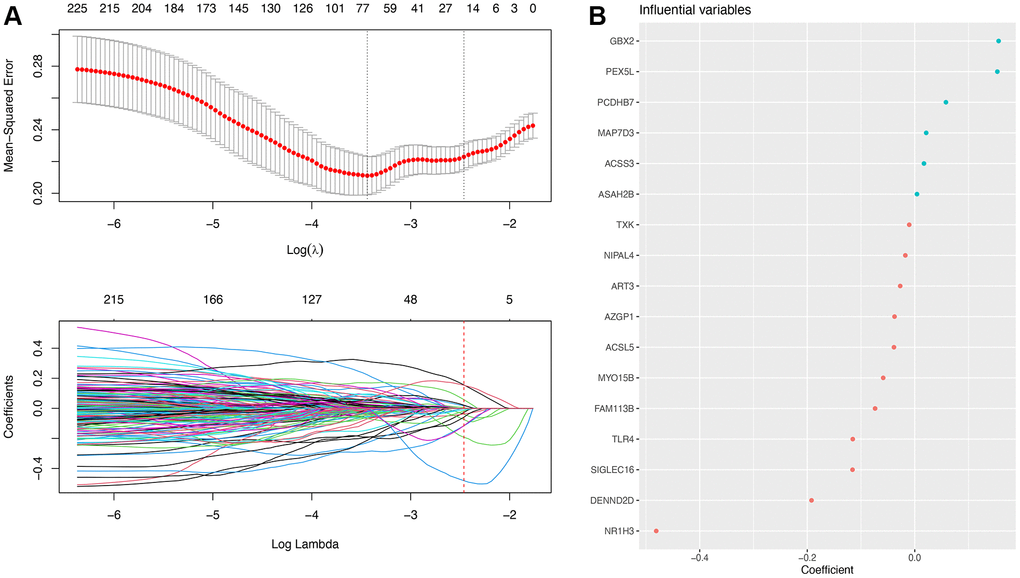
Figure 7. Machine learning results. (A) Feature selection process performed by lasso regression. (B) Feature importance ranking according to the coefficient.
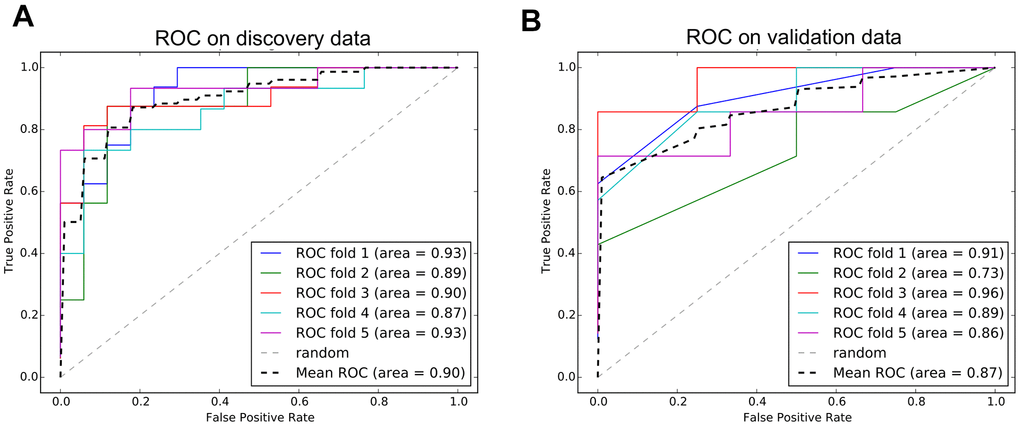
Figure 8. ROC curves of diagnostic model. (A) The performance of model on discovery data from TCGA. (B) The performance of model on validation data from GEO.
Validation and comparison
We trained a diagnostic model using the signatures and proved the performance of predicting progressive bladder cancer patients. To further investigate if our model can also predict bladder cancer patients from the normal samples, we applied another independent data from the GEO database. The validation data comprises 52 bladder cancer patients and 40 normal samples. The ROC curve on the validation data is shown in Figure 8B. The accuracy of predicting bladder cancer patients is 0.87, which is slightly lower than the discovery data.
We also compared our 17-signatures model to the other models published previously. The first model is an immune prognostic model (IPM) developed by Hongyan Li [54]. The IPM is based on immune-associated genes derived from differential analysis between wild-type TP53 and mutated TP53 bladder cancer patients. The IPM was validated using an independent cohort from the GEO database. IPM utilizes the expression of four essential genes (CTSG, TREML4, KRT1, and PPBP) to calculate the risk score for each patient. The other model we compared to is an autophagy prognostic model (APM) developed by WANG et al. [55]. The APM was constructed with autophagy-related genes (ARGs). The author screened three key prognostic ARGs (JUN, MYC, and ITGA3) to calculate each patient's risk score. The APM was validated by two GEO datasets (GSE13507 and GSE31684). The comparison between our model and the other two models is shown in Figure 9.
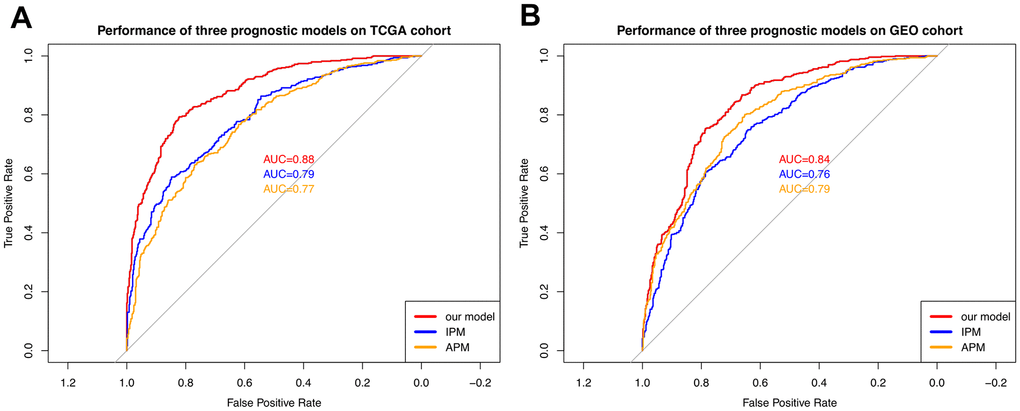
Figure 9. Comparison with the other two models. (A) The performance comparison among three models on the TCGA cohort. (B) The performance comparison among three models on the GEO cohort. The curves with different colors represent the ROC curves of different models.
As shown in Figure 9, our 17-signature model outperforms the other two models in both TCGA and GEO cohort. APM and IPM apply four and three essential genes as signatures, respectively. From this point, our 17-signature model takes more genes into account and thus achieves better performance expectedly. On the other hand, APM and IPM focus on either immune related genes or autophagy related genes. In contrast, we considered the whole transcriptome and exome. In addition to biological interpretation, our model also has an advantage in terms of accuracy.
Discussion
Recurrent variations are valuable tools in cancer diagnosis and treatment. Within this scope, sequencing technology has revealed the universality and diversity of the human transcriptome and genome. However, there are a large number of false positives in these cancer-related genes. For example, TTN, a high-frequency mutation gene detected in many cancers, but TTN is also one of the longest genes known to humans. Thus, it has a higher probability of accumulating more mutations.
On the other hand, many cancer mutations are found in some implausible genes (such as those encoding olfactory receptors and the muscle protein titin). However, many genes that carry mutations are not expressed in cancer tissues. Therefore, we combined the RNAseq and WES data to screen out genes with high-frequency mutations from genes significantly differentially expressed in Bladder cancer patients.
We first compared responsive patients to the progressive patients and screened out 727 up-regulated and 513 down-regulated genes. These DEGs were concentrated in the calcium ion homeostasis-related functions. The endometrial cancer KEGG pathway was also enriched. The calcium ion homeostasis is widely proved to be a cancer promoter.
Highly mutated genes were selected from the DEGs. These genes present diverse expression levels between the responsive and progressive bladder cancer patients. On the other hand, these genes harbor recurrent mutations in at least 5% of patients. Thus, we avoided the false positive genes that are either non-differentially expressed or have nothing to do with cancer progression. To further investigate these mutated genes' internal relationships, we drew a heatmap showing the co-occurrence and mutually exclusive relationship. We observed some significant co-occurrence gene pairs, like ABCA12 and DCHS2, ABCA12 and TCHH, PCDH15 and DCHS2. These genes tend to be mutated in the same patients. Meanwhile, we found the gene pairs with mutually exclusive relationships, indicating the potential synthetic lethality candidates. This kind of gene pairs are barely observed to be mutated simultaneously. Therefore, for tumor cells with one of the mutated genes in a synthetic lethality pair, the other gene can be considered a potential therapeutic target. Tumor cells can be killed by blocking the other gene using inhibitors, which mimics the condition of two genes mutated together.
Besides, the canonical sequencing analysis protocol relies on comparison with reference sequences to detect mutations. This method is highly dependent on the accuracy and completeness of the reference sequence. At the same time, it cannot do anything about mutations out of the reference sequence. However, many cancer-related mutations are hidden in these “dark genome”. In-depth exploration of these unmappable regions is essential to complement the current human understanding of cancer. Therefore, in this study, we also used a mapping-free method called Dekupl. On the one hand, the two mapping-based and mapping-free protocols validate each other to screen out variants with higher confidence. We have unearthed many contigs related to cancer prognosis, including unmapped contigs. These contigs cannot be mapped to human reference sequences by software such as BWA or STAR, but they present significant differences in cancer patients with diverse responses to therapies. Besides, combined with survival analysis, we found that these contigs are also significantly related to survival prognosis.
The novel events identified by DEkupl include SNVs, repeat, splice, intron, and unmapped contigs. Except for the repeat and unmapped contigs, all the other contigs can be mapped to the genome. In this way, we obtained the convincing SNVs comparing with the mapping-based approach. For the 24 unmapped contigs, they were only captured by DEkupl. Even though the source of these unmapped contigs is still not clear, these contigs were recurrently observed in multiple patients. Therefore, to some extent, these novel events complete the puzzle of cancer mechanisms, and the novel events can be used as alternative indicators for diagnosis and prognosis.
We constructed a diagnostic model using 17 signatures and the achieved satisfactory performance of predicting progressive bladder cancer patients on discovery data and validation data. It implies our diagnostic model's clinical implication in terms of early diagnosis and response prediction to therapy.
In addition to clinical value, the newly discovered sources of embedded DE-kupl contigs are also crucial, especially unmappable contigs. These contigs may be derived from exogenous RNA and DNA or viral sequences embedded in the human genome.
Supplementary Materials
Acknowledgments
X.R. and L.W. contributed to the conception of the study, performed data analysis, and wrote the manuscript. X.R. and JQ.Z. collaborated with data analysis and interpretation.
Conflicts of Interest
The authors declare that they have no conflicts of interest.
Funding
The present study was supported by the Youth Fund of Natural Science Foundation of Hainan Province (Grant No. 819QN357); and Hwa Mei Scientific Research Fund (grant no. 2020HMKY17).
References
- 1. Kojima T, Kawai K, Miyazaki J, Nishiyama H. Biomarkers for precision medicine in bladder cancer. Int J Clin Oncol. 2017; 22:207–13. https://doi.org/10.1007/s10147-016-1068-8 [PubMed]
- 2. Smith B, Agarwal P, Bhowmick NA. MicroRNA applications for prostate, ovarian and breast cancer in the era of precision medicine. Endocr Relat Cancer. 2017; 24:R157–72. https://doi.org/10.1530/ERC-16-0525 [PubMed]
- 3. Fehrmann RS, Li XY, van der Zee AG, de Jong S, Te Meerman GJ, de Vries EG, Crijns AP. Profiling studies in ovarian cancer: a review. Oncologist. 2007; 12:960–66. https://doi.org/10.1634/theoncologist.12-8-960 [PubMed]
- 4. Lee JY, Kim HS, Suh DH, Kim MK, Chung HH, Song YS. Ovarian cancer biomarker discovery based on genomic approaches. J Cancer Prev. 2013; 18:298–312. https://doi.org/10.15430/jcp.2013.18.4.298 [PubMed]
- 5. Marigorta UM, Rodríguez JA, Gibson G, Navarro A. Replicability and Prediction: Lessons and Challenges from GWAS. Trends Genet. 2018; 34:504–17. https://doi.org/10.1016/j.tig.2018.03.005 [PubMed]
- 6. Breschi A, Gingeras TR, Guigó R. Comparative transcriptomics in human and mouse. Nat Rev Genet. 2017; 18:425–40. https://doi.org/10.1038/nrg.2017.19 [PubMed]
- 7. Oprea TI. Exploring the dark genome: implications for precision medicine. Mamm Genome. 2019; 30:192–200. https://doi.org/10.1007/s00335-019-09809-0 [PubMed]
- 8. Li Z, Chen Y, Mu D, Yuan J, Shi Y, Zhang H, Gan J, Li N, Hu X, Liu B, Yang B, Fan W. Comparison of the two major classes of assembly algorithms: overlap-layout-consensus and de-bruijn-graph. Brief Funct Genomics. 2012; 11:25–37. https://doi.org/10.1093/bfgp/elr035 [PubMed]
- 9. Audoux J, Philippe N, Chikhi R, Salson M, Gallopin M, Gabriel M, Le Coz J, Drouineau E, Commes T, Gautheret D. DE-kupl: exhaustive capture of biological variation in RNA-seq data through k-mer decomposition. Genome Biol. 2017; 18:243. https://doi.org/10.1186/s13059-017-1372-2 [PubMed]
- 10. Love MI, Huber W, Anders S. Moderated estimation of fold change and dispersion for RNA-seq data with DESeq2. Genome Biol. 2014; 15:550. https://doi.org/10.1186/s13059-014-0550-8 [PubMed]
- 11. da Silveira WA, Hazard ES, Chung D, Hardiman G. Molecular Profiling of RNA Tumors Using High-Throughput RNA Sequencing: From Raw Data to Systems Level Analyses. Methods Mol Biol. 2019; 1908:185–204. https://doi.org/10.1007/978-1-4939-9004-7_13 [PubMed]
- 12. Tomczak K, Czerwińska P, Wiznerowicz M. The Cancer Genome Atlas (TCGA): an immeasurable source of knowledge. Contemp Oncol (Pozn). 2015; 19:A68–77. https://doi.org/10.5114/wo.2014.47136 [PubMed]
- 13. Chen C, Khaleel SS, Huang H, Wu CH. Software for pre-processing Illumina next-generation sequencing short read sequences. Source Code Biol Med. 2014; 9:8. https://doi.org/10.1186/1751-0473-9-8 [PubMed]
- 14. Frankish A, Diekhans M, Ferreira AM, Johnson R, Jungreis I, Loveland J, Mudge JM, Sisu C, Wright J, Armstrong J, Barnes I, Berry A, Bignell A, et al. GENCODE reference annotation for the human and mouse genomes. Nucleic Acids Res. 2019; 47:D766–73. https://doi.org/10.1093/nar/gky955 [PubMed]
- 15. Dobin A, Davis CA, Schlesinger F, Drenkow J, Zaleski C, Jha S, Batut P, Chaisson M, Gingeras TR. STAR: ultrafast universal RNA-seq aligner. Bioinformatics. 2013; 29:15–21. https://doi.org/10.1093/bioinformatics/bts635 [PubMed]
- 16. Houtgast EJ, Sima VM, Bertels K, Al-Ars Z. Hardware acceleration of BWA-MEM genomic short read mapping for longer read lengths. Comput Biol Chem. 2018; 75:54–64. https://doi.org/10.1016/j.compbiolchem.2018.03.024 [PubMed]
- 17. Trapnell C, Roberts A, Goff L, Pertea G, Kim D, Kelley DR, Pimentel H, Salzberg SL, Rinn JL, Pachter L. Differential gene and transcript expression analysis of RNA-seq experiments with TopHat and Cufflinks. Nat Protoc. 2012; 7:562–78. https://doi.org/10.1038/nprot.2012.016 [PubMed]
- 18. Trapnell C, Williams BA, Pertea G, Mortazavi A, Kwan G, van Baren MJ, Salzberg SL, Wold BJ, Pachter L. Transcript assembly and quantification by RNA-Seq reveals unannotated transcripts and isoform switching during cell differentiation. Nat Biotechnol. 2010; 28:511–15. https://doi.org/10.1038/nbt.1621 [PubMed]
- 19. do Valle ÍF, Giampieri E, Simonetti G, Padella A, Manfrini M, Ferrari A, Papayannidis C, Zironi I, Garonzi M, Bernardi S, Delledonne M, Martinelli G, Remondini D, Castellani G. Optimized pipeline of MuTect and GATK tools to improve the detection of somatic single nucleotide polymorphisms in whole-exome sequencing data. BMC Bioinformatics. 2016 (Suppl 12); 17:341. https://doi.org/10.1186/s12859-016-1190-7 [PubMed]
- 20. Du Y, Huang Q, Arisdakessian C, Garmire LX. Evaluation of STAR and Kallisto on Single Cell RNA-Seq Data Alignment. G3 (Bethesda). 2020; 10:1775–83. https://doi.org/10.1534/g3.120.401160 [PubMed]
- 21. Wu TD, Reeder J, Lawrence M, Becker G, Brauer MJ. GMAP and GSNAP for Genomic Sequence Alignment: Enhancements to Speed, Accuracy, and Functionality. Methods Mol Biol. 2016; 1418:283–334. https://doi.org/10.1007/978-1-4939-3578-9_15 [PubMed]
- 22. Kleinbaum DG, Klein M. Kaplan-Meier Survival Curves and the Log-Rank Test. In: Survival Analysis. Statistics for Biology and Health. Springer, New York, NY. 2012. https://doi.org/10.1007/978-1-4419-6646-9_2
- 23. Rich JT, Neely JG, Paniello RC, Voelker CC, Nussenbaum B, Wang EW. A practical guide to understanding Kaplan-Meier curves. Otolaryngol Head Neck Surg. 2010; 143:331–36. https://doi.org/10.1016/j.otohns.2010.05.007 [PubMed]
- 24. Fisher LD, Lin DY. Time-dependent covariates in the Cox proportional-hazards regression model. Annu Rev Public Health. 1999; 20:145–57. https://doi.org/10.1146/annurev.publhealth.20.1.145 [PubMed]
- 25. Hans C. Bayesian lasso regression. Biometrika. 2009; 96:835–45. https://doi.org/10.1093/biomet/asp047
- 26. Chang CC, Lin CJ. LIBSVM: A Library for support vector machines. ACM Trans Intell Syst Technol. 2011; 2:1–27. https://doi.org/10.1145/1961189.1961199
- 27. Astorino A, Fuduli A. The Proximal Trajectory Algorithm in SVM Cross Validation. IEEE Trans Neural Netw Learn Syst. 2016; 27:966–77. https://doi.org/10.1109/TNNLS.2015.2430935 [PubMed]
- 28. Hajian-Tilaki K. Receiver Operating Characteristic (ROC) Curve Analysis for Medical Diagnostic Test Evaluation. Caspian J Intern Med. 2013; 4:627–35. [PubMed]
- 29. Kiers HA, Van Mechelen I. Three-way component analysis: principles and illustrative application. Psychol Methods. 2001; 6:84–110. https://doi.org/10.1037/1082-989x.6.1.84 [PubMed]
- 30. Xing Z, Chu C, Chen L, Kong X. The use of Gene Ontology terms and KEGG pathways for analysis and prediction of oncogenes. Biochim Biophys Acta. 2016; 1860:2725–34. https://doi.org/10.1016/j.bbagen.2016.01.012 [PubMed]
- 31. Yu G, Wang LG, Han Y, He QY. clusterProfiler: an R package for comparing biological themes among gene clusters. OMICS. 2012; 16:284–87. https://doi.org/10.1089/omi.2011.0118 [PubMed]
- 32. Akle S, Chun S, Jordan DM, Cassa CA. Mitigating false-positive associations in rare disease gene discovery. Hum Mutat. 2015; 36:998–1003. https://doi.org/10.1002/humu.22847 [PubMed]
- 33. Barnoud T, Parris JL, Murphy ME. Common genetic variants in the TP53 pathway and their impact on cancer. J Mol Cell Biol. 2019; 11:578–85. https://doi.org/10.1093/jmcb/mjz052 [PubMed]
- 34. Mayakonda A, Lin DC, Assenov Y, Plass C, Koeffler HP. Maftools: efficient and comprehensive analysis of somatic variants in cancer. Genome Res. 2018; 28:1747–56. https://doi.org/10.1101/gr.239244.118 [PubMed]
- 35. Scheffler M, Ihle MA, Hein R, Merkelbach-Bruse S, Scheel AH, Siemanowski J, Brägelmann J, Kron A, Abedpour N, Ueckeroth F, Schüller M, Koleczko S, Michels S, et al. K-ras Mutation Subtypes in NSCLC and Associated Co-occuring Mutations in Other Oncogenic Pathways. J Thorac Oncol. 2019; 14:606–16. https://doi.org/10.1016/j.jtho.2018.12.013 [PubMed]
- 36. Cisowski J, Bergo MO. What makes oncogenes mutually exclusive? Small GTPases. 2017; 8:187–92. https://doi.org/10.1080/21541248.2016.1212689 [PubMed]
- 37. O’Neil NJ, Bailey ML, Hieter P. Synthetic lethality and cancer. Nat Rev Genet. 2017; 18:613–23. https://doi.org/10.1038/nrg.2017.47 [PubMed]
- 38. Thorsen K, Schepeler T, Øster B, Rasmussen MH, Vang S, Wang K, Hansen KQ, Lamy P, Pedersen JS, Eller A, Mansilla F, Laurila K, Wiuf C, et al. Tumor-specific usage of alternative transcription start sites in colorectal cancer identified by genome-wide exon array analysis. BMC Genomics. 2011; 12:505. https://doi.org/10.1186/1471-2164-12-505 [PubMed]
- 39. Zhang J, Duan H, Feng Z, Han X, Gu C. Acetyl-CoA synthetase 3 promotes bladder cancer cell growth under metabolic stress. Oncogenesis. 2020; 9:46. https://doi.org/10.1038/s41389-020-0230-3 [PubMed]
- 40. Zhong G, Lou W, Shen Q, Yu K, Zheng Y. Identification of key genes as potential biomarkers for triple-negative breast cancer using integrating genomics analysis. Mol Med Rep. 2020; 21:557–66. https://doi.org/10.3892/mmr.2019.10867 [PubMed]
- 41. Tan L, Song X, Sun X, Wang N, Qu Y, Sun Z. ART3 regulates triple-negative breast cancer cell function via activation of Akt and ERK pathways. Oncotarget. 2016; 7:46589–602. https://doi.org/10.18632/oncotarget.10306 [PubMed]
- 42. Reichl B, Niederstaetter L, Boegl T, Neuditschko B, Bileck A, Gojo J, Buchberger W, Peyrl A, Gerner C. Determination of a Tumor-Promoting Microenvironment in Recurrent Medulloblastoma: A Multi-Omics Study of Cerebrospinal Fluid. Cancers (Basel). 2020; 12:1350. https://doi.org/10.3390/cancers12061350 [PubMed]
- 43. Li J, Zhang J, Jin L, Deng H, Wu J. Silencing lnc-ASAH2B-2 Inhibits Breast Cancer Cell Growth via the mTOR Pathway. Anticancer Res. 2018; 38:3427–34. https://doi.org/10.21873/anticanres.12611 [PubMed]
- 44. Cao R, Ke M, Wu Q, Tian Q, Liu L, Dai Z, Lu S, Liu P. AZGP1 is androgen responsive and involved in AR-induced prostate cancer cell proliferation and metastasis. J Cell Physiol. 2019; 234:17444–58. https://doi.org/10.1002/jcp.28366 [PubMed]
- 45. Ding D, Han S, Zhang H, He Y, Li Y. Predictive biomarkers of colorectal cancer. Comput Biol Chem. 2019; 83:107106. https://doi.org/10.1016/j.compbiolchem.2019.107106 [PubMed]
- 46. Ling B, Zheng H, Fu G, Yuan J, Shi T, Chen S, Liu Y, Liu Y, Cao Y, Zheng S, Guo S, Han N, Gao Y, et al. Suppression of non-small cell lung cancer proliferation and tumorigenicity by DENND2D. Lung Cancer. 2013; 79:104–10. https://doi.org/10.1016/j.lungcan.2012.10.012 [PubMed]
- 47. Kanda M, Shimizu D, Nomoto S, Takami H, Hibino S, Oya H, Hashimoto R, Suenaga M, Inokawa Y, Kobayashi D, Tanaka C, Yamada S, Fujii T, et al. Prognostic impact of expression and methylation status of DENN/MADD domain-containing protein 2D in gastric cancer. Gastric Cancer. 2015; 18:288–96. https://doi.org/10.1007/s10120-014-0372-0 [PubMed]
- 48. Mutalip SS, Yunos NM, Abdul-Rahman PS, Jauri MH, Osman A, Adenan MI. Mechanisms of action of 17βH-neriifolin on its anticancer effect in SKOV-3 ovarian cancer cell line. Anticancer Res. 2014; 34:4141–51. [PubMed]
- 49. Hibino S, Kanda M, Oya H, Takami H, Shimizu D, Nomoto S, Hishida M, Niwa Y, Koike M, Yamada S, Nishikawa Y, Asai M, Nakayama G, et al. Reduced expression of DENND2D through promoter hypermethylation is an adverse prognostic factor in squamous cell carcinoma of the esophagus. Oncol Rep. 2014; 31:693–700. https://doi.org/10.3892/or.2013.2901 [PubMed]
- 50. Hong Y, Choi HM, Cheong HS, Shin HD, Choi CM, Kim WJ. Epigenome-Wide Association Analysis of Differentially Methylated Signals in Blood Samples of Patients with Non-Small-Cell Lung Cancer. J Clin Med. 2019; 8:1307. https://doi.org/10.3390/jcm8091307 [PubMed]
- 51. Wu J, Wan F, Sheng H, Shi G, Shen Y, Lin G, Dai B, Zhu Y, Ye D. NR1H3 Expression is a Prognostic Factor of Overall Survival for Patients with Muscle-Invasive Bladder Cancer. J Cancer. 2017; 8:852–60. https://doi.org/10.7150/jca.17845 [PubMed]
- 52. Bexten M, Oswald S, Grube M, Jia J, Graf T, Zimmermann U, Rodewald K, Zolk O, Schwantes U, Siegmund W, Keiser M. Expression of drug transporters and drug metabolizing enzymes in the bladder urothelium in man and affinity of the bladder spasmolytic trospium chloride to transporters likely involved in its pharmacokinetics. Mol Pharm. 2015; 12:171–78. https://doi.org/10.1021/mp500532x [PubMed]
- 53. Kusuhara Y, Daizumoto K, Kawai K, Hirayama K, Kowada M, Shintani T, Fukuhara Y, Dondoo TO, Ozaki K, Tsuda M, Fukawa T, Nakatsuji H, Bando Y, et al. Low Expression of Toll-like Receptor 4 Is Associated With Poor Prognosis in Bladder Cancer. Anticancer Res. 2019; 39:703–11. https://doi.org/10.21873/anticanres.13166 [PubMed]
- 54. Li H, Lu H, Cui W, Huang Y, Jin X. A TP53-based immune prognostic model for muscle-invasive bladder cancer. Aging (Albany NY). 2020; 13:1929–46. https://doi.org/10.18632/aging.202150 [PubMed]
- 55. Wang SS, Chen G, Li SH, Pang JS, Cai KT, Yan HB, Huang ZG, He RQ. Identification and validation of an individualized autophagy-clinical prognostic index in bladder cancer patients. Onco Targets Ther. 2019; 12:3695–712. https://doi.org/10.2147/OTT.S197676 [PubMed]