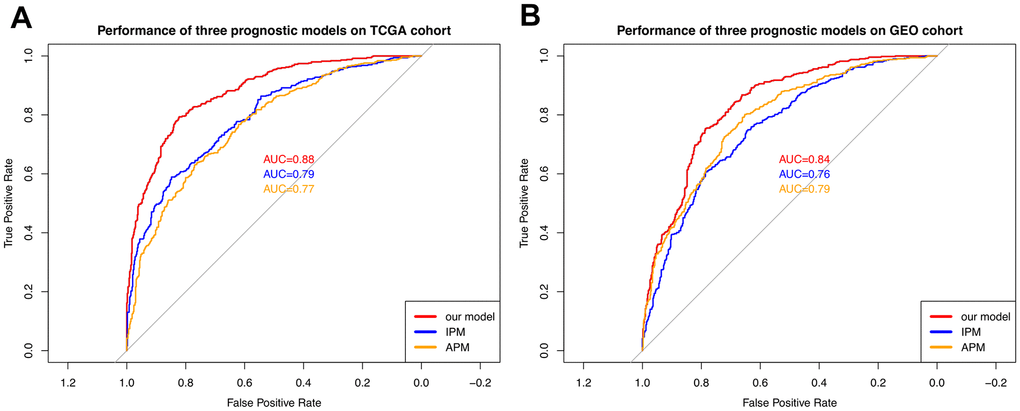
Figure 9.Comparison with the other two models. (A) The performance comparison among three models on the TCGA cohort. (B) The performance comparison among three models on the GEO cohort. The curves with different colors represent the ROC curves of different models.