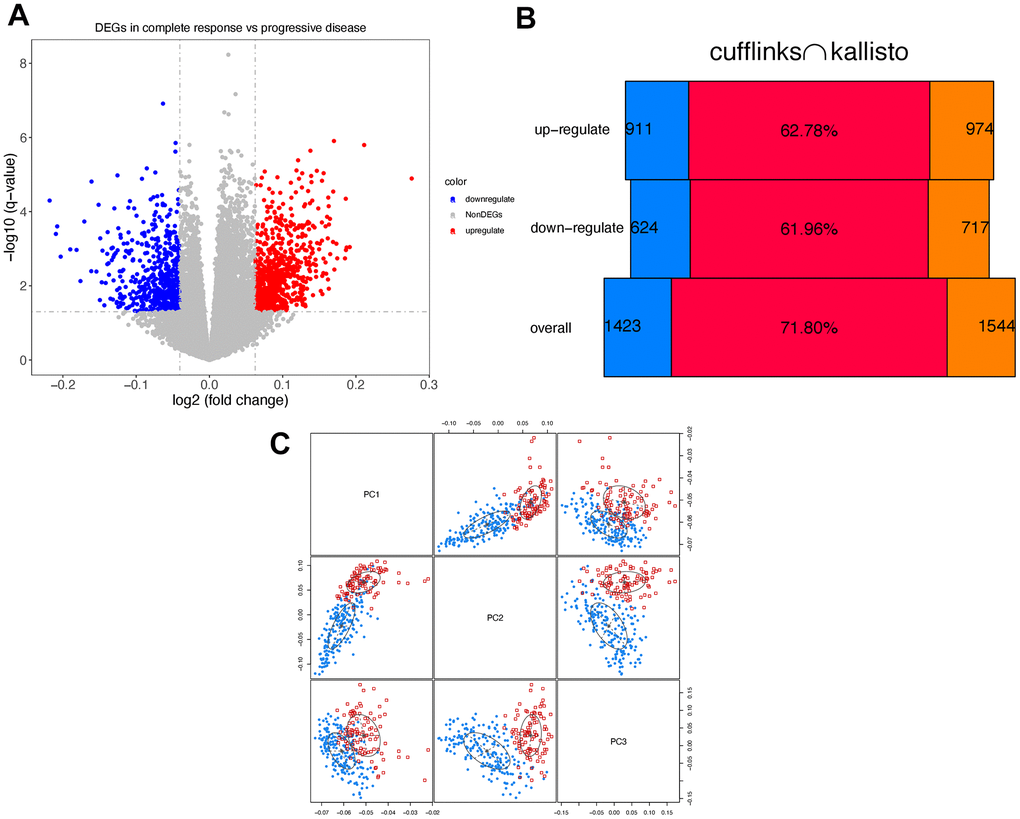
Figure 1.Differentially expressed genes. (A) Volcano graph of consistent DEGs using cufflinks and kallisto. Red/blue dots represent the up/down-regulated genes. (B) The results generated by cufflinks are marked in blue, and the results of kallisto are marked in orange. The red bars in the middle indicate the Jaccard index. (C) Principle component analysis. Response/progressive patients are marked in blue and red, respectively.