Submit an Article
Navigate
Home
Editorial Board
Editorial Policies
Current Volume
Archive
Scientific Integrity
Publication Ethics Statements
Interviews with Outstanding Authors
Newsroom
Sponsored Conferences
Podcast
Contact
Special Collections
Submit an Article
Online ISSN: 1945-4589
Research Paper
|
Volume 13
Exhaustive capture of bladder cancer transcriptional and genomic variants integrating canonical and mapping-free protocols
Back to article
Figure 5
(5 of 9)
−
100%
+
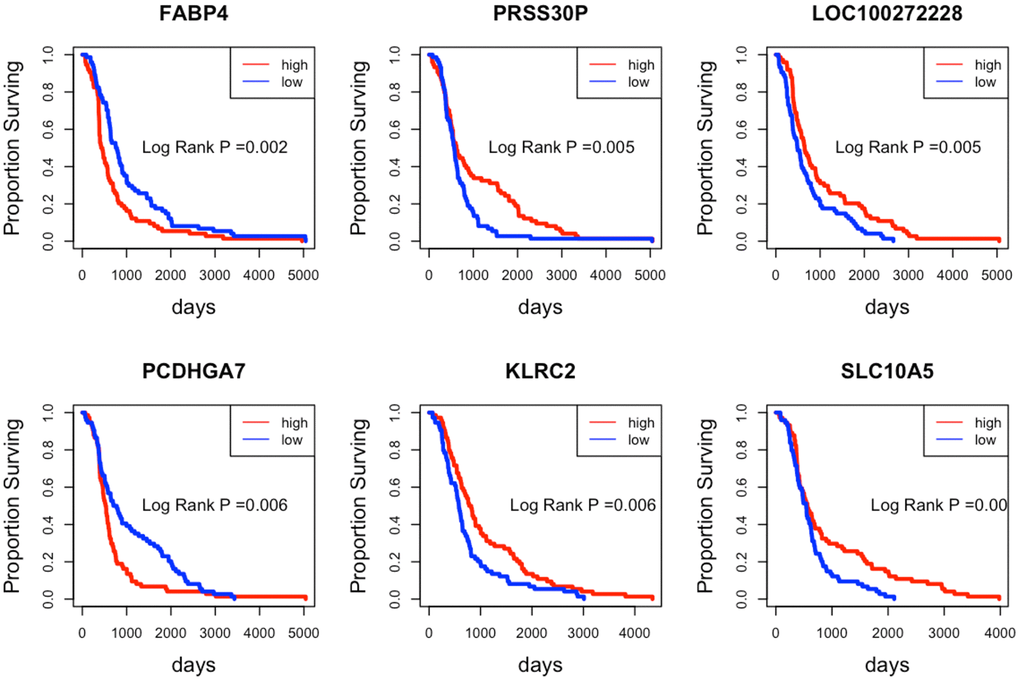
Figure 5.
Kaplan-Meier curves of the top 6 prognostic indicator genes.
The patients with high/low expression levels are marked in red and blue, respectively.