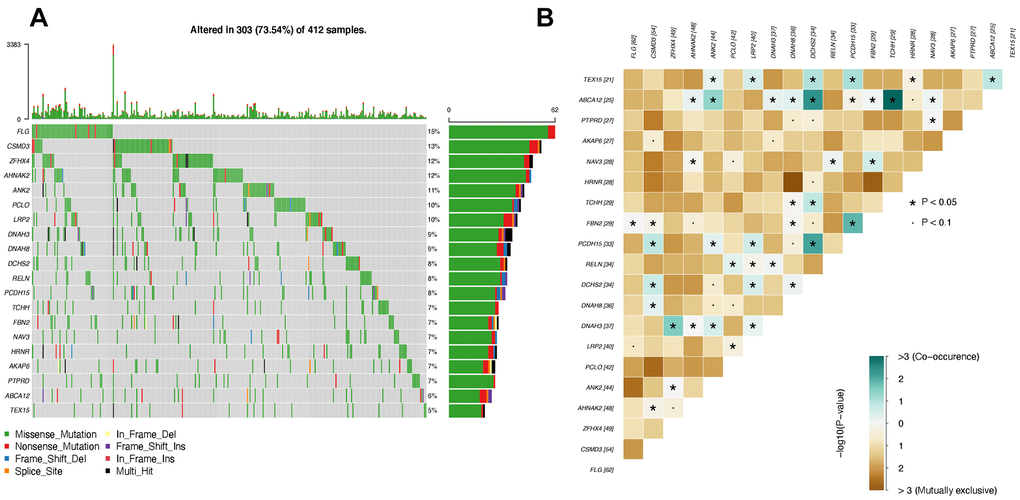
Figure 3.Top mutated genes that are also differentially expressed. (A) Oncoplot of top mutated genes. Each row indicates one gene, and each column represents one patient. (B) Interactions between mutated genes. The co-occurrence and mutually exclusive interactions are marked in blue and yellow, respectively.