


Introduction
Glioma is the most common type of intracranial tumor. Low-grade glioma (LGG) is classified by the World Health Organization (WHO) into grade I and grade II [1]. Currently, LGG is primarily treated with surgical resection, radiotherapy, and chemotherapy, having a relatively favorable prognosis [2–4]. However, in the process of glioma development, mutated genes accumulate and the tumor microenvironment changes, and LGGs may slowly develop into high-grade gliomas (HGGs) [5–8]. Macrophages release inflammatory substances that cause gliomas to appear more aggressive [9, 10]. In line with this evidence, there is a hypothesis that regulation of the tumor immune process may potentially play a role in the treatment of glioma [11]. However, there are currently many challenges in glioma immunotherapy. For example, gliomas themselves secrete inhibitory cytokines, which leads to an immunosuppressive microenvironment [12, 13]. Moreover, the immune resistance of tumor cells in gliomas is significantly increased, and immune cells may transition from an anti-tumor phenotype to pro-tumor phenotype [14, 15]. Therefore, it is necessary to develop appropriate targets as the operational points of glioma treatment. Secretion of S100A protein is detectable in the extracellular space and in certain body fluids, such as serum, urine, sputum, cerebrospinal fluid, and feces [16–18]. S100A family members are widely involved in a variety of inflammatory disease regulatory processes, including ischemic heart inflammation, Kawasaki disease, eye inflammation, and chorioamnionitis, among others [19–23]. Multiple studies have shown that some of the S100A family members regulate tumor development by mediating tumor immune processes [24–27]. Therefore, we investigated the role of the S100A protein family in glioma pathology.
Results
Differential expression of S100A family genes in LGG
We retrieved 12 S100A family genes, including S100A1, S100A2, S100A3, S100A4, S100A6, S100A8, S100A9, S100A10, S100A11, S100A13, S100A14, and S100A16, and acquired their mRNA expression levels in various tumors and normal tissues via the ONCOMINE database. Results showed that compared to normal tissues, the expression of S100A3, S100A4, S100A6, S100A8, S100A9, S100A10, S100A11, and S100A16 was upregulated in CNS cancer tissues, while S100A1 and S100A13 were downregulated (Figure 1).
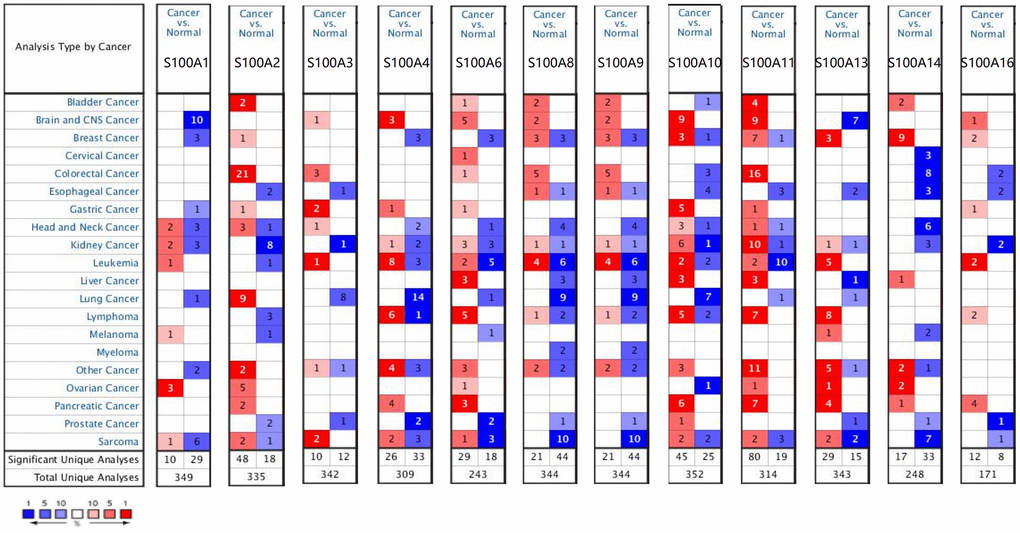
Figure 1. Differential expression of S100A family genes in various types of tumors and normal tissues. Red: high expression level, darker color means higher expression level, blue: low expression level, darker color means lower expression level.
We assessed differential expression of 12 S100A family genes across LGG, GBM, and normal tissues via the GEPIA database Single Gene Analysis module. The results showed that S100A2, S100A6, S100A10, S100A11, and S100A16 were upregulated and S100A1 and S100A13 were downregulated in LGG compared to normal tissues (p<0.05). S100A2, S100A3, S100A4, S100A6, S100A8, S100A9, S100A10, S100A11, and S100A16 were upregulated and S100A1 was downregulated in GBM compared to normal tissues (p<0.05). There was no significant difference in the expression of S100A3, S100A4, S100A8, and S100A9 in LGGs compared with normal tissues. However, expression of these genes was upregulated during the progression of glioma grade (Figure 2A–2L).
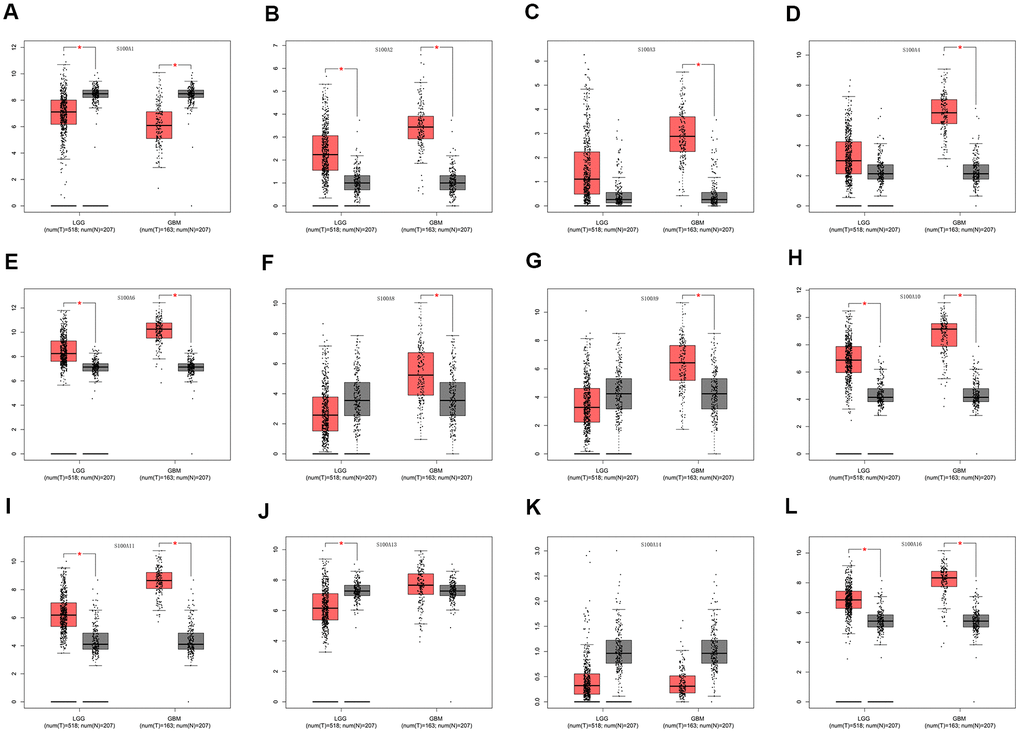
Figure 2. Differential expression of S100A family genes in LGG, GBM and normal tissues. (A) S100A1, (B) S100A2, (C) S100A3, (D) S100A4, (E) S100A6, (F) S100A8, (G) S100A9, (H) S100A10, (I) S100A11, (J) S100A13, (K) S100A14, (L) S100A16. *P < 0.05.
Gene mutations and PPI networks of S100A family in LGG
Via the cBioPortal database, we analyzed genetic variation of the S100A family based on the LGG sample data from the TCGA database. The results are presented in Figure 3A. The mutation rate was 4% for S100A2, S100A4, and S100A6, 5% for S100A1, S100A3, S100A8, S100A9, S100A11, S100A13, and S100A14, and 6% for S100A10 and S100A16.
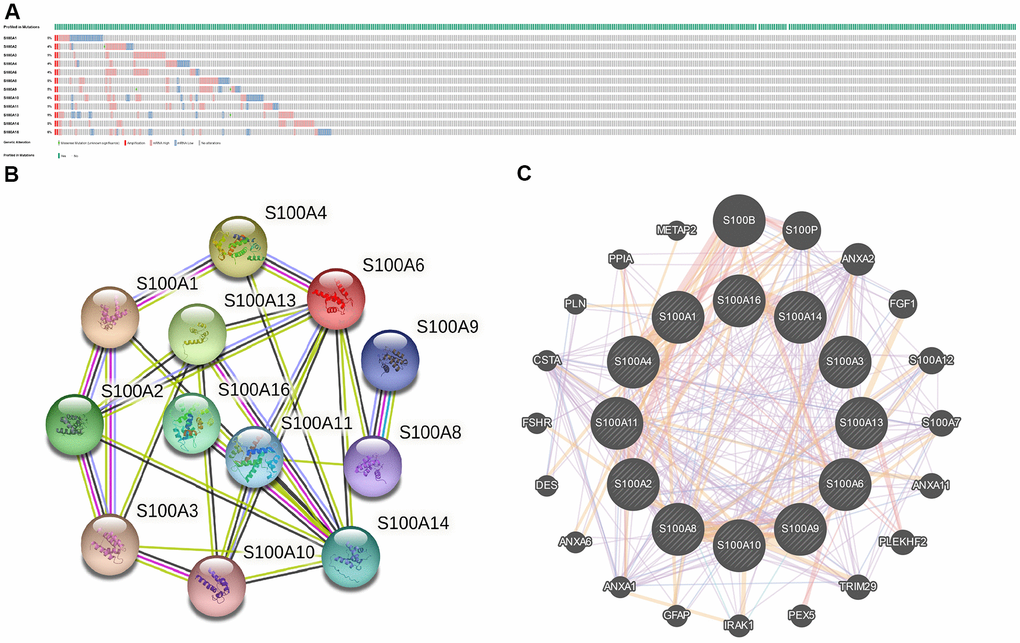
Figure 3. (A) Gene mutations of S100A family in LGG; (B) PPI networks for S100A family genes in the String database; (C) PPI network of S100A family genes in the GeneMANIA database.
We also performed PPI network analysis of the S100A family via STRING and GeneMANIA to explore potential protein interactions and to seek network-related genes. The PPI network identified by the STRING database presented 12 S100A family gene nodes and 26 edges (Figure 3B). S100A family gene functions were suggested to be related to the IL-17 signaling pathway, S100 protein binding, and inflammatory responses. Furthermore, the GeneMANIA results also showed that the function of S100A family genes (S100A1, S100A2, S100A3, S100A4, S100A6, S100A8, S100A9, S100A10, S100A11, S100A13, S100A14, S100A16) were mainly associated with S100 protein binding, calcium ion binding, and calcium-dependent protein binding. S100A family protein network-related genes included S100B, S100P, ANXA2, FGF1, S100A12. S100A7, ANXA11, PLEKHF2, TRIM29, PEX5, IRAK1, GFAP, ANXA1, ANXA6, DES, FSHR, CSTA, PLN, PPIA, and METAP2 (Figure 3C).
Enrichment analysis of S100A family genes in LGGs
We conducted GO functional annotation and KEGG pathway enrichment analysis of S100A family genes (S100A1, S100A2, S100A3, S100A4, S100A6, S100A8, S100A9, S100A10, S100A11, S100A13, S100A14, S100A16) and protein network-related genes (S100B, S100P, ANXA2, FGF1, S100A12, S100A7, ANXA11, PLEKHF2, TRIM29, PEX5, IRAK1, GFAP, ANXA1, ANXA6, DES, FSHR, CSTA, PLN, PPIA, METAP2) based on the WebGestalt database (Table 1). The results show that at the BP level, these genes were mainly enriched in granulocyte chemotaxis, granulocyte migration, leukocyte activation involved in immune response, cell activation involved in immune response, leukocyte degranulation, myeloid cell activation involved in immune response, immune response, myeloid leukocyte mediated immunity, cell chemotaxis, and innate immune response (Figure 4A). At the CC level, the genes were predominantly enriched in extracellular matrix, collagen-containing extracellular matrix, secretory granule lumen, cytoplasmic vesicle lumen, vesicle lumen, cell-cell adherens junction, cytoplasmic vesicle part, adherens junction, anchoring junction, and secretory granule (Figure 4B). At the MF level, the genes were enriched in calcium ion binding, calcium-dependent protein binding, RAGE receptor binding, S100 protein binding, identical protein binding, cadherin binding involved in cell-cell adhesion, protein homodimerization activity, transition metal ion binding, cell-cell adhesion mediator activity, and calcium-dependent phospholipid binding (Figure 4C). No significant enrichment was detected in the KEGG pathway (all FDR>0.05), though IL-17 was the main highly enriched signaling pathway (Figure 4D).
Table 1. Enrichment analysis of S100A family genes and protein network-associated genes.
| Category | Term | Description | Ratio | P-value | FDR |
| BP term | GO:0071621 | granulocyte chemotaxis | 27.103 | 7.43E-08 | 0.00050541 |
| BP term | GO:0097530 | granulocyte migration | 23.891 | 1.58E-07 | 0.00050541 |
| BP term | GO:0002366 | leukocyte activation involved in immune response | 7.7568 | 2.91E-07 | 0.00050541 |
| BP term | GO:0002263 | cell activation involved in immune response | 7.7123 | 3.07E-07 | 0.00050541 |
| BP term | GO:0043299 | leukocyte degranulation | 9.1454 | 3.31E-07 | 0.00050541 |
| BP term | GO:0002275 | myeloid cell activation involved in immune response | 8.9758 | 3.87E-07 | 0.00050541 |
| BP term | GO:0006955 | immune response | 4.2018 | 3.90E-07 | 0.00050541 |
| BP term | GO:0002444 | myeloid leukocyte mediated immunity | 8.8283 | 4.45E-07 | 0.00050541 |
| BP term | GO:0060326 | cell chemotaxis | 13.02 | 8.08E-07 | 0.00081587 |
| BP term | GO:0045087 | innate immune response | 6.5 | 1.4691E-06 | 0.0011369 |
| CC term | GO:0031012 | extracellular matrix | 11.823 | 5.25E-09 | 0.000003782 |
| CC term | GO:0062023 | collagen-containing extracellular matrix | 14.42 | 6.44E-09 | 0.000003782 |
| CC term | GO:0034774 | secretory granule lumen | 14.661 | 4.54E-08 | 0.000015891 |
| CC term | GO:0060205 | cytoplasmic vesicle lumen | 13.963 | 6.61E-08 | 0.000015891 |
| CC term | GO:0031983 | vesicle lumen | 13.921 | 6.76E-08 | 0.000015891 |
| CC term | GO:0005913 | cell-cell adherens junction | 26.656 | 0.000001097 | 0.00021484 |
| CC term | GO:0044433 | cytoplasmic vesicle part | 4.8134 | 2.1766E-06 | 0.00034453 |
| CC term | GO:0005912 | adherens junction | 8.7202 | 2.3457E-06 | 0.00034453 |
| CC term | GO:0070161 | anchoring junction | 8.4684 | 2.9165E-06 | 0.00038077 |
| CC term | GO:0030141 | secretory granule | 6.3513 | 6.5396E-06 | 0.0007684 |
| MF term | GO:0005509 | calcium ion binding | 15.164 | 0 | 0 |
| MF term | GO:0048306 | calcium-dependent protein binding | 86.813 | 0 | 0 |
| MF term | GO:0050786 | RAGE receptor binding | 378.82 | 0 | 0 |
| MF term | GO:0044548 | S100 protein binding | 260.44 | 2.22E-16 | 1.04E-13 |
| MF term | GO:0042802 | identical protein binding | 5.5282 | 1.46E-10 | 5.49E-08 |
| MF term | GO:0098641 | cadherin binding involved in cell-cell adhesion | 109.66 | 4.25E-08 | 0.000013292 |
| MF term | GO:0042803 | protein homodimerization activity | 6.8129 | 2.46E-07 | 0.000064984 |
| MF term | GO:0046914 | transition metal ion binding | 5.9078 | 2.77E-07 | 0.000064984 |
| MF term | GO:0098632 | cell-cell adhesion mediator activity | 41.67 | 2.4215E-06 | 0.00050501 |
| MF term | GO:0005544 | calcium-dependent phospholipid binding | 37.882 | 0.000003562 | 0.00066858 |
| KEGG_PATHWAY | hsa04657 | IL-17 signaling pathway | 21.323 | 0.00031034 | 0.10117 |
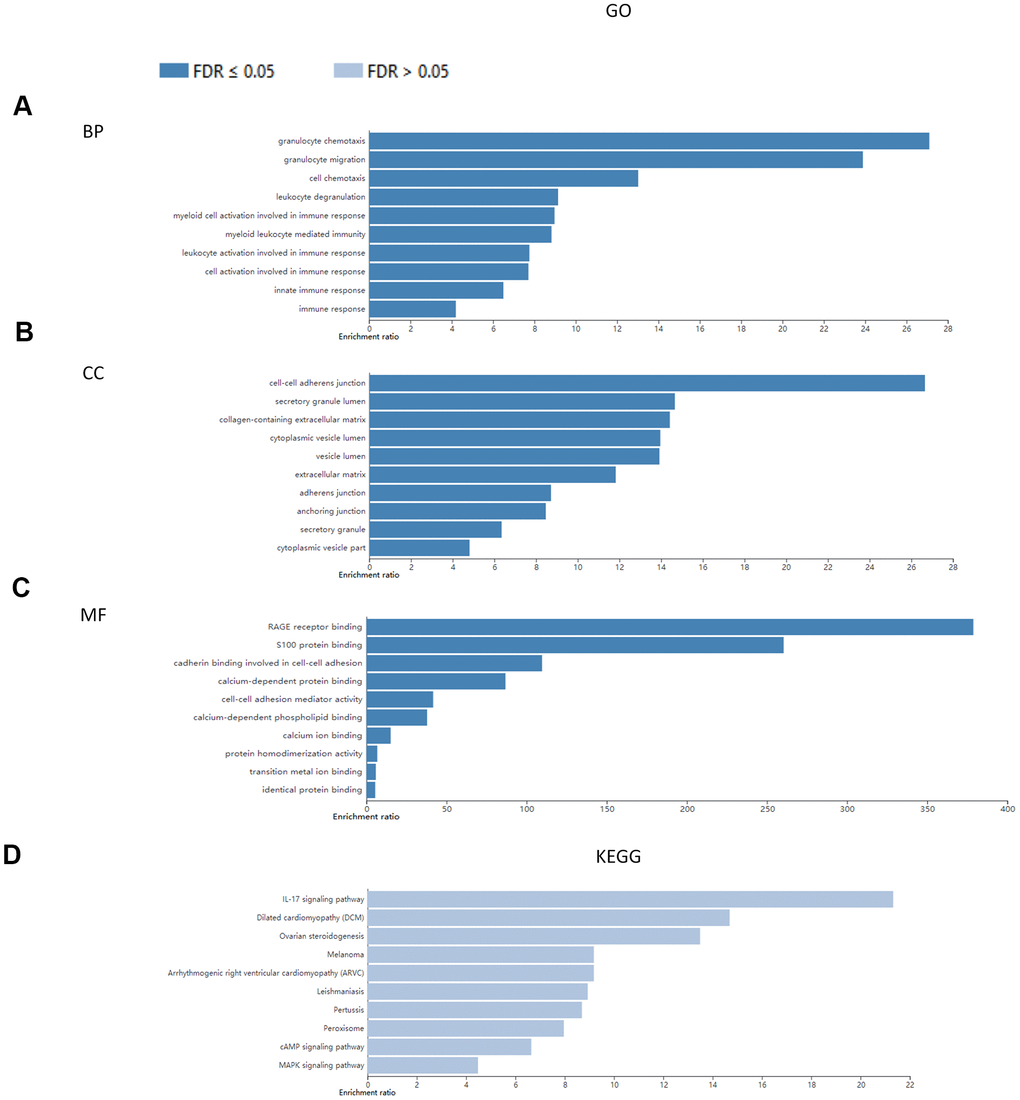
Figure 4. Enrichment analysis of S100A family genes and protein network-associated genes. (A) BP; (B) CC; (C) MF; (D) KEGG.
Kinase target, transcription factor target, miRNA target of S100A family genes in LGG
From GSEA analysis of the LinkedOmics database, we observed that PRKDC was the top kinase target for S100A1, LYN was the main kinase target for S100A2, S100A3, S100A8, S100A10, and S100A11, LCK was the kinase target for S100A4, S100A6 and S100A9, and CDK2, ATR, and ATM were the kinases targets for S100A13, S100A14, and S100A16. The transcription factor target of S100A1, S100A2, S100A6, S100A8 and S100A9 was NRSF. The main transcription factor target of S100A3 and S100A4 was SRF. The main transcription factor target of S100A10 and S100A11 was IRF. And S100A13, S100A14 and S100A16 were respectively corresponding to MAX, E2F and YY1. The top miRNA targets for S100A1, S100A2, S100A3, S100A8, S100A9, S100A10, S100A13, S100A14 were miR-490, miR-369-3P, miR-500, (miR-517A, miR-517C), miR-409-5P, miR-33, (miR-193A, miR-193B), and miR-129. The primary miRNA target for S100A4 and S100A11 was miR-34B, and miR-9 for S100A6 and 100A16 (Table 2).
Table 2. Kinase target, transcription factor target, miRNA target of S100A family genes in LGG.
| Gene symbol | Enriched category | Geneset | LeadingEdgeNum | FDR |
| S100A1 | Kinase Target | Kinase_PRKDC | 22 | 0 |
| Transcription Factor Target | V$NRSF_01 | 39 | 0 | |
| miRNA Target | CCAGGTT,MIR-490 | 27 | 0 | |
| S100A2 | Kinase Target | Kinase_LYN | 24 | 0.0039789 |
| Transcription Factor Target | V$NRSF_01 | 59 | 0 | |
| miRNA Target | GTATTAT,MIR-369-3P | 88 | 0 | |
| S100A3 | Kinase Target | Kinase_LYN | 25 | 0 |
| Transcription Factor Target | V$SRF_01 | 22 | 0 | |
| miRNA Target | AGGTGCA,MIR-500 | 42 | 0 | |
| S100A4 | Kinase Target | Kinase_LCK | 21 | 0 |
| Transcription Factor Target | V$SRF_01 | 22 | 0 | |
| miRNA Target | ACTGCCT,MIR-34B | 83 | 0 | |
| S100A6 | Kinase Target | Kinase_LCK | 23 | 0 |
| Transcription Factor Target | V$NRSF_01 | 55 | 0 | |
| miRNA Target | TAGCTTT,MIR-9 | 82 | 0 | |
| S100A8 | Kinase Target | Kinase_LYN | 26 | 0 |
| Transcription Factor Target | V$NRSF_01 | 49 | 0 | |
| miRNA Target | TGCACGA,MIR-517A,MIR-517C | 7 | 0.097901 | |
| S100A9 | Kinase Target | Kinase_LCK | 21 | 0 |
| Transcription Factor Target | V$NRSF_01 | 58 | 0 | |
| miRNA Target | GGTAACC,MIR-409-5P | 10 | 0.0725 | |
| S100A10 | Kinase Target | Kinase_LYN | 22 | 0 |
| Transcription Factor Target | STTTCRNTTT_V$IRF_Q6 | 78 | 0 | |
| miRNA Target | CAATGCA,MIR-33 | 35 | 0 | |
| S100A11 | Kinase Target | Kinase_LYN | 23 | 0 |
| Transcription Factor Target | STTTCRNTTT_V$IRF_Q6 | 68 | 0 | |
| miRNA Target | ACTGCCT,MIR-34B | 72 | 0 | |
| S100A13 | Kinase Target | Kinase_CDK2 | 112 | 0 |
| Transcription Factor Target | V$MAX_01 | 76 | 0 | |
| miRNA Target | GGCCAGT,MIR-193A,MIR-193B | 28 | 0 | |
| S100A14 | Kinase Target | Kinase_ATR | 41 | 0 |
| Transcription Factor Target | V$E2F_01 | 24 | 0 | |
| miRNA Target | GCAAAAA,MIR-129 | 63 | 0 | |
| S100A16 | Kinase Target | Kinase_ATM | 45 | 0.0024242 |
| Transcription Factor Target | GCCATNTTG_V$YY1_Q6 | 133 | 0 | |
| miRNA Target | TAGCTTT,MIR-9 | 64 | 0 |
Association between immune cell infiltration and S100A family genes in LGG
S100A family genes could influence the prognosis of LGG patients by participating in immune cell infiltration. Therefore, we investigated the correlation between S100A family genes (S100A1, S100A2, S100A3, S100A4, S100A6, S100A8, S100A9, S100A10, S100A11, S100A13, S100A14, S100A16) and immune cell infiltration via the TIMER database. S100A1 expression was negatively correlated with infiltration of CD4+ T cells (r = -0.197, p = 1.44e-05), macrophages (r = -0.165, p = 3.25e-04), neutrophils (r = -0.136, p = 2.88e-03), and dendritic cells (r = -0.172, p = 1.68e-04) (Figure 5A). S100A2 expression was positively correlated with infiltration of B cells (r = 0.297, p = 3.72e-11), CD4+ T cells (r = 0.495, p = 9.54e-31), macrophages (r = 0.483, p = 5.49e-29), neutrophils (r = 0.46, p = 2.82e-26), and dendritic cells (r = 0.478, p = 1.69e-28) (Figure 5B). The expression of S100A3, S100A4, S100A6, S100A8, S100A9, S100A11, and S100A16 was positively correlated with B-cell, CD8+ T-cell, CD4+ T-cell, macrophage, neutrophil, and dendritic cell infiltration (all p<0.05, Figure 5C–5G, 5I, 5L). Expression of S100A10 was positively correlated with infiltration of all immune cell types with the exception of CD8+ T cells (p < 0.05, Figure 5H). S100A13 expression was positively correlated with CD8+ T-cell infiltration (r = 0.215, p = 1.99e-06, Figure 5J). S100A14 expression was uncorrelated with immune cell infiltration (all p > 0.05, Figure 5K). We also evaluated the association between S100A family genes and immune cell infiltration with Cox proportional risk model. The results showed that LGG patient prognosis was significantly correlated with expression of S100A6 (p = 0.003), S100A10 (p = 0.001), S100A11 (p = 0.019), and S100A16 (p = 0.016, Table 3).
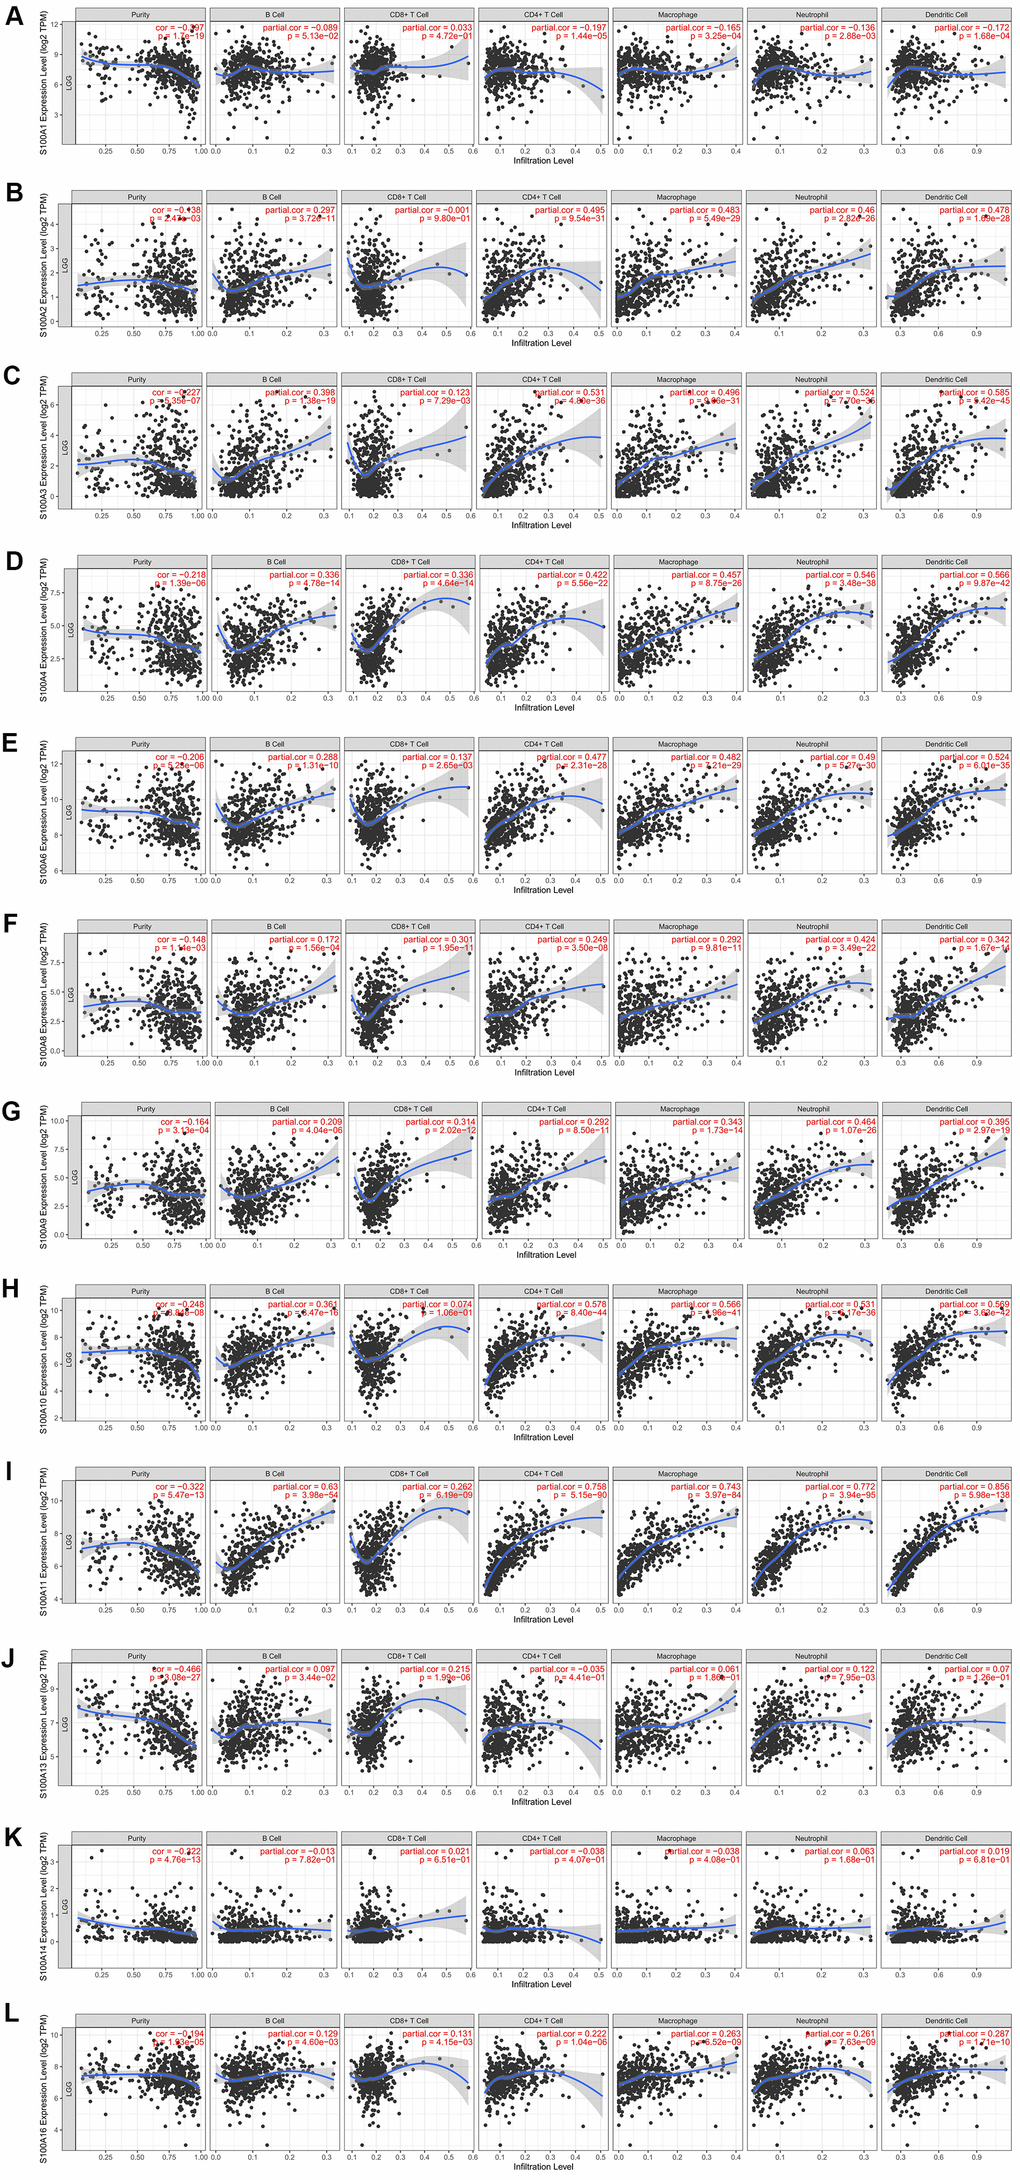
Figure 5. Immune cell infiltration of S100A family genes in LGG. (A) S100A1, (B) S100A2, (C) S100A3, (D) S100A4, (E) S100A6, (F) S100A8, (G) S100A9, (H) S100A10, (I) S100A11, (J) S100A13, (K) S100A14, (L) S100A16.
Table 3. Cox proportional risk model for the association of S100A family genes with six types of immune infiltrating cells in LGG.
| coef | HR | 95%CI_l | 95%CI_u | p.value | sig | ||||||||||||||||||||||||||||||||||||||||||||||||||||||||||||||||||||||||||||||||||||||||||||||
| B_cell | 0.813 | 2.254 | 0.004 | 1253.711 | 0.801 | ||||||||||||||||||||||||||||||||||||||||||||||||||||||||||||||||||||||||||||||||||||||||||||||
| CD8_Tcell | 5.853 | 348.304 | 0.351 | 346002.895 | 0.096 | • | |||||||||||||||||||||||||||||||||||||||||||||||||||||||||||||||||||||||||||||||||||||||||||||
| CD4_Tcell | 1.071 | 2.918 | 0.001 | 12272.314 | 0.801 | ||||||||||||||||||||||||||||||||||||||||||||||||||||||||||||||||||||||||||||||||||||||||||||||
| Macrophage | 4.050 | 57.387 | 0.650 | 5067.284 | 0.076 | • | |||||||||||||||||||||||||||||||||||||||||||||||||||||||||||||||||||||||||||||||||||||||||||||
| Neutrophil | -5.688 | 0.003 | 0.000 | 7.290 | 0.146 | ||||||||||||||||||||||||||||||||||||||||||||||||||||||||||||||||||||||||||||||||||||||||||||||
| Dendritic | -0.631 | 0.532 | 0.006 | 51.317 | 0.787 | ||||||||||||||||||||||||||||||||||||||||||||||||||||||||||||||||||||||||||||||||||||||||||||||
| S100A1 | -0.083 | 0.920 | 0.776 | 1.091 | 0.339 | ||||||||||||||||||||||||||||||||||||||||||||||||||||||||||||||||||||||||||||||||||||||||||||||
| S100A2 | -0.220 | 0.802 | 0.555 | 1.160 | 0.242 | ||||||||||||||||||||||||||||||||||||||||||||||||||||||||||||||||||||||||||||||||||||||||||||||
| S100A3 | -0.056 | 0.946 | 0.755 | 1.185 | 0.629 | ||||||||||||||||||||||||||||||||||||||||||||||||||||||||||||||||||||||||||||||||||||||||||||||
| S100A4 | -0.143 | 0.867 | 0.677 | 1.110 | 0.257 | ||||||||||||||||||||||||||||||||||||||||||||||||||||||||||||||||||||||||||||||||||||||||||||||
| S100A6 | 0.622 | 1.863 | 1.233 | 2.815 | 0.003 | ** | |||||||||||||||||||||||||||||||||||||||||||||||||||||||||||||||||||||||||||||||||||||||||||||
| S100A8 | 0.159 | 1.172 | 0.817 | 1.683 | 0.389 | ||||||||||||||||||||||||||||||||||||||||||||||||||||||||||||||||||||||||||||||||||||||||||||||
| S100A9 | -0.165 | 0.848 | 0.564 | 1.275 | 0.428 | ||||||||||||||||||||||||||||||||||||||||||||||||||||||||||||||||||||||||||||||||||||||||||||||
| S100A10 | -0.405 | 0.667 | 0.524 | 0.850 | 0.001 | ** | |||||||||||||||||||||||||||||||||||||||||||||||||||||||||||||||||||||||||||||||||||||||||||||
| S100A11 | 0.528 | 1.695 | 1.089 | 2.638 | 0.019 | * | |||||||||||||||||||||||||||||||||||||||||||||||||||||||||||||||||||||||||||||||||||||||||||||
| S100A13 | 0.201 | 1.222 | 0.929 | 1.608 | 0.152 | ||||||||||||||||||||||||||||||||||||||||||||||||||||||||||||||||||||||||||||||||||||||||||||||
| S100A14 | -0.236 | 0.790 | 0.458 | 1.362 | 0.396 | ||||||||||||||||||||||||||||||||||||||||||||||||||||||||||||||||||||||||||||||||||||||||||||||
| S100A16 | 0.376 | 1.456 | 1.072 | 1.979 | 0.016 | * | |||||||||||||||||||||||||||||||||||||||||||||||||||||||||||||||||||||||||||||||||||||||||||||
| *P < 0.05, **P < 0.01. | |||||||||||||||||||||||||||||||||||||||||||||||||||||||||||||||||||||||||||||||||||||||||||||||||||
Survival analysis of S100A family genes in LGG
We analyzed the relationship of S100A family genes with DFS and overall survival in LGG patients based on GEPIA. Results showed that differences in the expression of S100A2, S100A3, S100A4, S100A6, S100A8, S100A9, S100A10, S100A11, S100A13, and S100A16 were significantly associated with the overall survival of LGG patients, and the high expression of forementioned genes could be a risk factor for poor prognosis of LGG patients (Figure 6A–6L).
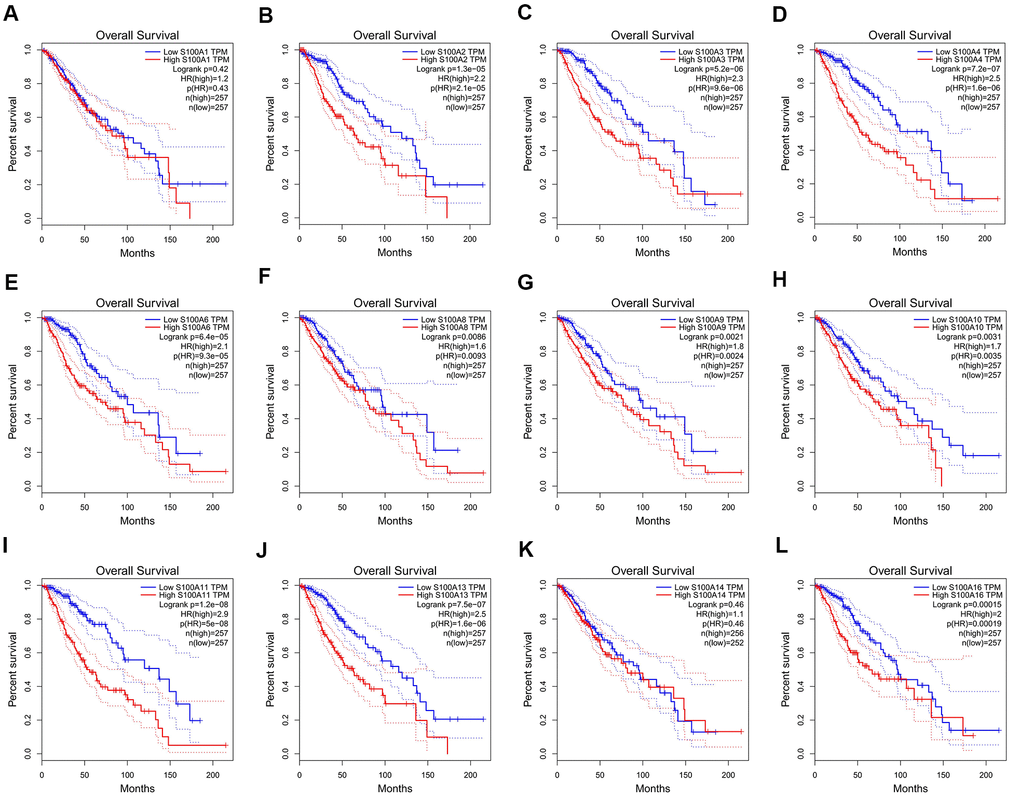
Figure 6. Relationship between the gene expression level of S100A family members and overall survival of LGG patients. (A) S100A1, (B) S100A2, (C) S100A3, (D) S100A4, (E) S100A6, (F) S100A8, (G) S100A9, (H) S100A10, (I) S100A11, (J) S100A13, (K) S100A14, (L) S100A16.
Correlation analysis and prognostic value analysis of S100A family in LGG
We performed correlation analysis of S100A family genes in CGGA LGG samples with the R corrplot package, and found a significant positive correlation between S100A family genes (Figure 7A). S100A2, S100A3, S100A6, S100A10, and S100A11 were subsequently identified as possible prognosis-related genes in LGG patients by COX regression analysis (Figure 7B).
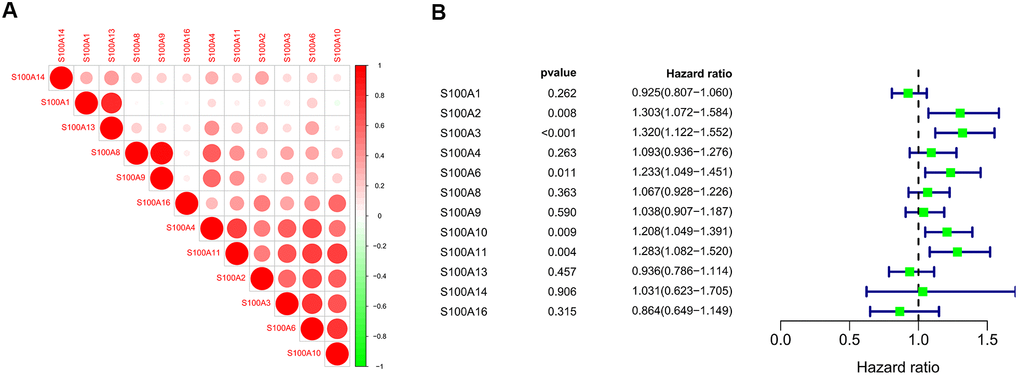
Figure 7. (A) Correlation analysis of S100A family genes of LGG samples in CGGA; (B) COX regression analysis of S100A family genes of LGG samples in CGGA.
Survival analysis revealed that statistically significant differences between the high and low expression groups of S100A3, S100A6, S100A10, and S100A11 genes, and high expression groups of S100A3, S100A6, S100A10, and S100A11 genes may be a risk factor of poor prognosis for LGG patients (P<0.05, Figure 8A–8E).
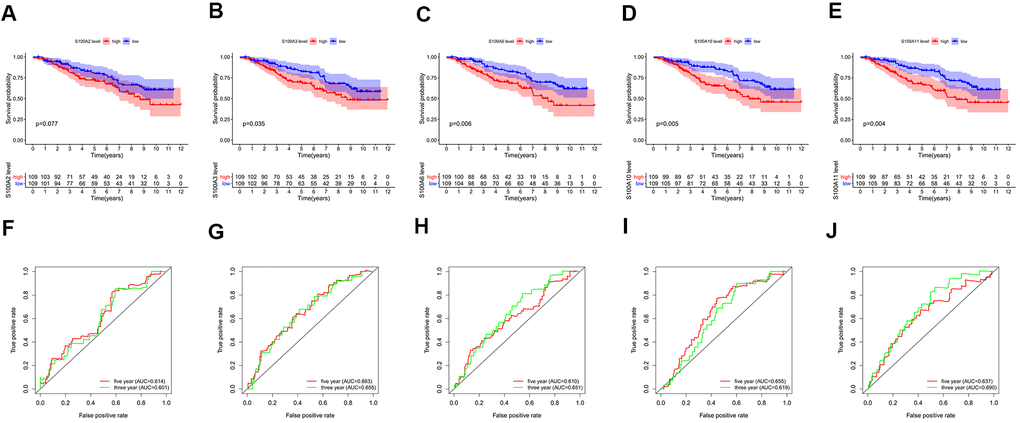
Figure 8. Survival analysis for high and low expression groups of prognosis-related genes: (A) S100A2, (B) S100A3, (C) S100A6, (D) S100A10, (E) S100A11. ROC curves for 3-year and 5-year survival of prognosis-related genes: (F) S100A2, (G) S100A3, (H) S100A6, (I) S100A10, (J) S100A11.
The AUC (area under curve) values of the 3-year and 5-year survival ROC curves for S100A2, S100A3, S100A6, S100A10, and S100A11 were >0.6, indicating moderate accuracy for predicting LGG prognosis (Figure 8F–8J). Clinical correlation analysis showed that the expression of S100A2, S100A3, S100A6, S100A10, and S100A11 was significantly lower in IDH Mutant and 1p19q codeletion LGG than in wildtype and 1p19q non-codeletion (Figure 9A–9J).
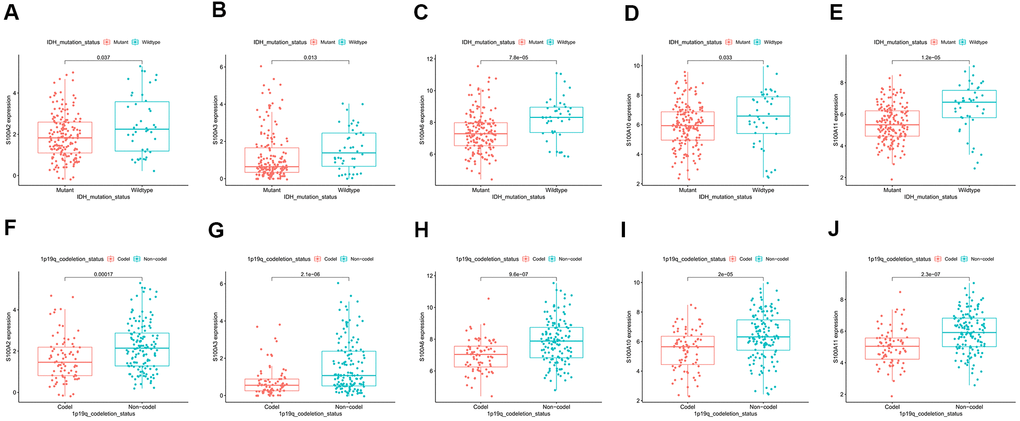
Figure 9. Correlation of prognosis-related gene expression in IDH Mutant and Wildtype LGG: (A) S100A2, (B) S100A3, (C) S100A6, (D) S100A10, (E) S100A11. Correlation of prognosis-related gene expression in 1p19q Codeletion and Non-Codeletion LGG: (F) S100A2, (G) S100A3, (H) S100A6, (I) S100A10, (J) S100A11.
Immunohistochemistry
The immunohistochemical staining validated the previous database analyses indicating that S100A2, S100A3, S100A6, S100A10, and S100A11 expression was upregulated in LGGs. The results revealed that S100A2, S100A3, S100A6, S100A10, and S100A11 were primarily expressed in the cytoplasm of cells, and S100A2, S100A3, S100A6, S100A10, and S100A11 expression was significantly higher in LGG compared with normal brain tissue (Figure 10).
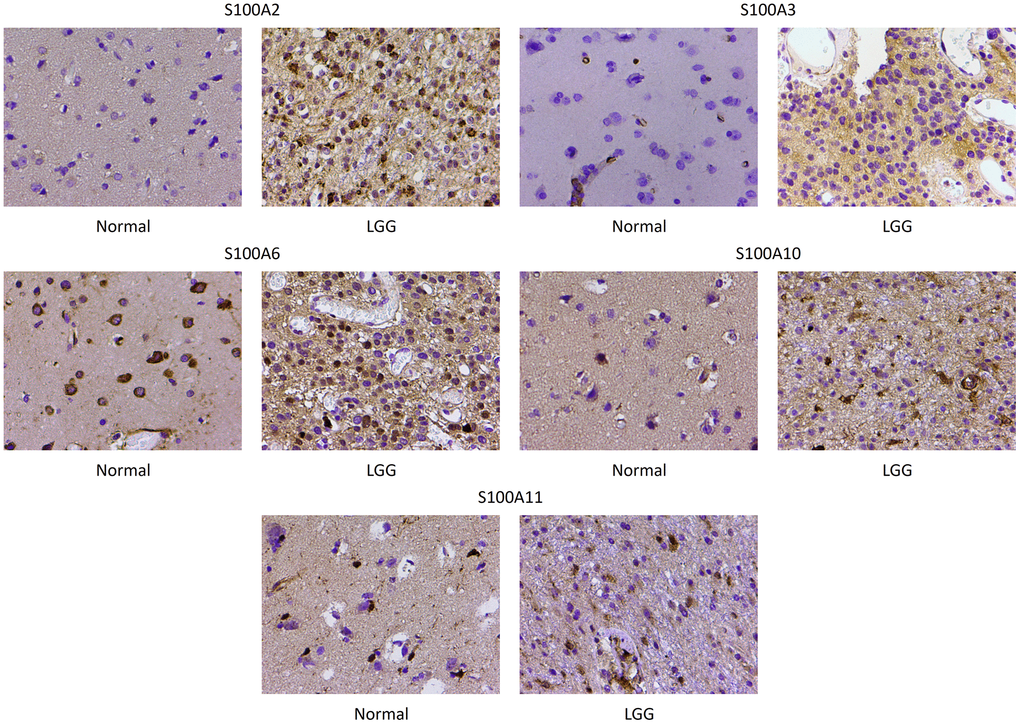
Figure 10. Immunohistochemical staining of S100A2, S100A3, S100A6, S100A10 and S100A11 in normal brain and low-grade glioma. Magnification, ×200.
Discussion
Although scientists have recognized numerous well-known immune regulatory sites, such as cell death protein 1 (PD-1), cell death ligand 1 (PDL-1), and cytotoxic T lymphocyte antigen 4 (CTLA4), monogenetic therapies are still ineffective [28, 29]. Thus, in the current study, we explored additional driver genes exerting immunosuppression. Calcium-binding activity of S100A family members was noted during our analysis. For instance, S100A4 has been reported to promote malignant progression of glioma [27].
The S100A protein family consists of 16 members, which regulate cell proliferation and differentiation, Ca2+ homeostasis, and inflammation among other processes [30]. During the early stages of inflammation, interleukin-1α (IL-1α), interleukin-33 (IL-33), and S100A family proteins function together in the regulation and warning of inflammation [31, 32]. Once released into the extracellular space, specific S100A proteins modulate innate and acquired immune responses, direct cell migration and chemotaxis, and induce tissue development and repair by interacting with various receptors [20, 30, 31].
The S100A family genes are differentially expressed in many tumors and have been detected in multiple tumors over the years. For example, through a comprehensive analysis of information from multiple patients, S100A2 was identified as a potential predictor of breast cancer [33]. Breast cancer studies showed that S100A2 is a tumor suppressor gene that is primarily regulated by BRCA1/p63 and plays a role in regulating the stability of mutant p53 [34]. In squamous cell carcinoma, FADU and RPMI-2650 cell lines showed high and low levels of S100A2, respectively, and S100A2 expression had a significant inhibitory effect on cell activity [35]. Glucose transporter type 1 (GLUT1) plays an important role in the process of glycolysis. Studies showed that activation of the S100A2/GLUT1 axis can promote colon cancer progression by regulating the glycolytic process [36].
In the analysis of Wang et al., S100A3 was found to be a potential predictive marker for gastric cancer [37]. Some researchers reported that inhibiting the expression of S100A3 significantly reduced the invasion ability of prostate cancer and inhibited tumor growth [38]. In hepatocellular carcinoma (HCC), S100A3 expression is associated with tumorigenesis and tumor aggressiveness [39]. The pharmacological activity of all trans-retinoic acid (ATRA) is in part mediated by retinoic acid receptor (RAR) transcription factors. S100A3 knockdown reduced the amount of RARα in breast and lung cancer cells, and thus induced resistance to ATRA differentiation, suggesting that S100A3 is an important regulatory factor affecting breast and lung cancer cell differentiation [40]. However, the role of S100A2 and S100A3 in brain tumors has been less well studied.
S100A family proteins are important regulators of immune-related biological behavior in glioma cell lines. Macrophages contribute to immune defense, immunomodulation, and tissue repair processes [41]. Depending on the conditions of cytokine production and activation, macrophages can be divided into two categories: pro-inflammatory M1 (classically activated macrophages) and anti-inflammatory M2 (alternatively activated macrophages) [42, 43]. By facilitating angiogenesis and immune evasion, M2-type macrophages can promote glioma progression [44]. In tumor biology, macrophages tend to differentiate into the M2 type rather than the tumor-killing M1 phenotype and produce cytokines such as IL-10, IL-4, and IL-13, which can promote tumor progression [45, 46]. Several members of the S100A family have macrophage regulatory functions. In periodontitis, S100A12 expression is higher in classical monocytes than in non-classical monocytes. In the process of differentiation from monocytes to macrophages, the expression and protein secretion of S100A12 is significantly decreased [47]. In a mouse model of peritonitis, S100A10 is directly involved in inflammation-stimulated plasminogen dependent macrophage recruitment [48]. Dulyaninova Ng et al. established a S100A4-deficient mouse model, and they found that S100A4 can regulate macrophage invasion through myosin-dependent and independent mechanisms [49]. Moreover, S100A4 can regulate the recruitment and chemotaxis of macrophages in mice [50].
S100A4 is an upstream regulator of epithelial-mesenchymal transition (EMT) master regulators SNAIL2 and ZEB, as well as other mesenchymal transition regulators of glioblastoma. Tumors with high S100A4 expression present higher tumor initiation and spheroid ability [27]. In glioma, S100A4 expression is affected by DNA methylation, β-linked proteins, and extracellular factors including epidermal growth factor and tumor necrosis factor alpha (TNF-α) [51]. By binding to calcium, S100A4 affects tumor cell motility and metastasis. Moreover, as the grade of glioma increases, S100A4 expression also increases [52]. S100A4 protein serves as a direct signaling target of receptor tyrosine kinase 2 (ERBB2) in medulloblastoma through a pathway involving phosphatidylinositol 3 kinase AKT (PI3K/AKT), which is ultimately blocked by the ERBB tyrosine kinase inhibitor OSI774 [53].
The infiltrating state of neutrophils is closely related to glioma development [54, 55]. Centrogranulocytes can promote the progression and growth of glioma through S100A4 [56]. S100A4 protein alters the expression of transcription factors and signal transduction pathway genes involved in T cell differentiation. Studies found that in S100A4-transfected T cells, the proportion of Th1-polarized cells was reduced and the Th1/Th2 balance shifted towards a Th2 tumorigenic phenotype [57]. Also, the expression of S100A4 and S100A6 was significantly increased, indicating a strong correlation between them [58].
S100A6 has a tumor-promotional effect in a variety of cancers. In colorectal and cervical cancer, S100A6 stimulates the proliferation and migration of cancer cells through the mitogen-activated protein kinases (MAPK) and PI3K/AKT signaling pathways, respectively [59, 60]. Moreover, S100A6 can regulate acetylation of P53 gene, thereby regulating the activity of lung cancer cells [61]. In an earlier study, changes in S100A6 protein expression levels were markers of differentiation between low-grade astrocytic tumors [62]. In conclusion, S100A6 is differentially expressed in a variety of cancers, and detection of serum S100A6 levels may aid in cancer diagnosis [18].
S100A8 and S100A9 proteins are potential immune modulators. They are involved in the regulation of cyclin expression [63]. S100A8 regulates activation of monocyte toll-like receptor 4 (TLR4) and controls the development of immune processes [64, 65]. Bone marrow-derived immunosuppressive cells were found to greatly hinder immune recognition of glioma cells [66]. High expression of S100A8 and S100A9 is strongly linked to tumor promotion [67–69]. High expression of S100A8 and S100A9 in glioma inhibits T cell function and their differentiation via interferon-alpha (INF-α) to regulate production of macrophages or dendritic cells [70, 71]. Furthermore, S100A8 and S100A9 are constitutively expressed in neutrophils and monocytes as Ca(2+) sensors and are involved in cytoskeletal rearrangement and arachidonic acid metabolism. By stimulating leukocyte recruitment and inducing cytokine secretion, they regulate inflammatory responses [72]. Acute-phase response protein serum amyloid SAA1 and SAA3 regulate the transcription of S100A4 through the TLR4/NF-κB signaling pathway. They can moderate transcription of S100A8 and S100A9 proteins and exert immunomodulatory functions [73].
The cancer-promoting effect of S100A10 is obvious in ovarian cancer [74, 75], the protein also stimulates production of breast cancer stem cells [76]. S100A10 mediates macrophage migration to tumor sites and increases fibrosarcoma invasion [77]. However, investigations of the role of S100A10 in brain tumor immunity are scarce.
S100A11 is known to be associated with poor prognosis in glioma patients. S100A11 upregulation can activate the NF-kB pathway and stimulate the invasion and migration of glioma. S100A11, whose associations with Annexin A2 (AXNA2) have been demonstrated, is suggested to be involved in regulation of the cell cycle [78].
In conclusion, multiple S100A family protein members contribute to tumor progression via their close relationship with inflammation.
Conclusions
Through the verification of multiple databases, we observed important roles of the inflammatory S100A family in glioma. Immunoinfiltration analysis showed that expression of multiple genes in the S100A family was highly correlated with the infiltration state of macrophages, neutrophils, and dendritic cells. There is considerable evidence of the correlation between S100A4 and glioma. There are relatively few studies on S100A2 and S100A3 genes in glioma immunity, and there is no sufficient evidence to show their specific role in glioma immunity at present. S100A6 has a tumor-promoting effect in a variety of cancers, and S100A6 expression may be an important factor to distinguish glioma grade, potentially in serum. In addition, S100A8, S100A9, S100A10, and S100A11 genes also showed a strong correlation with immune infiltration. In our data, S100A10 and S100A11 had the strongest correlation with the immune cell infiltration in glioma. Therefore, we believe that the immunomodulatory effect of the S100A family members is an important factor affecting the progression of glioma.
Materials and Methods
A study flowchart is presented in Figure 11.
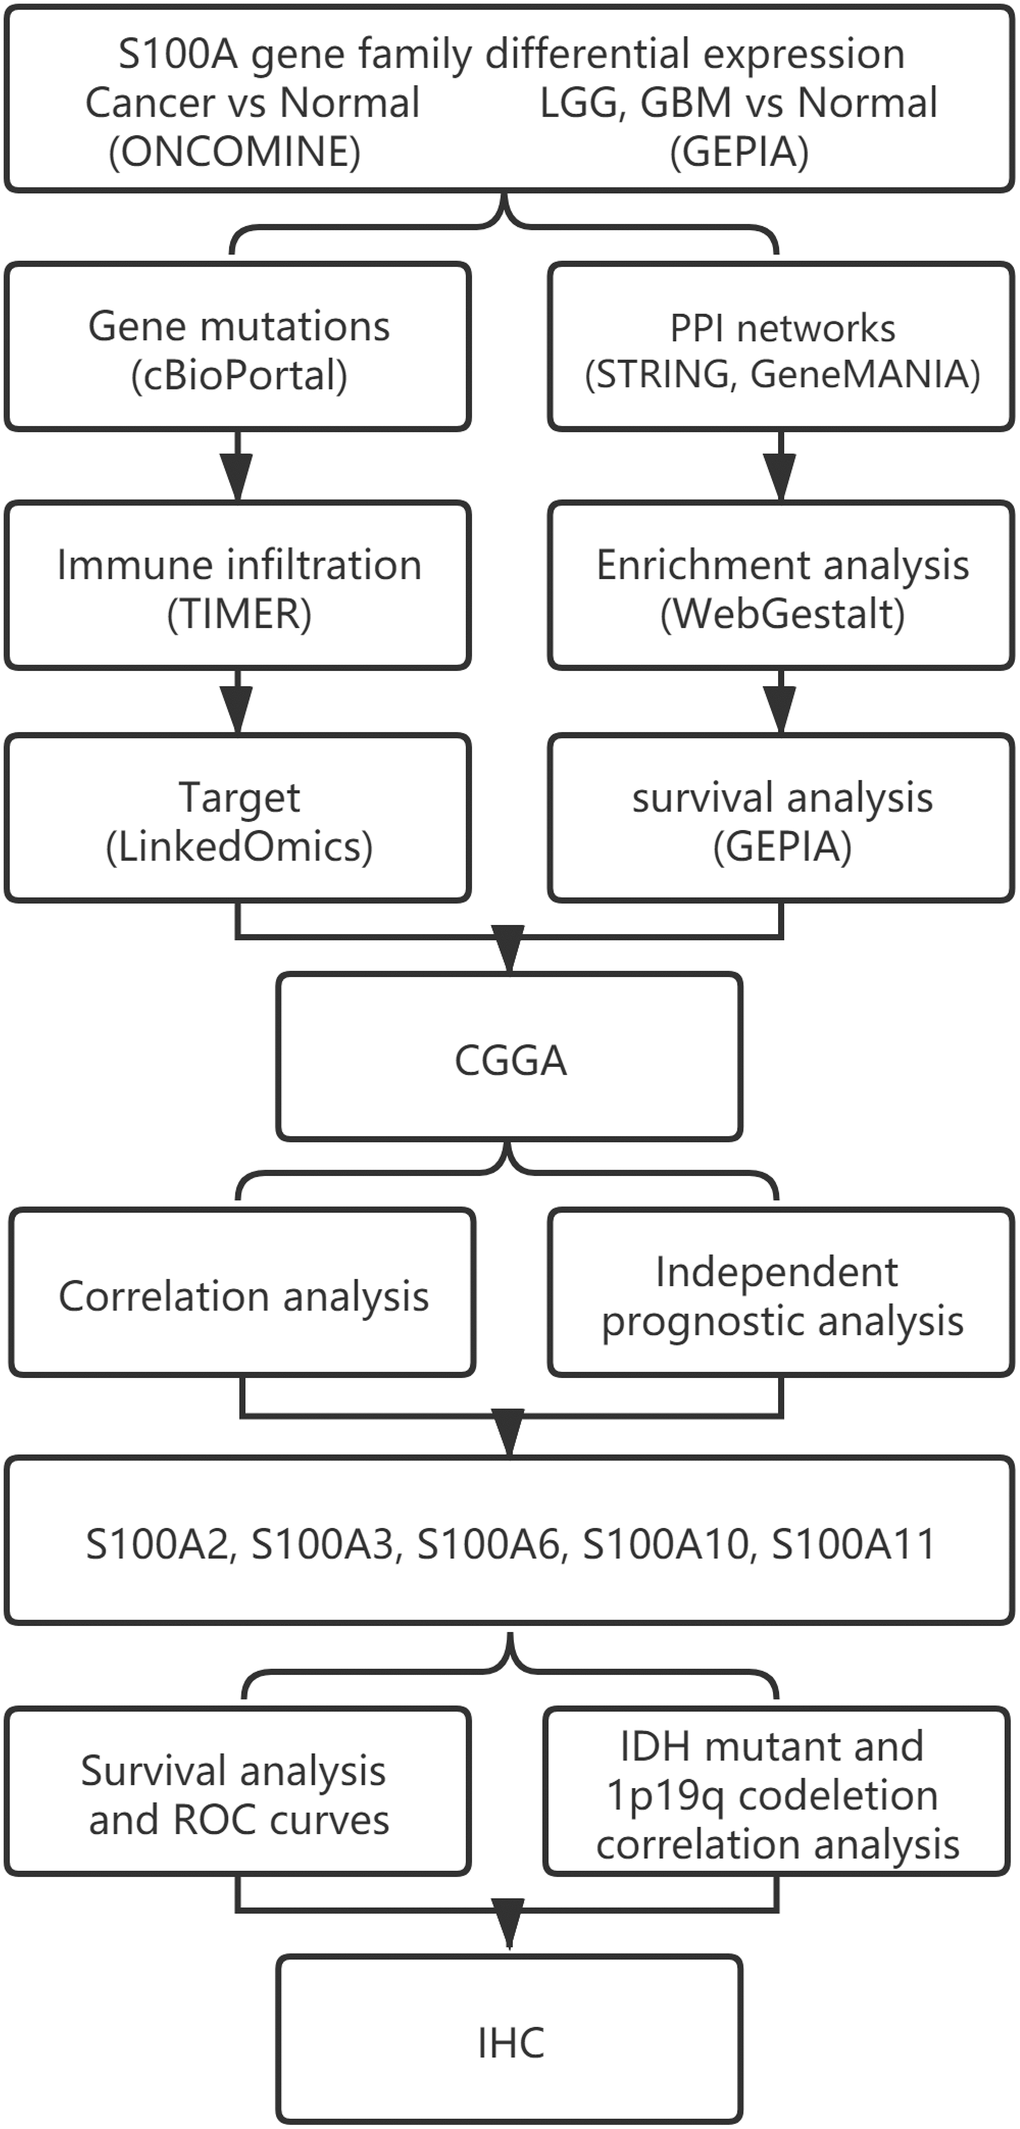
Figure 11. The workflow diagram of this study.
ONCOMINE
Oncomine (https://www.oncomine.org) is a large-scale oncogene microarray database, covering 65 gene microarray datasets, 4,700 microarrays, and expression data for 480 million genes, which can be used for analyzing gene expression differences, finding outliers, predicting co-expressed genes, etc. Data from Oncomine can be classified based on clinical information such as tumor stage, grade, and tissue type. We retrieved the mRNA expression data of S100A family genes in tumor tissue and normal tissue from database. In our analysis, p < 0.05, 2-fold change, and a top 10% gene rank were set as thresholds.
GEPIA
The GEPIA database (http://gepia.cancer-pku.cn/index.html) integrated TCGA cancer profiles and GTEx normal profiles to address important questions in cancer biology. With bioinformatics methods, we can reveal cancer subtypes, driver genes, alleles, and differentially expressed or carcinogenic factors, enabling in-depth exploration of novel cancer targets and markers. We employed the GEPIA Single Gene Analysis module and analyzed mRNA expression of the S100A gene family in LGG, GBM, and normal tissues. Finally, we used the survival analysis module to assess relations between S100A family gene expression and overall survival in LGG patients to plot survival curves. Hazard ratios were calculated based on the Cox PH (proportional hazard) model, the 95% confidence interval (CI) is indicated by dashed lines, the x-axis unit is months, and p < 0.05 is considered statistically significant.
cBioPortal
cBioPortal (https://www.cbioportal.org) is a comprehensive open web platform based on the TCGA database which integrated data mining, data integration, and visualization. We obtained mutation profile and genetic variation of the S100A family in 511 LGG samples (Samples with log2 copy-number data) from Brain Lower Grade Glioma (TCGA, PanCancer Atlas). mRNA expression was z-scored relative to all samples (log RNA Seq V2 RSEM), and a z-score threshold was set at ±2.
String
The String database (https://string-db.org/) is a searchable tool of known and predictive protein interactions in 2031 species, which includes 9.6 million proteins and 13.8 million protein interactions. It contains experimental data, results from text mining of PubMed abstracts, data synthesized from other databases, and predicted results via bioinformatics methods. We pictured protein–protein interaction (PPI) networks of the S100A gene family via the String database.
GeneMANIA
GeneMANIA (http://www.genemania.org) was used to predict protein interactions and to analyze co-expression, co-localization, pathways, physical interactions of the S100A gene family. Website prediction and other profiles were used to explore the potential protein functions of genes.
WebGestalt
WebGestalt (http://www.webgestalt.org/) is a widely used set of gene set enrichment analysis tools for functional enrichment analysis in different biological contexts. It is a powerful integrated data mining system capable of managing, retrieving, organizing, visualizing, and statistically analyzing large amounts of genes. We performed Gene ontology (GO) functional and KEGG pathway enrichment analysis of S100A family genes and protein network-related genes of GeneMANIA via WebGestalt's Over-Representation Analysis (ORA). GO annotations are divided into three major categories: Biological Process (BP), Cellular Components (CC), and Molecular Function (MF). The KEGG pathway was designed to identify the various pathways involved in the function of individual genes. The screening criteria were set at significance level of TOP10. The FDR value was set at 0.05.
LinkedOmics
The LinkedOmics database (http://www.linkedomics.org/) consists of multi-omics and clinical profiles from 32 cancer types, as well as 11,158 patient profiles from the Cancer Genome Atlas (TCGA) project. We studied kinase target, transcription factor target and miRNA target of the S100A gene family based on the Gene Set Enrichment Analysis (GSEA) of the LinkInterpreter module. Gene Set Enrichment Analysis (GSEA) was conducted under the following criteria: Rank Criteria (from LinkFinder Result) is the FDR value, Minimum Number of Genes (Size) is 3, and Simulations is 500.
TIMER
TIMER (https://cistrome.shinyapps.io/timer/) is a web tool created by Harvard University. It provided the profile of six types of infiltrating immune cells (B cells, CD4+ T cells, CD8+ T cells, neutrophils, macrophages, and dendritic cells) in tumor tissues which was detected by RNA-Seq expression profiling data. We assessed the correlation of S100A family expression levels with immune cell infiltration, LGG patient survival via the TIMER gene module, and survival module based on the Cox proportional risk model.
CGGA and R (4.0.2)
The CGGA database (http://www.cgga.org.cn/) is a database including brain tumor datasets from a Chinese cohort of more than 2000 samples. It contains whole exome sequencing, DNA methylation, mRNA sequencing, mRNA and microRNA microarrays, and matched clinical data. R is an open software programming language and operating environment for statistical analysis, mapping, and data mining. In this study, based on data from 218 LGGs with mRNAseq 693 and mRNAseq 325 samples in CGGA, we performed correlation analysis of S100A family genes using R 4.0.2. We also screened LGG prognosis-related genes via COX regression models, and their accuracy as prognostic genes was verified by survival analysis of high and low expression groups, Receiver Operating Characteristic (ROC) Curve analysis, and clinical correlation analysis.
Immunohistochemistry
Immunohistochemical staining was used to detect the expression of prognosis-related genes in normal brain and LGG tissues. The experiments utilizing human tissue were approved by the ethics committee of the First Hospital of Shanxi Medical University. Five samples of normal brain tissue in patients with epilepsy and traumatic brain injury, and five LGG samples were collected from the First Hospital of Shanxi Medical University. All postoperative tissues were examined pathologically in the Department of Pathology, First Hospital of Shanxi Medical University. After routine paraffin-embedding, tissue sections were obtained, placed on glass microscope slides, de-paraffinized, and rehydrated. Antigen retrieval and blocking of endogenous peroxidases were performed, followed by exposure to corresponding gene polyclonal antibodies (Sangon, Shanghai, China) and enzyme-labeled IgG polymers. Finally, antibodies were visualized using a diaminobenzidine (DAB) chromogenic solution and hematoxylin as a counterstain.
Ethics approval and consent to participate
This human tissue study was reviewed and approved by the Ethics Committee of the First Hospital of Shanxi Medical University (K042-2020-04-03), and patients provided written informed consent to participate in this study.
Availability of data and material
All data are available from ONCOMINE, GEPIA, cBioPortal, String, GeneMANIA, WebGestalt, LinkedOmics, TIMER and CGGA databases.
Author Contributions
Yu Zhang, Xin Yang, and Xiao-Lin Zhu contributed to the entire project, from the design proposal, to the experimental supplement and collation of data, to the writing of the paper. Hao Bai helped retrieve and organize the data, while Zhuang-Zhuang Wang and Jun-Jie Zhang were responsible for statistical analysis. Chun-Yan Hao and Hu-Bin Duan are responsible for supervising and providing financial support.
Acknowledgments
Thanks to the ONCOMINE, GEPIA, cBioPortal, String, GeneMANIA, WebGestalt, LinkedOmics, TIMER and CGGA databases for open data.
Conflicts of Interest
The authors declare that they have no conflicts of interest.
Funding
This work was supported by the National Natural Science Foundation of China Youth Fund (30600637); China Postdoctoral Science Foundation Special Grant (2019T120195); Key Grants for Returning Students from Shanxi Province (2016-4).
Editorial Note
This corresponding author has a verified history of publications using the personal email address for correspondence.
References
- 1. Louis DN, Ohgaki H, Wiestler OD, Cavenee WK, Burger PC, Jouvet A, Scheithauer BW, Kleihues P. The 2007 WHO classification of tumours of the central nervous system. Acta Neuropathol. 2007; 114:97–109. https://doi.org/10.1007/s00401-007-0243-4 [PubMed]
- 2. Schiff D, Van den Bent M, Vogelbaum MA, Wick W, Miller CR, Taphoorn M, Pope W, Brown PD, Platten M, Jalali R, Armstrong T, Wen PY. Recent developments and future directions in adult lower-grade gliomas: Society for Neuro-Oncology (SNO) and European Association of Neuro-Oncology (EANO) consensus. Neuro Oncol. 2019; 21:837–53. https://doi.org/10.1093/neuonc/noz033 [PubMed]
- 3. Jakola AS, Myrmel KS, Kloster R, Torp SH, Lindal S, Unsgård G, Solheim O. Comparison of a strategy favoring early surgical resection vs a strategy favoring watchful waiting in low-grade gliomas. JAMA. 2012; 308:1881–88. https://doi.org/10.1001/jama.2012.12807 [PubMed]
- 4. Dhawan S, Patil CG, Chen C, Venteicher AS. Early versus delayed postoperative radiotherapy for treatment of low-grade gliomas. Cochrane Database Syst Rev. 2020; 1:CD009229. https://doi.org/10.1002/14651858.CD009229.pub3 [PubMed]
- 5. Nejo T, Matsushita H, Karasaki T, Nomura M, Saito K, Tanaka S, Takayanagi S, Hana T, Takahashi S, Kitagawa Y, Koike T, Kobayashi Y, Nagae G, et al. Reduced Neoantigen Expression Revealed by Longitudinal Multiomics as a Possible Immune Evasion Mechanism in Glioma. Cancer Immunol Res. 2019; 7:1148–61. https://doi.org/10.1158/2326-6066.CIR-18-0599 [PubMed]
- 6. Appolloni I, Alessandrini F, Ceresa D, Marubbi D, Gambini E, Reverberi D, Loiacono F, Malatesta P. Progression from low- to high-grade in a glioblastoma model reveals the pivotal role of immunoediting. Cancer Lett. 2019; 442:213–21. https://doi.org/10.1016/j.canlet.2018.10.006 [PubMed]
- 7. Choi S, Yu Y, Grimmer MR, Wahl M, Chang SM, Costello JF. Temozolomide-associated hypermutation in gliomas. Neuro Oncol. 2018; 20:1300–09. https://doi.org/10.1093/neuonc/noy016 [PubMed]
- 8. Huang LE. Friend or foe-IDH1 mutations in glioma 10 years on. Carcinogenesis. 2019; 40:1299–307. https://doi.org/10.1093/carcin/bgz134 [PubMed]
- 9. Lepore F, D’Alessandro G, Antonangeli F, Santoro A, Esposito V, Limatola C, Trettel F. CXCL16/CXCR6 Axis Drives Microglia/Macrophages Phenotype in Physiological Conditions and Plays a Crucial Role in Glioma. Front Immunol. 2018; 9:2750. https://doi.org/10.3389/fimmu.2018.02750 [PubMed]
- 10. Bergamin LS, Braganhol E, Figueiró F, Casali EA, Zanin RF, Sévigny J, Battastini AM. Involvement of purinergic system in the release of cytokines by macrophages exposed to glioma-conditioned medium. J Cell Biochem. 2015; 116:721–29. https://doi.org/10.1002/jcb.25018 [PubMed]
- 11. Sampson JH, Gunn MD, Fecci PE, Ashley DM. Brain immunology and immunotherapy in brain tumours. Nat Rev Cancer. 2020; 20:12–25. https://doi.org/10.1038/s41568-019-0224-7 [PubMed]
- 12. Kelly WJ, Giles AJ, Gilbert M. T lymphocyte-targeted immune checkpoint modulation in glioma. J Immunother Cancer. 2020; 8:e000379. https://doi.org/10.1136/jitc-2019-000379 [PubMed]
- 13. Bloch O, Crane CA, Kaur R, Safaee M, Rutkowski MJ, Parsa AT. Gliomas promote immunosuppression through induction of B7-H1 expression in tumor-associated macrophages. Clin Cancer Res. 2013; 19:3165–75. https://doi.org/10.1158/1078-0432.CCR-12-3314 [PubMed]
- 14. Zeiner PS, Preusse C, Golebiewska A, Zinke J, Iriondo A, Muller A, Kaoma T, Filipski K, Müller-Eschner M, Bernatz S, Blank AE, Baumgarten P, Ilina E, et al. Distribution and prognostic impact of microglia/macrophage subpopulations in gliomas. Brain Pathol. 2019; 29:513–29. https://doi.org/10.1111/bpa.12690 [PubMed]
- 15. Vidyarthi A, Agnihotri T, Khan N, Singh S, Tewari MK, Radotra BD, Chatterjee D, Agrewala JN. Predominance of M2 macrophages in gliomas leads to the suppression of local and systemic immunity. Cancer Immunol Immunother. 2019; 68:1995–2004. https://doi.org/10.1007/s00262-019-02423-8 [PubMed]
- 16. Yang Z, Tao T, Raftery MJ, Youssef P, Di Girolamo N, Geczy CL. Proinflammatory properties of the human S100 protein S100A12. J Leukoc Biol. 2001; 69:986–94. [PubMed]
- 17. Bertheloot D, Latz E. HMGB1, IL-1α, IL-33 and S100 proteins: dual-function alarmins. Cell Mol Immunol. 2017; 14:43–64. https://doi.org/10.1038/cmi.2016.34 [PubMed]
- 18. Donato R, Sorci G, Giambanco I. S100A6 protein: functional roles. Cell Mol Life Sci. 2017; 74:2749–60. https://doi.org/10.1007/s00018-017-2526-9 [PubMed]
- 19. Rohde D, Schön C, Boerries M, Didrihsone I, Ritterhoff J, Kubatzky KF, Völkers M, Herzog N, Mähler M, Tsoporis JN, Parker TG, Linke B, Giannitsis E, et al. S100A1 is released from ischemic cardiomyocytes and signals myocardial damage via Toll-like receptor 4. EMBO Mol Med. 2014; 6:778–94. https://doi.org/10.15252/emmm.201303498 [PubMed]
- 20. Wu Y, Li Y, Zhang C, A X, Wang Y, Cui W, Li H, Du J. S100a8/a9 released by CD11b+Gr1+ neutrophils activates cardiac fibroblasts to initiate angiotensin II-Induced cardiac inflammation and injury. Hypertension. 2014; 63:1241–50. https://doi.org/10.1161/HYPERTENSIONAHA.113.02843 [PubMed]
- 21. Golubinskaya V, Puttonen H, Fyhr IM, Rydbeck H, Hellström A, Jacobsson B, Nilsson H, Mallard C, Sävman K. Expression of S100A Alarmins in Cord Blood Monocytes Is Highly Associated With Chorioamnionitis and Fetal Inflammation in Preterm Infants. Front Immunol. 2020; 11:1194. https://doi.org/10.3389/fimmu.2020.01194 [PubMed]
- 22. Tong L, Lan W, Lim RR, Chaurasia SS. S100A proteins as molecular targets in the ocular surface inflammatory diseases. Ocul Surf. 2014; 12:23–31. https://doi.org/10.1016/j.jtos.2013.10.001 [PubMed]
- 23. Huang LH, Kuo HC, Pan CT, Lin YS, Huang YH, Li SC. Multiomics analyses identified epigenetic modulation of the S100A gene family in Kawasaki disease and their significant involvement in neutrophil transendothelial migration. Clin Epigenetics. 2018; 10:135. https://doi.org/10.1186/s13148-018-0557-1 [PubMed]
- 24. Fei F, Qu J, Li C, Wang X, Li Y, Zhang S. Role of metastasis-induced protein S100A4 in human non-tumor pathophysiologies. Cell Biosci. 2017; 7:64. https://doi.org/10.1186/s13578-017-0191-1 [PubMed]
- 25. Wagner NB, Weide B, Gries M, Reith M, Tarnanidis K, Schuermans V, Kemper C, Kehrel C, Funder A, Lichtenberger R, Sucker A, Herpel E, Holland-Letz T, et al. Tumor microenvironment-derived S100A8/A9 is a novel prognostic biomarker for advanced melanoma patients and during immunotherapy with anti-PD-1 antibodies. J Immunother Cancer. 2019; 7:343. https://doi.org/10.1186/s40425-019-0828-1 [PubMed]
- 26. Ghavami S, Chitayat S, Hashemi M, Eshraghi M, Chazin WJ, Halayko AJ, Kerkhoff C. S100A8/A9: a Janus-faced molecule in cancer therapy and tumorgenesis. Eur J Pharmacol. 2009; 625:73–83. https://doi.org/10.1016/j.ejphar.2009.08.044 [PubMed]
- 27. Chow KH, Park HJ, George J, Yamamoto K, Gallup AD, Graber JH, Chen Y, Jiang W, Steindler DA, Neilson EG, Kim BY, Yun K. S100A4 Is a Biomarker and Regulator of Glioma Stem Cells That Is Critical for Mesenchymal Transition in Glioblastoma. Cancer Res. 2017; 77:5360–73. https://doi.org/10.1158/0008-5472.CAN-17-1294 [PubMed]
- 28. Zhao J, Chen AX, Gartrell RD, Silverman AM, Aparicio L, Chu T, Bordbar D, Shan D, Samanamud J, Mahajan A, Filip I, Orenbuch R, Goetz M, et al. Immune and genomic correlates of response to anti-PD-1 immunotherapy in glioblastoma. Nat Med. 2019; 25:462–69. https://doi.org/10.1038/s41591-019-0349-y [PubMed]
- 29. Omuro A, Vlahovic G, Lim M, Sahebjam S, Baehring J, Cloughesy T, Voloschin A, Ramkissoon SH, Ligon KL, Latek R, Zwirtes R, Strauss L, Paliwal P, et al. Nivolumab with or without ipilimumab in patients with recurrent glioblastoma: results from exploratory phase I cohorts of CheckMate 143. Neuro Oncol. 2018; 20:674–86. https://doi.org/10.1093/neuonc/nox208 [PubMed]
- 30. Gross SR, Sin CG, Barraclough R, Rudland PS. Joining S100 proteins and migration: for better or for worse, in sickness and in health. Cell Mol Life Sci. 2014; 71:1551–79. https://doi.org/10.1007/s00018-013-1400-7 [PubMed]
- 31. Holzinger D, Tenbrock K, Roth J. Alarmins of the S100-Family in Juvenile Autoimmune and Auto-Inflammatory Diseases. Front Immunol. 2019; 10:182. https://doi.org/10.3389/fimmu.2019.00182 [PubMed]
- 32. Donato R, Cannon BR, Sorci G, Riuzzi F, Hsu K, Weber DJ, Geczy CL. Functions of S100 proteins. Curr Mol Med. 2013; 13:24–57. [PubMed]
- 33. Bai Y, Li LD, Li J, Lu X. Prognostic values of S100 family members in ovarian cancer patients. BMC Cancer. 2018; 18:1256. https://doi.org/10.1186/s12885-018-5170-3 [PubMed]
- 34. Buckley NE, D’Costa Z, Kaminska M, Mullan PB. S100A2 is a BRCA1/p63 coregulated tumour suppressor gene with roles in the regulation of mutant p53 stability. Cell Death Dis. 2014; 5:e1070. https://doi.org/10.1038/cddis.2014.31 [PubMed]
- 35. Nagy N, Brenner C, Markadieu N, Chaboteaux C, Camby I, Schäfer BW, Pochet R, Heizmann CW, Salmon I, Kiss R, Decaestecker C. S100A2, a putative tumor suppressor gene, regulates in vitro squamous cell carcinoma migration. Lab Invest. 2001; 81:599–612. https://doi.org/10.1038/labinvest.3780269 [PubMed]
- 36. Li C, Chen Q, Zhou Y, Niu Y, Wang X, Li X, Zheng H, Wei T, Zhao L, Gao H. S100A2 promotes glycolysis and proliferation via GLUT1 regulation in colorectal cancer. FASEB J. 2020; 34:13333–44. https://doi.org/10.1096/fj.202000555R [PubMed]
- 37. Wang C, Luo J, Rong J, He S, Zhang L, Zheng F. Distinct prognostic roles of S100 mRNA expression in gastric cancer. Pathol Res Pract. 2019; 215:127–36. https://doi.org/10.1016/j.prp.2018.10.034 [PubMed]
- 38. Kang M, Lee HS, Lee YJ, Choi WS, Park YH, Jeong CW, Ku JH, Kim HH, Kwak C. S100A3 suppression inhibits in vitro and in vivo tumor growth and invasion of human castration-resistant prostate cancer cells. Urology. 2015; 85:273.e9–15. https://doi.org/10.1016/j.urology.2014.09.018 [PubMed]
- 39. Tao R, Wang ZF, Qiu W, He YF, Yan WQ, Sun WY, Li HJ. Role of S100A3 in human hepatocellular carcinoma and the anticancer effect of sodium cantharidinate. Exp Ther Med. 2017; 13:2812–18. https://doi.org/10.3892/etm.2017.4294 [PubMed]
- 40. Gianni M, Terao M, Kurosaki M, Paroni G, Brunelli L, Pastorelli R, Zanetti A, Lupi M, Acquavita A, Bolis M, Fratelli M, Rochette-Egly C, Garattini E. S100A3 a partner protein regulating the stability/activity of RARα and PML-RARα in cellular models of breast/lung cancer and acute myeloid leukemia. Oncogene. 2019; 38:2482–500. https://doi.org/10.1038/s41388-018-0599-z [PubMed]
- 41. Wynn TA, Vannella KM. Macrophages in Tissue Repair, Regeneration, and Fibrosis. Immunity. 2016; 44:450–62. https://doi.org/10.1016/j.immuni.2016.02.015 [PubMed]
- 42. Locati M, Curtale G, Mantovani A. Diversity, Mechanisms, and Significance of Macrophage Plasticity. Annu Rev Pathol. 2020; 15:123–47. https://doi.org/10.1146/annurev-pathmechdis-012418-012718 [PubMed]
- 43. Zhu C, Kros JM, Cheng C, Mustafa D. The contribution of tumor-associated macrophages in glioma neo-angiogenesis and implications for anti-angiogenic strategies. Neuro Oncol. 2017; 19:1435–46. https://doi.org/10.1093/neuonc/nox081 [PubMed]
- 44. Pathria P, Louis TL, Varner JA. Targeting Tumor-Associated Macrophages in Cancer. Trends Immunol. 2019; 40:310–27. https://doi.org/10.1016/j.it.2019.02.003 [PubMed]
- 45. Mantovani A, Marchesi F, Malesci A, Laghi L, Allavena P. Tumour-associated macrophages as treatment targets in oncology. Nat Rev Clin Oncol. 2017; 14:399–416. https://doi.org/10.1038/nrclinonc.2016.217 [PubMed]
- 46. Lewis CE, Hughes R. Inflammation and breast cancer. Microenvironmental factors regulating macrophage function in breast tumours: hypoxia and angiopoietin-2. Breast Cancer Res. 2007; 9:209. https://doi.org/10.1186/bcr1679 [PubMed]
- 47. Lira-Junior R, Holmström SB, Clark R, Zwicker S, Majster M, Johannsen G, Axtelius B, Åkerman S, Svensson M, Klinge B, Boström EA. S100A12 Expression Is Modulated During Monocyte Differentiation and Reflects Periodontitis Severity. Front Immunol. 2020; 11:86. https://doi.org/10.3389/fimmu.2020.00086 [PubMed]
- 48. O’Connell PA, Surette AP, Liwski RS, Svenningsson P, Waisman DM. S100A10 regulates plasminogen-dependent macrophage invasion. Blood. 2010; 116:1136–46. https://doi.org/10.1182/blood-2010-01-264754 [PubMed]
- 49. Li ZH, Dulyaninova NG, House RP, Almo SC, Bresnick AR. S100A4 regulates macrophage chemotaxis. Mol Biol Cell. 2010; 21:2598–610. https://doi.org/10.1091/mbc.e09-07-0609 [PubMed]
- 50. Dulyaninova NG, Ruiz PD, Gamble MJ, Backer JM, Bresnick AR. S100A4 regulates macrophage invasion by distinct myosin-dependent and myosin-independent mechanisms. Mol Biol Cell. 2018; 29:632–42. https://doi.org/10.1091/mbc.E17-07-0460 [PubMed]
- 51. Takenaga K, Kozlova EN. Role of intracellular S100A4 for migration of rat astrocytes. Glia. 2006; 53:313–21. https://doi.org/10.1002/glia.20284 [PubMed]
- 52. Takenaga K, Nygren J, Zelenina M, Ohira M, Iuchi T, Lukanidin E, Sjöquist M, Kozlova EN. Modified expression of Mts1/S100A4 protein in C6 glioma cells or surrounding astrocytes affects migration of tumor cells in vitro and in vivo. Neurobiol Dis. 2007; 25:455–63. https://doi.org/10.1016/j.nbd.2006.10.021 [PubMed]
- 53. Hernan R, Fasheh R, Calabrese C, Frank AJ, Maclean KH, Allard D, Barraclough R, Gilbertson RJ. ERBB2 up-regulates S100A4 and several other prometastatic genes in medulloblastoma. Cancer Res. 2003; 63:140–48. [PubMed]
- 54. Han S, Liu Y, Li Q, Li Z, Hou H, Wu A. Pre-treatment neutrophil-to-lymphocyte ratio is associated with neutrophil and T-cell infiltration and predicts clinical outcome in patients with glioblastoma. BMC Cancer. 2015; 15:617. https://doi.org/10.1186/s12885-015-1629-7 [PubMed]
- 55. Fossati G, Ricevuti G, Edwards SW, Walker C, Dalton A, Rossi ML. Neutrophil infiltration into human gliomas. Acta Neuropathol. 1999; 98:349–54. https://doi.org/10.1007/s004010051093 [PubMed]
- 56. Liang J, Piao Y, Holmes L, Fuller GN, Henry V, Tiao N, de Groot JF. Neutrophils promote the malignant glioma phenotype through S100A4. Clin Cancer Res. 2014; 20:187–98. https://doi.org/10.1158/1078-0432.CCR-13-1279 [PubMed]
- 57. Grum-Schwensen B, Klingelhöfer J, Beck M, Bonefeld CM, Hamerlik P, Guldberg P, Grigorian M, Lukanidin E, Ambartsumian N. S100A4-neutralizing antibody suppresses spontaneous tumor progression, pre-metastatic niche formation and alters T-cell polarization balance. BMC Cancer. 2015; 15:44. https://doi.org/10.1186/s12885-015-1034-2 [PubMed]
- 58. Harris MA, Yang H, Low BE, Mukherjee J, Guha A, Bronson RT, Shultz LD, Israel MA, Yun K. Cancer stem cells are enriched in the side population cells in a mouse model of glioma. Cancer Res. 2008; 68:10051–59. https://doi.org/10.1158/0008-5472.CAN-08-0786 [PubMed]
- 59. Duan L, Wu R, Zou Z, Wang H, Ye L, Li H, Yuan S, Li X, Zha H, Sun H, Zhang Y, Chen X, Zhou L. S100A6 stimulates proliferation and migration of colorectal carcinoma cells through activation of the MAPK pathways. Int J Oncol. 2014; 44:781–90. https://doi.org/10.3892/ijo.2013.2231 [PubMed]
- 60. Li A, Gu Y, Li X, Sun H, Zha H, Xie J, Zhao J, Huang M, Chen L, Peng Q, Zhang Y, Weng Y, Zhou L. S100A6 promotes the proliferation and migration of cervical cancer cells via the PI3K/Akt signaling pathway. Oncol Lett. 2018; 15:5685–93. https://doi.org/10.3892/ol.2018.8018 [PubMed]
- 61. Li P, Lv X, Zhang Z, Xie S. S100A6/miR193a regulates the proliferation, invasion, migration and angiogenesis of lung cancer cells through the P53 acetylation. Am J Transl Res. 2019; 11:4634–49. [PubMed]
- 62. Camby I, Nagy N, Lopes MB, Schäfer BW, Maurage CA, Ruchoux MM, Murmann P, Pochet R, Heizmann CW, Brotchi J, Salmon I, Kiss R, Decaestecker C. Supratentorial pilocytic astrocytomas, astrocytomas, anaplastic astrocytomas and glioblastomas are characterized by a differential expression of S100 proteins. Brain Pathol. 1999; 9:1–19. https://doi.org/10.1111/j.1750-3639.1999.tb00205.x [PubMed]
- 63. Khammanivong A, Wang C, Sorenson BS, Ross KF, Herzberg MC. S100A8/A9 (calprotectin) negatively regulates G2/M cell cycle progression and growth of squamous cell carcinoma. PLoS One. 2013; 8:e69395. https://doi.org/10.1371/journal.pone.0069395 [PubMed]
- 64. Fassl SK, Austermann J, Papantonopoulou O, Riemenschneider M, Xue J, Bertheloot D, Freise N, Spiekermann C, Witten A, Viemann D, Kirschnek S, Stoll M, Latz E, et al. Transcriptome assessment reveals a dominant role for TLR4 in the activation of human monocytes by the alarmin MRP8. J Immunol. 2015; 194:575–83. https://doi.org/10.4049/jimmunol.1401085 [PubMed]
- 65. Lim SY, Raftery MJ, Goyette J, Hsu K, Geczy CL. Oxidative modifications of S100 proteins: functional regulation by redox. J Leukoc Biol. 2009; 86:577–87. https://doi.org/10.1189/jlb.1008608 [PubMed]
- 66. Khan S, Mittal S, McGee K, Alfaro-Munoz KD, Majd N, Balasubramaniyan V, de Groot JF. Role of Neutrophils and Myeloid-Derived Suppressor Cells in Glioma Progression and Treatment Resistance. Int J Mol Sci. 2020; 21:1954. https://doi.org/10.3390/ijms21061954 [PubMed]
- 67. Ryu MJ, Liu Y, Zhong X, Du J, Peterson N, Kong G, Li H, Wang J, Salamat S, Chang Q, Zhang J. Oncogenic Kras expression in postmitotic neurons leads to S100A8-S100A9 protein overexpression and gliosis. J Biol Chem. 2012; 287:22948–58. https://doi.org/10.1074/jbc.M112.357772 [PubMed]
- 68. Arora A, Patil V, Kundu P, Kondaiah P, Hegde AS, Arivazhagan A, Santosh V, Pal D, Somasundaram K. Serum biomarkers identification by iTRAQ and verification by MRM: S100A8/S100A9 levels predict tumor-stroma involvement and prognosis in Glioblastoma. Sci Rep. 2019; 9:2749. https://doi.org/10.1038/s41598-019-39067-8 [PubMed]
- 69. Chen S, Zhao H, Deng J, Liao P, Xu Z, Cheng Y. Comparative proteomics of glioma stem cells and differentiated tumor cells identifies S100A9 as a potential therapeutic target. J Cell Biochem. 2013; 114:2795–808. https://doi.org/10.1002/jcb.24626 [PubMed]
- 70. Sade-Feldman M, Kanterman J, Ish-Shalom E, Elnekave M, Horwitz E, Baniyash M. Tumor necrosis factor-α blocks differentiation and enhances suppressive activity of immature myeloid cells during chronic inflammation. Immunity. 2013; 38:541–54. https://doi.org/10.1016/j.immuni.2013.02.007 [PubMed]
- 71. Gielen PR, Schulte BM, Kers-Rebel ED, Verrijp K, Bossman SA, Ter Laan M, Wesseling P, Adema GJ. Elevated levels of polymorphonuclear myeloid-derived suppressor cells in patients with glioblastoma highly express S100A8/9 and arginase and suppress T cell function. Neuro Oncol. 2016; 18:1253–64. https://doi.org/10.1093/neuonc/now034 [PubMed]
- 72. Wang S, Song R, Wang Z, Jing Z, Wang S, Ma J. S100A8/A9 in Inflammation. Front Immunol. 2018; 9:1298. https://doi.org/10.3389/fimmu.2018.01298 [PubMed]
- 73. Hansen MT, Forst B, Cremers N, Quagliata L, Ambartsumian N, Grum-Schwensen B, Klingelhöfer J, Abdul-Al A, Herrmann P, Osterland M, Stein U, Nielsen GH, Scherer PE, et al. A link between inflammation and metastasis: serum amyloid A1 and A3 induce metastasis, and are targets of metastasis-inducing S100A4. Oncogene. 2015; 34:424–35. https://doi.org/10.1038/onc.2013.568 [PubMed]
- 74. Wang L, Yan W, Li X, Liu Z, Tian T, Chen T, Zou L, Cui Z. S100A10 silencing suppresses proliferation, migration and invasion of ovarian cancer cells and enhances sensitivity to carboplatin. J Ovarian Res. 2019; 12:113. https://doi.org/10.1186/s13048-019-0592-3 [PubMed]
- 75. Noye TM, Lokman NA, Oehler MK, Ricciardelli C. S100A10 and Cancer Hallmarks: Structure, Functions, and its Emerging Role in Ovarian Cancer. Int J Mol Sci. 2018; 19:4122. https://doi.org/10.3390/ijms19124122 [PubMed]
- 76. Lu H, Xie Y, Tran L, Lan J, Yang Y, Murugan NL, Wang R, Wang YJ, Semenza GL. Chemotherapy-induced S100A10 recruits KDM6A to facilitate OCT4-mediated breast cancer stemness. J Clin Invest. 2020; 130:4607–23. https://doi.org/10.1172/JCI138577 [PubMed]
- 77. Phipps KD, Surette AP, O’Connell PA, Waisman DM. Plasminogen receptor S100A10 is essential for the migration of tumor-promoting macrophages into tumor sites. Cancer Res. 2011; 71:6676–83. https://doi.org/10.1158/0008-5472.CAN-11-1748 [PubMed]
- 78. Tu Y, Xie P, Du X, Fan L, Bao Z, Sun G, Zhao P, Chao H, Li C, Zeng A, Pan M, Ji J. S100A11 functions as novel oncogene in glioblastoma via S100A11/ANXA2/NF-κB positive feedback loop. J Cell Mol Med. 2019; 23:6907–18. https://doi.org/10.1111/jcmm.14574 [PubMed]