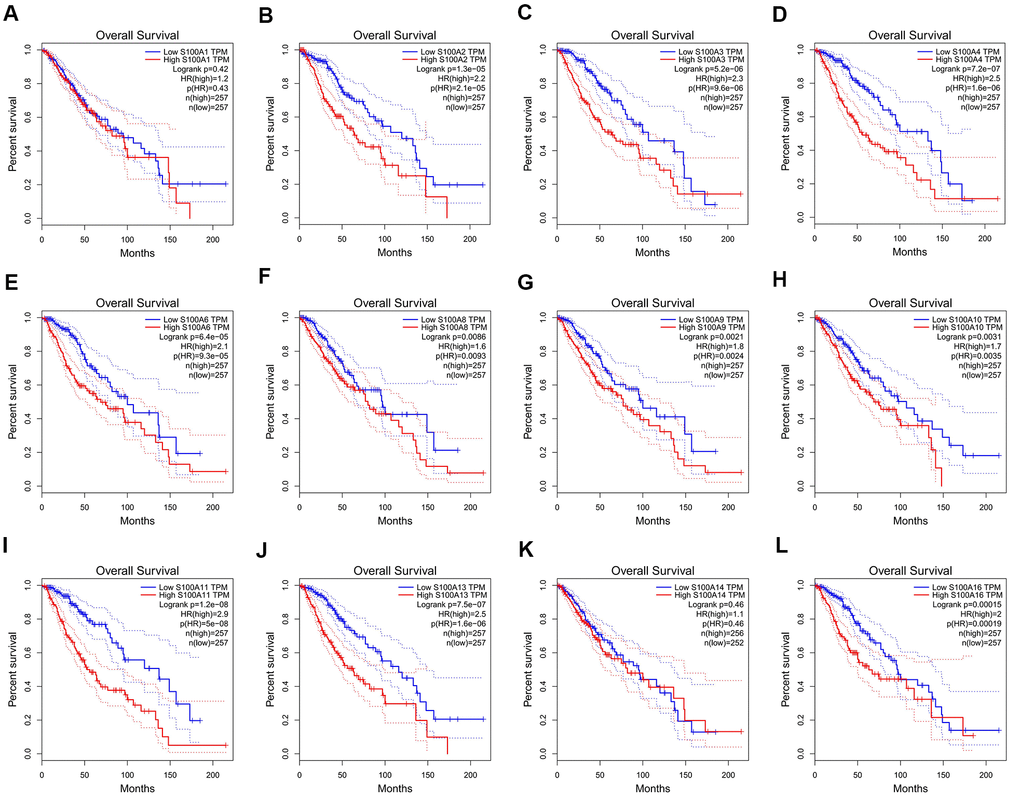
Figure 6.Relationship between the gene expression level of S100A family members and overall survival of LGG patients. (A) S100A1, (B) S100A2, (C) S100A3, (D) S100A4, (E) S100A6, (F) S100A8, (G) S100A9, (H) S100A10, (I) S100A11, (J) S100A13, (K) S100A14, (L) S100A16.