Submit an Article
Navigate
Home
Editorial Board
Editorial Policies
Current Volume
Archive
Scientific Integrity
Publication Ethics Statements
Interviews with Outstanding Authors
Newsroom
Sponsored Conferences
Podcast
Contact
Special Collections
Submit an Article
Online ISSN: 1945-4589
Research Paper
|
Volume 13, Issue 11
|
pp. 15459–15478
S100A gene family: immune-related prognostic biomarkers and therapeutic targets for low-grade glioma
Back to article
Figure 7
(7 of 11)
−
100%
+
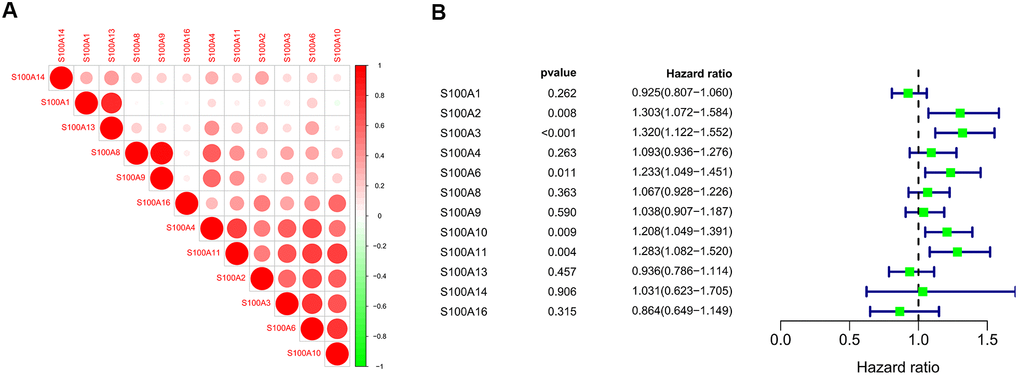
Figure 7.
(
A
) Correlation analysis of S100A family genes of LGG samples in CGGA; (
B
) COX regression analysis of S100A family genes of LGG samples in CGGA.