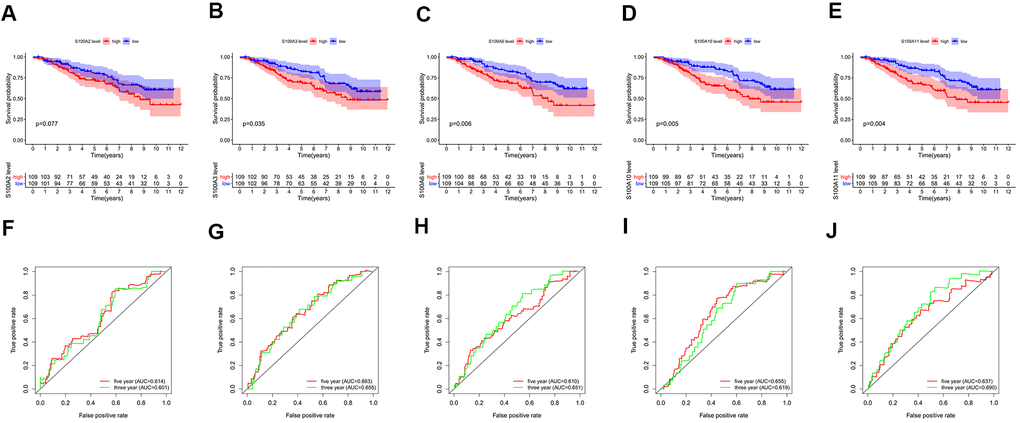
Figure 8.Survival analysis for high and low expression groups of prognosis-related genes: (A) S100A2, (B) S100A3, (C) S100A6, (D) S100A10, (E) S100A11. ROC curves for 3-year and 5-year survival of prognosis-related genes: (F) S100A2, (G) S100A3, (H) S100A6, (I) S100A10, (J) S100A11.