


Introduction
Lung cancer is the leading cause of cancer deaths worldwide. Human lung cancers are classified into two major histologic types, small-cell lung cancer and non-small-cell lung cancer (NSCLC), the latter comprising several subtypes. Previously, lung squamous cell carcinoma was the predominant form of NSCLC, but in the last few decades it has been replaced by lung adenocarcinoma (LUAD). Moreover, LUAD is the most common type of lung cancer in women, non-smokers, and young people [1].
Epigenetic changes in tumor tissue are involved in the pathogenesis of cancer. DNA methylation is a well-studied epigenetic alteration in cancer, owing in part to recent developments in techniques for genome-wide DNA methylation profiling [2, 3]. DNA methylation is the covalent addition of a methyl group to the 5th carbon of the cytosine base within the cytosine-guanine (CpG)-dinucleotide in DNA. This has been shown to change the chromatin structure and affect the binding of transcription factors to DNA, and may thus regulate gene expression [4]. Recently, a novel DNA modification, N-6 methylated deoxyadenosine (m6dA), has been discovered in eukaryotic genomes [5]. Despite its low abundance in eukaryotes, m6dA is implicated in human diseases such as cancer. In NSCLC, several DNA methylation changes have been reported in association with neoplastic transformation, and some have been proposed as potential biomarkers with clinical relevance for diagnosis, prognosis, and response to therapy [6].
The KEAP1–NRF2 pathway plays a critical role in oxidative stress responses by triggering antioxidant and anti-inflammatory effects [7, 8]. In healthy tissue, KEAP1 counteracts NRF2 by leading to its degradation [9, 10]. After exposure to oxidative stress, KEAP1 is inactivated and no longer able to bind and control NRF2, which is subsequently stabilized and translocated into the nucleus [11, 12]. There, NRF2 promotes the transcription of genes encoding detoxification enzymes and antioxidant proteins [13].
Although cytoprotection by NRF2 activation is important for cancer chemoprevention in normal and pre-malignant tissues, in fully malignant cells NRF2 activity provides a growth advantage by increasing chemoresistance and enhancing tumor cell growth [14]. Somatic mutations in KEAP1 lead to activation of the NRF2 signaling pathway in various cancers. Constitutively abundant NRF2 protein causes the increased expression of genes involved in drug metabolism, thereby increasing the resistance to chemotherapeutic drugs and radiotherapy [15]. In addition, over-expression of NRF2 also promotes cell proliferation and metastasis [16].
In this study, we analyzed TCGA (The Cancer Genome Atlas) 450k methylation data of LUAD patients in order to identify alterations of DNA methylation pattern associated with KEAP1 mutations. Furthermore, we used TCGA RNA-Seq gene expression data of LUAD patients to investigate the association of these DNA methylation changes with gene expression. Eventually, we identified 8-gene biomarker for LUAD patients with mutated KEAP1 based on aberrant DNA methylation associated with KEAP1 mutations, and we evaluated the prognostic value of the 8-gene biomarker in several clinical datasets.
Results
The main goal of this study is to identify DNA methylation and gene expression changes associated with KEAP1 mutations in LUAD. In order to achieve this goal, LUAD patient samples that have gene mutation, DNA methylation and gene expression data were required. The only source that provides such data for the same patient simultaneously is TCGA. Therefore, we conducted our study using TCGA data and we divided the patients into two groups, discovery cohort and another group to validate (validation cohort) the findings from the discovery cohort. We checked the TCGA–LUAD mutation data using the UCSC Xena browser and found that, of 544 LUAD patients with mutation data, only 98 had KEAP1 mutations (18%). We also found that only 77 of 98 KEAP1-mutant patients had both DNA methylation and gene expression data. TCGA published the mutation and gene expression data of 230 LUAD samples in 2014 [17]. Of these 230 LUAD samples, we found 185 samples have DNA methylation data (30 with KEAP1 mutations and 155 have no KEAP1 mutation) and we considered this group of patients as our discovery cohort. Then, we randomly selected another 185 LUAD patients (30 have KEAP1 mutations and 155 have no KEAP1 mutation) with both DNA methylation and gene expression data and we considered this group of patients as our validation cohort. In addition, the frequency of mutation of other common driver genes of LUAD, such as TP53 and KRAS, was maintained very close between the KEAP1-mutated and wild-type groups. Therefore, none of these driver genes was considered as a variable that can contribute to methylation changes between the two groups. Also, all the patients included in the two groups have smoking history. So, this eliminated smoking as a contributing factor for any methylation changes found between the two groups.
Overview of KEAP1 mutations in LUAD
In order to better understand the mutational landscape of KEAP1 in LUAD, we used the USCS Xena browser to examine the types of mutations and their positions in the domain structure of KEAP1 protein. We found that 18% (98 of 544) of the patient samples had KEAP1 mutations. Among these, 75.5% (74 of 98) had missense mutations, while 8.1% (8 of 98) were nonsense mutations, 4.1% (4 of 98) were splice site mutations, 10.2% (10 of 98) were frame-shift mutations, and 2% (2 of 98) were silent mutations (Figure 1A). KEAP1 consists of 605 amino-acids, and 3 main domains with 22 mutations have been reported in the BTB (broad-complex, tramtrack, and bric-a-brac) domain, 21 in the IVR (intervening region), and 42 in the Kelch domain (Figure 1B). Our discovery dataset had 30 patient samples with KEAP1 mutations: 26 had missense mutations while 4 had truncating mutations.
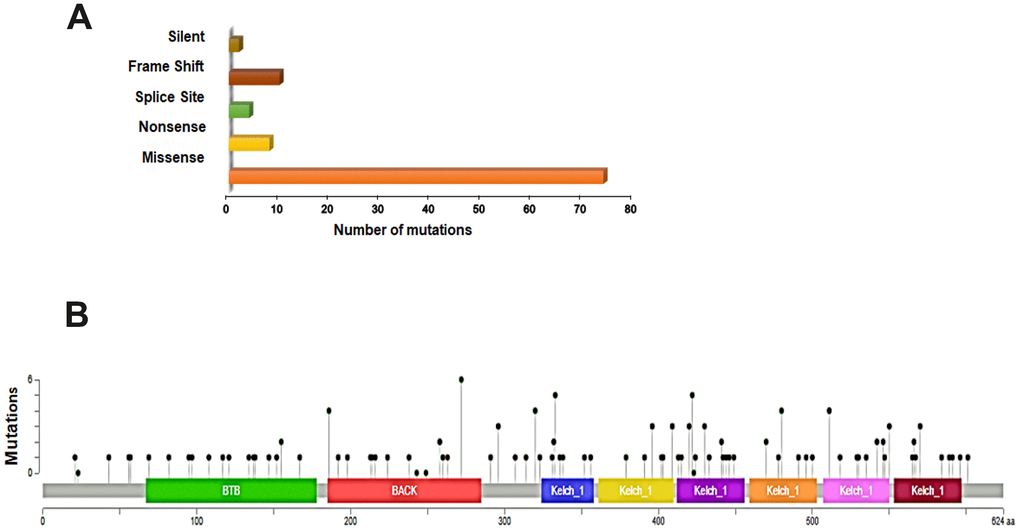
Figure 1. Overview of genetic changes in KEAP1 in TCGA–LUAD patients. (A) Bar chart showing the types and numbers of mutations of KEAP1. (B) OnkoKB-predicted mutation maps (lollipop plots) showing the locations of mutations in the functional domains of KEAP1 proteins. The lollipops show the locations of the mutations as identified by whole-exon sequencing.
Aberrant DNA methylation is associated with KEAP1 mutation in LUAD patients
In order to identify the association of KEAP1 mutations with DNA methylation in LUAD patients, we explored the differentially-methylated CpG sites between the KEAP1-mutated (30 patient samples) and wild-type (155 patient samples without KEAP1 mutations) LUAD samples. A total of 137 differentially-methylated CpG sites were found between KEAP1-mutated and wild-type tumor samples after Benjamini Hochberg-false discovery rate (BH-FDR) adjustment (delta β > |0.2|, P <0.05) (Figure 2A, a). We found that 84.67% (116 of 137) of the CpG sites were hypomethylated, while 15.33% (21 of 137) were hypermethylated (Supplementary File 3) (Figure 2A, b). These findings suggest that most of the DNA methylation changes associated with KEAP1 mutations are hypomethylation. To gain insight on this pattern, we divided the probes according to genomic localization, types of transcripts and chromosomal position. Genomic regions were divided into CpG islands which are genomic regions with high frequency of CpG sites; S-shores (regions up to 2 kb from CpG island in the south direction); N-shores (regions up to 2 kb from CpG island in the north direction); S-shelves (regions from 2 to 4 kb from CpG island in the south direction); N-shelves (regions from 2 to 4 kb from CpG island in the north direction) and open sea, in other words, the rest of the genome. Of these 116 hypomethylated CpG sites we were able to annotate 105 to the reference genome and found that 47 (44.7%) were in open sea, 20 (19.04%) in island, 19 (18.09 %) in S-shore,12 (11.4%) in N-shore, 5 (4.7%) in S-shelf, and 2 (1.9%) in N-shelf; in addition, 100 (95.2%) were in coding RNA-transcribed regions, while only five (4.76%) were in non-coding RNA transcribed-regions. The hypomethylated CpGs were functionally distributed as follow: 29 CpG (32.2%) were in promoter region, 19 (21.1%) were in 5′ untranslated region (UTR)/1st exon, while 41 (46.6%) were in gene body. Among the 21 hypermethylated CpG sites, 14 CpG (70%) were in promoter region, 2 (10%) were in 5′ UTR)/1st exon, while 4 (20%) were in gene body. In addition, 9 (42.8%) were in open sea, 8 (38.1%) in island, and 4 (19%) in N-shore. Besides, 18 of these hypermethylated CpG sites were in coding RNA-transcribed regions (Figure 2A, c).
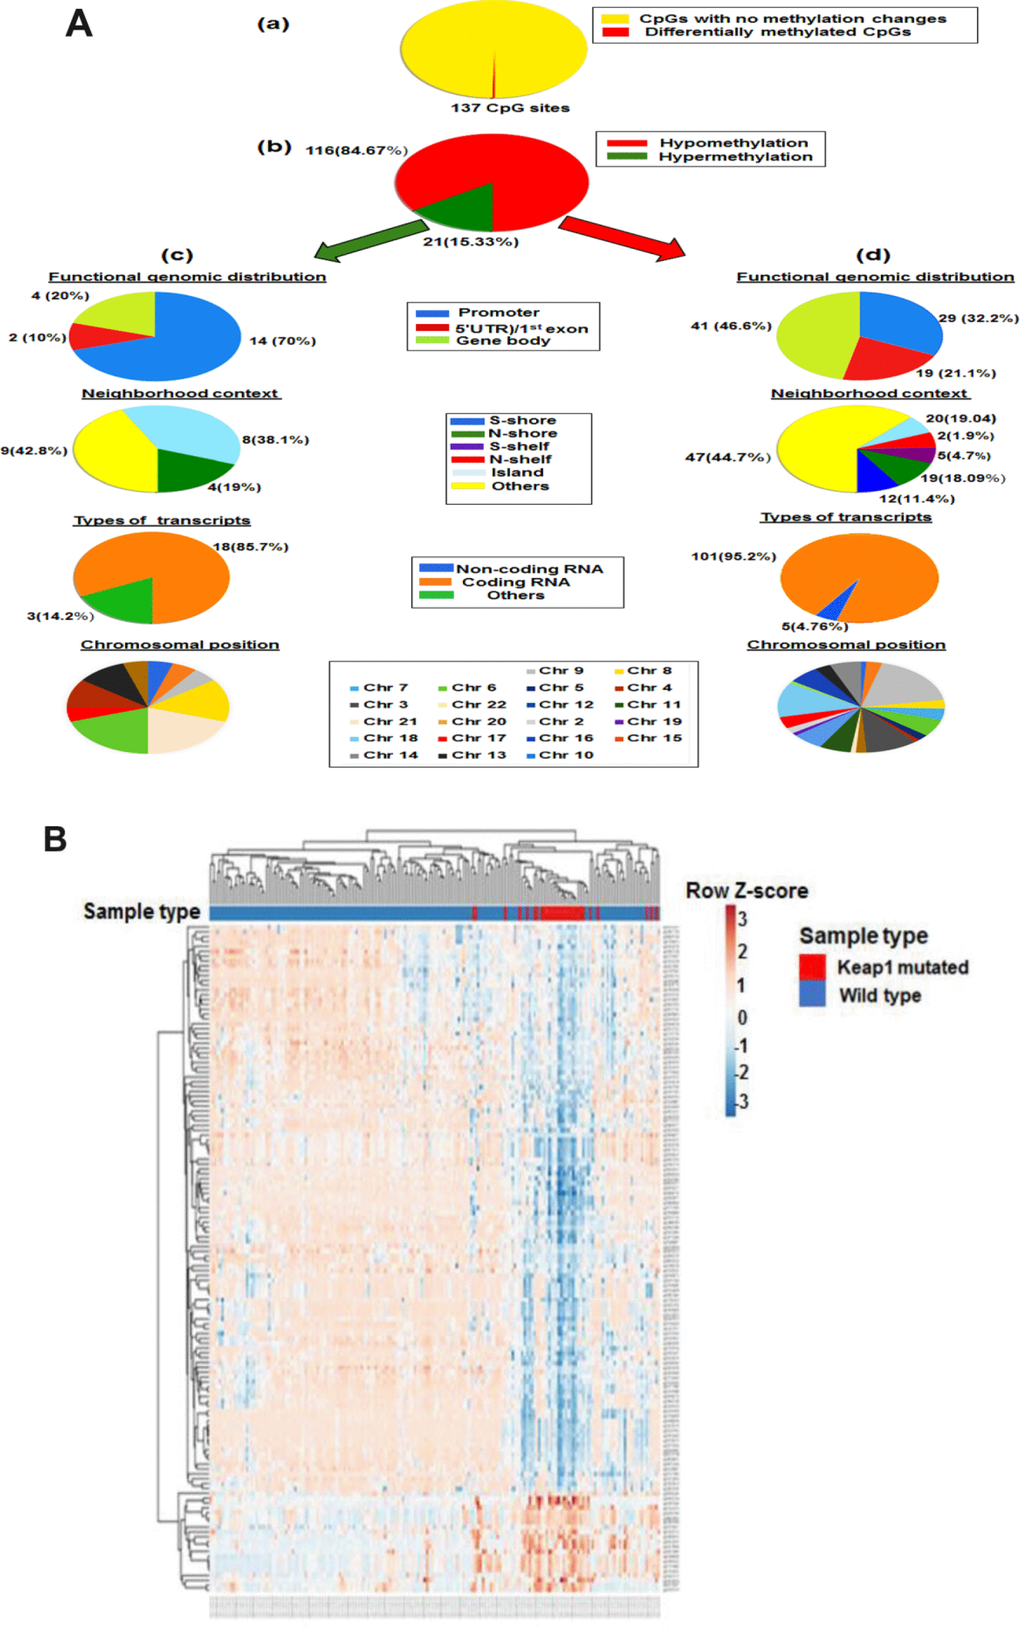
Figure 2. Differential methylation analysis of KEAP1-mutated vs wild-type LUAD patients. (A) Graphic showing 450k DNA methylation analysis. (a) Differentially-methylated CpG sites in KEAP1-mutated vs wild-type patient samples. (b) Percentages of hypomethylation and hypermethylation. (c) Distribution of hypermethylated CpG sites in KEAP1-mutated patient samples according to functional genomic distribution, neighborhood context, associated RNA transcripts, and chromosomal location. (d) Distribution of hypomethylated CpG sites in KEAP1-mutated patient samples according to functional genomic distribution, neighborhood context, associated RNA transcripts, and chromosomal location. (B) Heatmap showing the differentially-methylated CpG sites in KEAP1-mutated LUAD patients compared to their wild type counterparts (delta β >|0.2|, p<0.05 with BH-FDR adjustment). Methylation Beta-values are represented as row Z-score. The blue color indicates decreased methylation of CpG while the pink color indicates increased methylation of CpG. The heatmap was generated using the ClustVis webtool.
The chromosomal distribution of both hypo and hyper methylated CpG sites were listed in Supplementary Table 1. Our data showed that DNA methylation in the KEAP1-mutated lung adenocarcinoma compared to their wild-type counterparts followed a distinct pattern along the gene coding sequence, with lower methylation levels near the transcription start site and gene body while higher methylation levels were mostly detected near the transcription start site. In addition, majority of hypomethylated CpGs were in open sea while majority of hypermethylated CpGs were in open sea and island. Moreover, the differentially-methylated CpG sites were embedded into 96 genes. Gene ontology (GO) and Kyoto Encyclopedia of Genes and Genomes (KEGG) pathway analyses showed that the differentially-methylated genes were enriched in biological processes and pathways related to cellular response to oxidative stress such as glutathione metabolism. The methylation profiles of 30 KEAP1-mutated and 155 wild-type LUAD patient samples were visualized on a heatmap produced by unsupervised hierarchical clustering. Major differences between the DNA methylation patterns enabled cluster analysis to discriminate between sample types. Significant differences or trends between KEAP1-mutated and non-KEAP1-mutated LUAD patient samples were detectable at 137 loci (Figure 2B). In addition, the overall methylation difference between KEAP1-mutated and non-KEAP1-mutated LUAD patient samples was highly significant.
To validate the association of KEAP1 mutation with the methylation of these CpG sites, we subjected the KEAP1-mutated versus normal samples to differential methylation analysis. In this data set, a total of 24,412 CpG sites were found to be differentially methylated after FDR adjustment (delta β >|0.2|, P <0.05) (Figure 3A, a). Of these sites, 10,273 were hypermethylated and 14,139 were hypomethylated (Figure 3A, b) (Supplementary File 4). Among the hypermethylated CpG sites, we found that 1,461 (14.2%) were in open sea, 5,857 (57%) in island, 1,248 (12.1%) in S-shore, 1,345 (13.1%) in N-shore, 182 (1.7%) in S-shelf, and 158 (1.5%) in N-shelf; in addition, 6,708 (65.2%) were in coding RNA-transcribed regions, while 639 (6.2%) were in non-coding RNA-transcribed regions (Figure 3A, c). The hypermethylated CpGs were functionally distributed as follow: 2,274 CpG (27.3%) were in promoter region, 587 (7.05%) were in 5′UTR)/1st exon, while 5,464 (65.6%) were in gene body. Among the hypomethylated sites, 4,661 CpG (44.7%) were in promoter region, 2,561 (24.6%) were in 5′UTR)/1st exon, while 3,190 (30.6%) were in gene body. In addition, 8,773 (62.7%) were in open sea, 960 (6.8%) in island, 1,266 (9%) in S-shore, 1,449 (10.6%) in N-shore, 848 (6%) in S-shelf, and 788 (5.6%) in N-shelf; in addition, 8,205 (58.6%) were in coding RNA-transcribed regions, while 1,130 (13.7%) were in non-coding RNA-transcribed regions (Figure 3A, d). The chromosomal distribution of both hypo and hyper methylated CpG sites were listed in Supplementary Table 2. Overall, DNA methylation in KEAP1-mutated lung adenocarcinoma compared to normal tissues followed a distinct pattern along the gene coding sequence, with lower methylation levels mostly near the transcription start site and higher methylation levels mostly at gene body. In agreement with various cancers, majority of hypermethylated CpGs were in island while majority of hypomethylated CpGs were in open sea [18, 19].
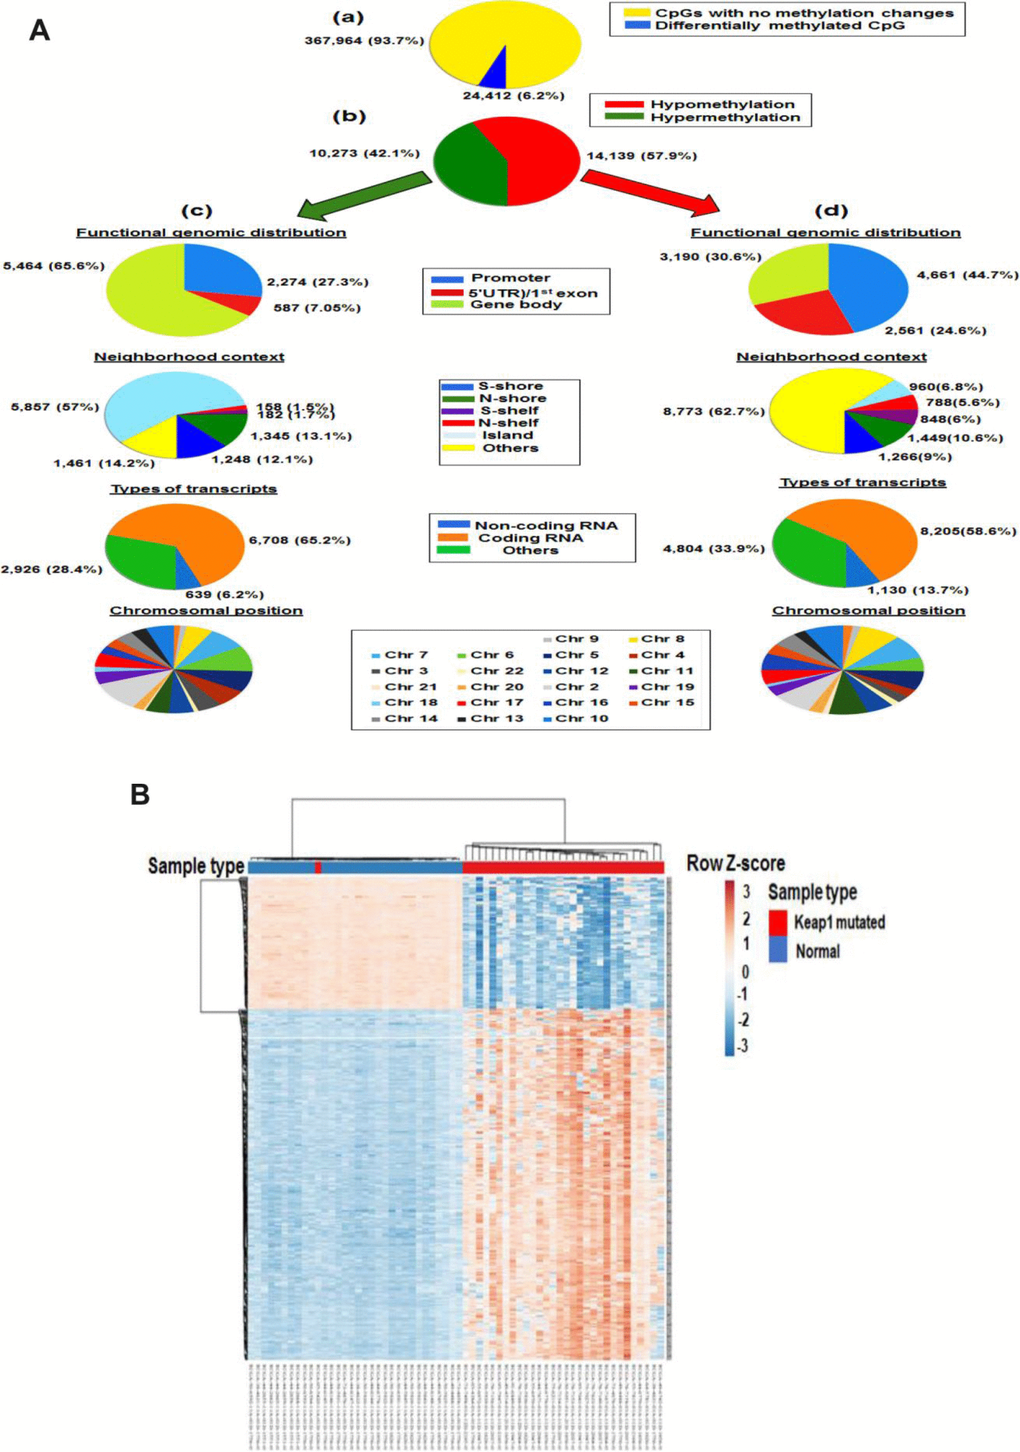
Figure 3. Differential methylation analysis of samples from KEAP1-mutated LUAD patients vs normal samples. (A) Graphic showing 450k DNA methylation analysis. (a) Graphic showing percentage of differentially-methylated CpG sites in KEAP1-mutated LUAD patients compared to normal samples. (b) Percentages of hypomethylation and hypermethylation. (c) Distribution of hypermethylated CpG sites in KEAP1-mutated patient samples according to functional genomic distribution, neighborhood context, associated RNA transcripts, and chromosomal location. (d) Distribution of hypomethylated CpG sites in KEAP1-mutated patient samples according to functional genomic distribution, neighborhood context, associated RNA transcripts, and chromosomal location. (B) Heatmap showing the differentially-methylated CpG sites in KEAP1-mutated LUAD patients compared to normal individuals (delta β >|0.4|, p <0.05 with BH-FDR adjustment). Methylation Beta-values are represented as row Z-score. The blue color indicates decreased CpG methylation while the pink color indicates increased CpG methylation. The heatmap was generated using the ClustVis webtool.
Altogether, the data obtained from the KEAP1-mutated lung adenocarcinoma followed the previous reports of Genome-wide DNA methylation patterns in lung cancer [19, 20]. In addition, KEAP1-mutated lung adenocarcinoma showed distinctive DNA methylation pattern which make it distinguishable from their wild-type counterparts.
Also, we used unsupervised hierarchical clustering to visualize the major differences between the DNA methylation patterns of 30 KEAP1-mutated LUAD patient samples and 32 from normal individuals. The heatmap showed clustering of the top 521 differentially-methylated loci (Figure 3B).
Then, integration analysis was performed between the differentially-methylated CpG sites found in the mutated KEAP1 versus the wild-type and mutated KEAP1 versus normal datasets in order to identify overlapping differentially-methylated CpG sites. We found 109 common differentially-methylated CpG sites (representing 80 genes) (Figure 4). Interestingly, 94 of these sites were hypomethylated and 15 were hypermethylated. Surprisingly, we found several differentially-methylated CpG sites that belonged to several bonafide NRF2 target genes such as GPX2, TXNRD1, GCLC, PGD, SRXN1, AKR1C1, AKR1C2, ABCC1, ABCC2, MAFG, and SQSTM1 (Table 1). KEAP1 dysfunction and increased NRF2 accumulation in the nucleus have been frequently reported in lung cancer. Moreover, changes in the KEAP1–NRF2 pathway and their association with tumor progression, resistance to chemotherapeutic drugs, and poor prognosis have been well documented [21]. In addition, we found cg10880599, cg04909257, cg04806177, cg23230478, cg00926657, cg03331715, cg02731193, and cg19648686 that belonged to the GPX2, PGD, MSRB1, ACOT7, MAFG, TXNRD1, GCLC, and AKR1C1 genes, respectively, in the top list of hypomethylated CpG sites. On the other hand, we found Cg25693302 and Cg15733882 of the NEDD4L gene as well as Cg02370667 and Cg22167353 of the NECAB2 gene, besides Cg06632214 and Cg00474080 that belonged to the IFITM1 and HCG21 genes, respectively, in the top list of hypermethylated CpG sites.
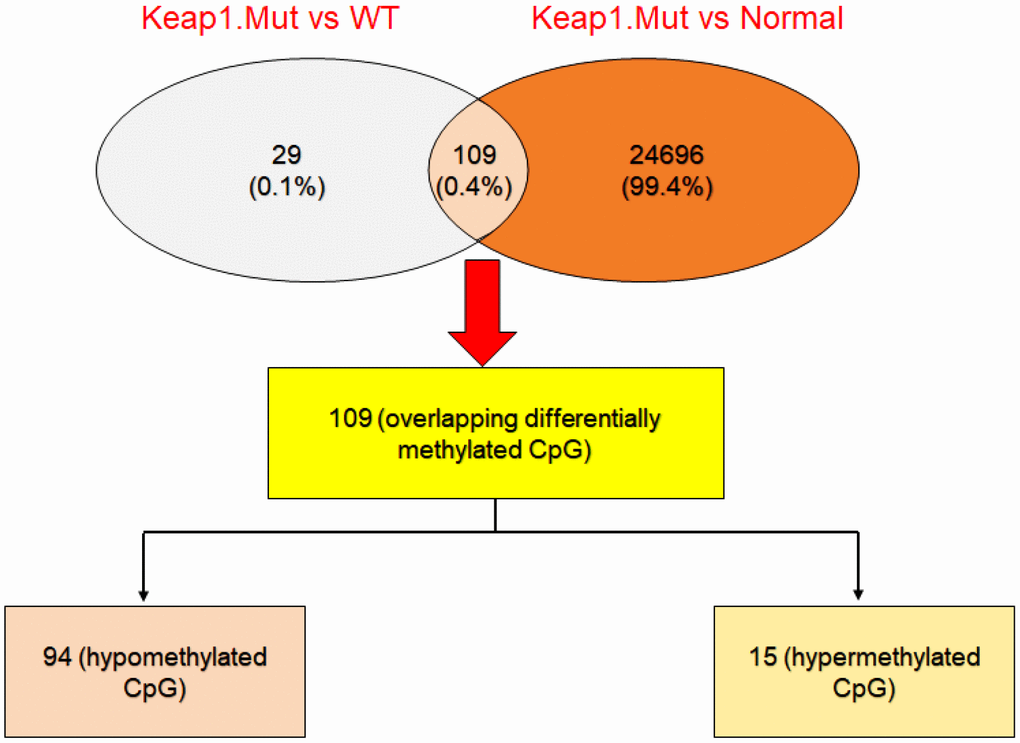
Figure 4. Integrative analysis to cross-check the differentially-methylated CpG sites in KEAP1-mutated LUAD. Venny diagram showing the differentially-methylated CpG sites overlapping between KEAP1-mutated versus wild-type and KEAP1-mutated versus normal datasets.
Table 1. The top listed differentially-methylated CpG sites between KEAP1-mutated and wild-type LUAD patient samples.
| Hypomethylated CpG sites | Hypermethylated CpG sites | ||||||
| CpG name | Gene symbol | Delta Beta | P value | CpG name | Gene symbol | Delta Beta | P value |
| cg10880599 | GPX2 | -0.38 | 1.60E-10 | Cg25693302 | NEDD4L | 0.275 | 3.2488E-11 |
| cg04909257 | PGD | -0.36 | 3.11E-09 | Cg06632214 | IFITM1 | 0.259 | 2.0889E-05 |
| cg04806177 | MSRB1 | -0.35 | 1.94E-07 | Cg02370667 | NECAB2 | 0.241 | 2.7964E-07 |
| cg23230478 | ACOT7 | -0.348 | 7.81E-08 | Cg15733882 | NEDD4L | 0.231 | 2.1958E-10 |
| cg00926657 | MAFG | -0.343 | 2.79E-09 | Cg22167353 | NECAB2 | 0.229 | 3.7118E-07 |
| cg03331715 | TXNRD1 | -0.3437 | 5.91E-09 | Cg00474080 | HCG21 | 0.222 | 3.5719E-05 |
| cg02731193 | GCLC | -0.340 | 7.64E-08 | Cg15245625 | NEDD4L | 0.220 | 3.6348E-12 |
| cg19648686 | AKR1C1 | -0.333 | 5.60E-09 | Cg00225623 | SPATA13 | 0.214 | 2.6977E-06 |
| cg19648686 | AKR1C2 | -0.333 | 5.60E-09 | Cg04579966 | SPATA13 | 0.213 | 4.7484E-05 |
| cg09643186 | GPX2 | -0.330 | 1.78E-09 | Cg14186816 | NEDD4L | 0.212 | 2.8999E-11 |
| cg26155983 | GPX2 | -0.321 | 5.74E-08 | Cg13656752 | STK10 | 0.210 | 1.6346E-06 |
| cg09489844 | MAFG | -0.320 | 2.31E-09 | Cg03030717 | TBC1D30 | 0.203 | 0.00037491 |
| cg18484212 | SRXN1 | -0.310 | 1.30E-06 | Cg08781140 | MYO15B | 0.202 | 0.00014414 |
| cg23012192 | SQSTM1 | -0.305 | 1.07E-06 | cg19378330 | ABCC2 | 0.201 | 9.8216E-05 |
| cg20372666 | HK1 | -0.285 | 8.62E-10 | ||||
| cg04020792 | ATP2A2 | -0.277 | 2.02E-05 | ||||
| cg19509829 | ATP2A2 | -0.268 | 4.97E-06 | ||||
| cg14420550 | RP11-146I2.1 | -0.262 | 2.11E-07 | ||||
| cg18496841 | DLGAP2 | -0.254 | 6.94E-07 | ||||
| cg01189072 | CDK11B | -0.250 | 4.45E-05 | ||||
| cg05116443 | DNAJC5 | -0.249 | 2.58E-06 | ||||
In silico analysis identifies the known and putative NRF2 binding sites in the promoter regions of differentially-methylated genes
As KEAP1 mutations lead to enhanced NRF2 activity, we investigated whether the differentially-methylated genes are potential NRF2 targets. To this end, we used a transcription factor perturbation-related gene expression database – enrichr (http://amp.pharm.mssm.edu/Enrichr/) – to determine whether 80 of these differentially-methylated genes were downregulated when NRF2 was knocked out, knocked down, or mutated in different cell lines and mouse models (Figure 5A, 5B). Intriguingly, 22 of the 80 differentially-methylated genes were downregulated. Further, we found that 11 of them were known NRF2 target genes. To identify the putative and known antioxidant responsive elements (AREs) (Figure 5C) in the other 11 genes, we used the LASAGNA-Search 2.0 web tool [22]. Interestingly, as Figure 5D showed positions of NRF2 binding sites (AREs) in the promoter regions of human ACOT7, LNOP2, SCNN1A, and BRF2 genes, in silico analysis identified putative ARE sequences within the –5 kb upstream promoter regions of all 11 genes (Supplementary File 5).
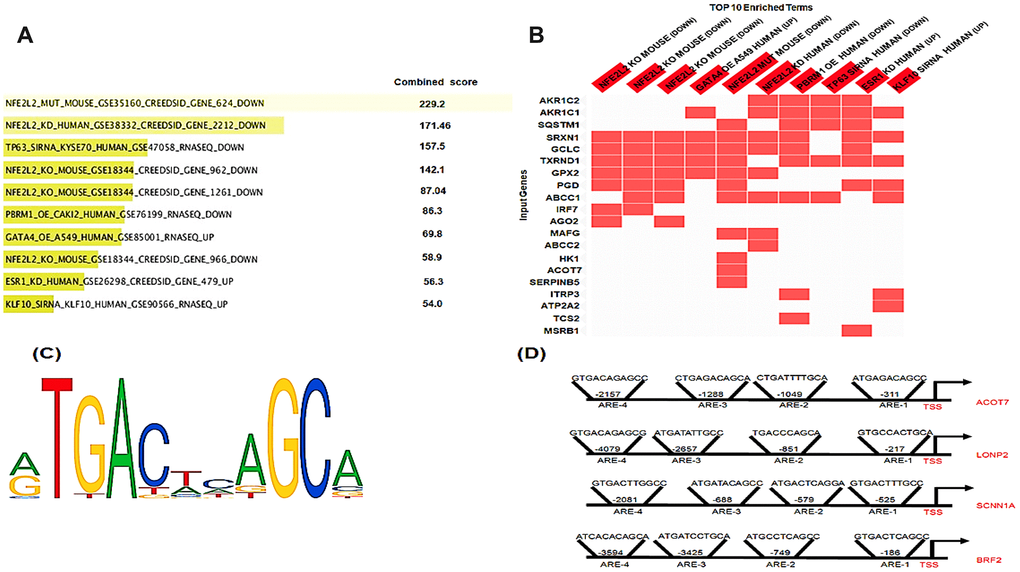
Figure 5. In silico analysis of NRF2 binding sites. (A) Bar graph showing the top 10 enriched transcription factor perturbation followed by expression datasets (highest p value) after the input of the 80 differentially methylated genes using enrichr database. 5 data sets where NRF2 was Perturbed among the top 10 enriched terms (highest p value). (B) Heatmap showing the differentially-methylated genes (20 genes) that were enriched in any of the top 10 enriched terms. The heatmap shows 15 out of these 20 genes enriched in 5 datasets where NRF2 was Perturbed. (C) The NRF2 binding motif as provided by JASPER. (D) Schematic representation of the locations of in silico-predicted NRF2 binding sites (AREs) in the promoter regions of the human ACOT7, LNOP2, SCNN1A, and BRF2 genes.
Differentially-expressed genes (DEGs) associated with KEAP1 mutation in LUAD patients
In order to investigate the effect of changes in DNA methylation associated with KEAP1 mutations on gene expression, we subjected the discovery data set (30 KEAP1-mutated versus 155 wild-type tumor samples) to DEG analysis. A total of 6,026 differentially-expressed genes (P <0.05) were identified (Supplementary File 6). Of these, we found that 2,404 genes were upregulated while 3,622 were downregulated (Figure 6A, 6B). Then, unsupervised hierarchical clustering was applied using the ‘ClustVis’ tool. The major differences between the gene expression patterns of KEAP1-mutated and wild-type LUAD patient samples enabled cluster analysis (Figure 6C). The heatmap showed clustering of the top DEGs with log Fc> |2|. Then, we integrated the differentially-methylated genes (β>|0.2|, P <0.05) with the DEGs (P <0.05), and found 36 overlapping genes with 50 differentially-methylated CpG sites. In addition, 30 (38 CpG sites) of these 36 genes were hypomethylated, while the remaining 6 (12 CpG sites) were hypermethylated (Supplementary File 7).
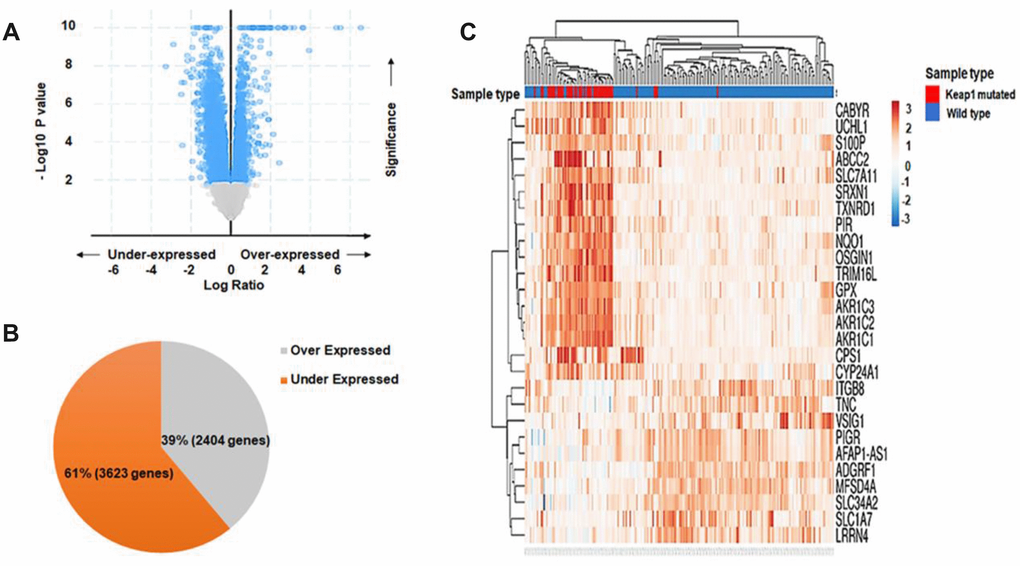
Figure 6. Differential gene expression analysis. (A) Volcano plot showing the distribution of DEGs between KEAP1-mutated and wild-type LUAD patient samples based on significance and fold change. (B) Pie chart showing the percentages of overexpressed and underexpressed genes. (C) Heatmap showing the top DEGs between KEAP1-mutated and wild-type LUAD patient samples with Log Fc>|2| and p <0.05.
It has been reported that KEAP1 mutations lead to the overexpression of NRF2 and its downstream genes in lung cancer. Thus, it was not surprising that we found many NRF2 target genes among the top list of upregulated genes in KEAP1-mutated LUAD patients with log Fc >1.5, including NQO1, GCLM, GCLC, AKR1C3, AKR1C2, AKR1C1, GPX2, TXNRD1, ABCC2, G6PD, UGDH, TRIM16, TRIM16L, PGD, CY924A1, and OSGIN1. Surprisingly, we found that several of the NRF2-regulated genes in this list were differentially- methylated (GCLC, GPX2, TXNRD1, AKR1C, AKR1C2, SRXN1, PGD, and ABCC2). Most of these had hypomethylated CpG sites, except for ABCC2 that was hypermethylated at a CpG site within the gene body. These findings suggest that DNA methylation alterations associated with KEAP1 mutations may synergize with NRF2 in regulating gene expression. However, we found 9 known NRF2 target genes (NQO1, GCLM, AKR1C3, G6PD, UGDH, TRIM16, TRIM16L, OSGIN1, and CY924A1) that did not show any DNA methylation changes in KEAP1-mutated tumor samples. This suggested that these genes are primarily regulated by NRF2. Interestingly, OPN3 showed hypomethylation and overexpression with a fold-change of 1.48. OPN3 has not been reported as an NRF2 target gene and in silico analysis showed that it was not a putative NRF2 target gene. The molecular mechanism of OPN3 overexpression remains unclear.
Identification of gene signatures associated with KEAP1 mutation in LUAD
In order to identify a DNA methylation and gene expression signature for KEAP1-mutated LUAD, we first subjected the 36 genes that had differentially-methylated CpG sites to functional annotation analysis using DAVID (Database for Annotation, Visualization and Integrated Discovery) and enrichr. Functional annotation analysis from GO (Gene Ontology) and KEGG (Kyoto Encyclopedia of Genes and Genomes) pathway prediction using DAVID and enrichr, respectively, revealed that the 36 genes were enriched (P <0.01) in the following biological processes: Response to oxidative stress, Oxidation-reduction process, Cellular response to oxidative stress, Cellular response to jasmonic acid, and Cellular oxidant detoxification (Figure 7A, 7B). In the KEGG pathway analysis, we found enrichment (P <0.05) in pathways such as Glutathione metabolism, Aldosterone-regulated sodium reabsorption, ABC transporters, Selenocompound metabolism, Steroid hormone biosynthesis metabolism, Vitamin digestion and absorption, Thyroid hormone synthesis, and Taste transduction. Next, we selected the genes from the top three significant GO biological processes (Oxidative stress, Oxidation-reduction process, and Cellular response to oxidative stress). The selected genes were GPX2, GCLC, TXNRD1, AKR1C1, AKR1C2, PGD, SRXN1, MSRB1, BRF2, ABCC2, and ATP2A2. Then, we excluded BRF2 and ATP2A2 as they had an expression fold-change < 1. Eventually, 9 oxidative stress-related genes with 11 differentially-methylated CpG sites were obtained. Three of these sites belonged to GPX2 (cg10880599, cg09643186, and cg26155983 were located in the gene body, 5′ untranslated region (UTR)/1st exon, and within 1,500 bp upstream the transcriptional start site, respectively, and all were open sea), while GCLC, TXNRD1, AKR1C1, AKR1C2, PGD, SRXN1, ABCC2, and MSRB1each had only one differentially-methylated CpG site: cg02731193, cg03331715, cg19648686, cg19648686, cg04909257, cg18484212, cg19378330, and cg04806177, respectively. Most of these were located in the gene body, except for cg03331715 of TXNRD1 that was in the 5′UTR. Moreover, GCLC and MSRB1 had N-shore differentially-methylated CpG sites, while those belonging to TXNRD1, ABCC2, AKR1C1, and AKR1C2 were open sea sites. Furthermore, SRXN1 had an N-shelf differentially-methylated CpG, while that belonging to PGD was S-Shelf.
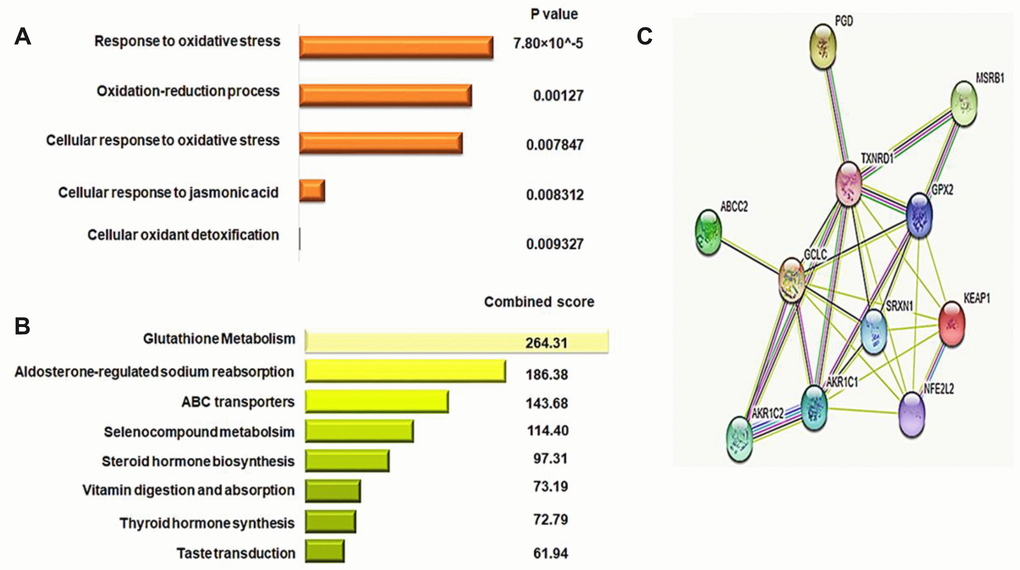
Figure 7. Identification of the gene signature for KEAP1-mutated LUAD. (A) Bar chart showing the top significant biological processes identified by GO analysis of 36 differentially-methylated genes using the DAVID webtool. (B) Bar chart showing the pathways with the top scores identified by KEGG pathway analysis of 36 differentially-methylated genes using the enrichr webtool. (C) Protein-protein interaction network analysis of the potential 9-gene signature predicting the functional correlation of the KEAP1–NRF2 axis with genes involved in drug metabolism and glutathione metabolic pathways in LUAD.
In addition to the GO and KEGG analyses, we used the STRING v10 database to construct a protein-protein interaction (PPI) network of the 9-gene potential signature along with the KEAP1 and NRF2 genes to reveal the complex associations between these genes. The enrichment results, based on the functional association between these genes, revealed that the majority were closely associated with each other through a coordinated interactive network (Figure 7C). Thus, PPI network analysis suggested that cross-talk of KEAP1 and NRF2 with the 9-gene potential signature coordinately drives tumor progression and therapeutic resistance in LUAD.
The 11 CpG sites and their corresponding 9 genes showed significant differential methylation and gene expression between KEAP1-mutated and wild-type tumor samples (Figure 8A, 8B). In order to investigate the effect of methylation changes of these 11 CpG sites on the expression of their corresponding genes and examine the validity of these CpG sites as a basis for a gene expression signature specific for KEAP1-mutated LUAD, we applied Spearman’s correlation to the methylation beta values of these 11CpG sites and expression values of their corresponding genes across 185 LUAD patient samples. Interestingly, we found a strong negative correlation between methylation of the CpG sites cg10880599, cg09643186, and cg26155983 and the expression of GPX2 as well as cg02731193, cg03331715, cg19648686, cg19648686, cg04909257, cg18484212, and cg04806177 and the expression of GCLC, TXNRD1, AKR1C1, AKR1C2, PGD, SRXN1, and MSRB1, respectively. However, we found a strong positive correlation between the methylation of cg19378330 and the expression of ABCC2 (Figure 8C).
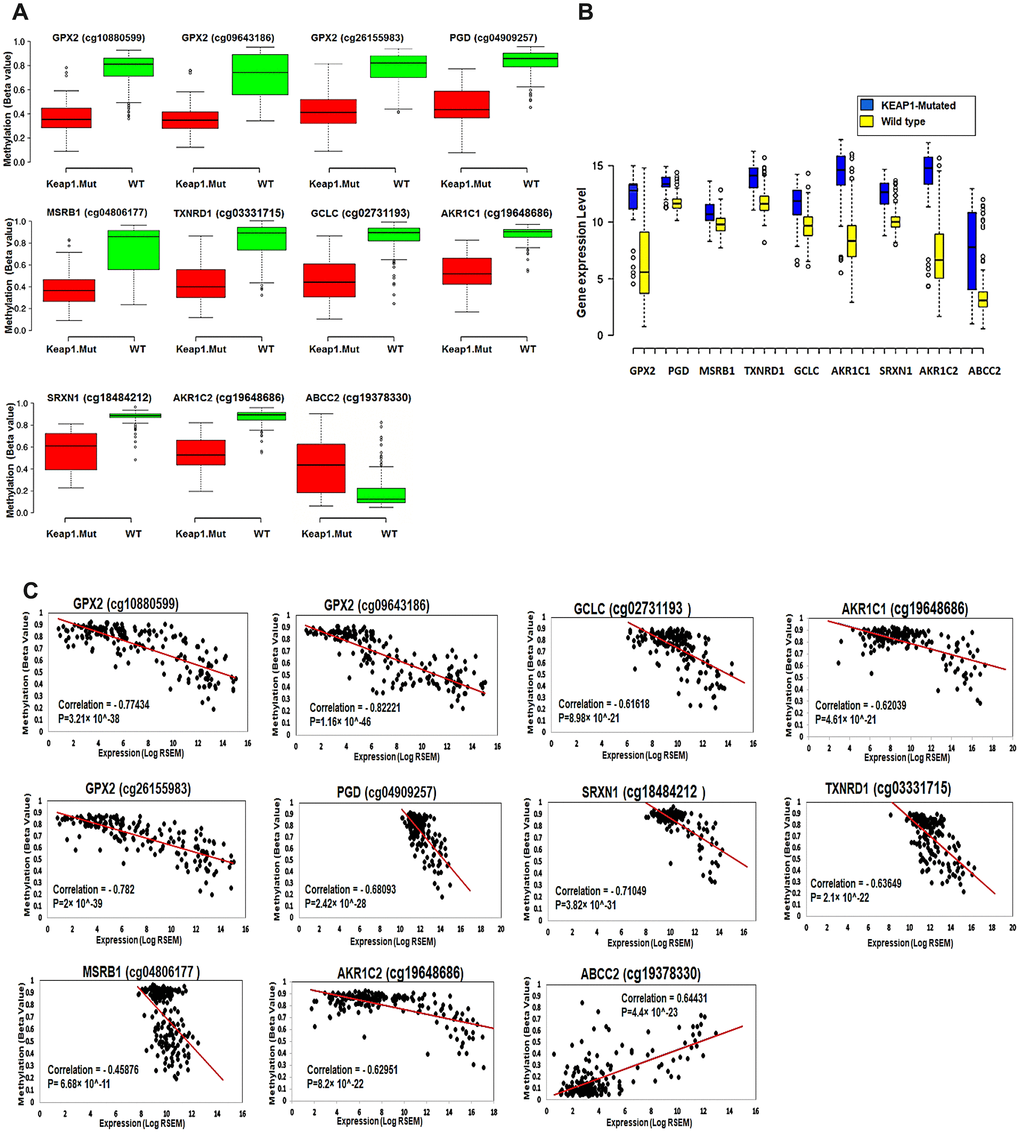
Figure 8. Effect of DNA methylation changes at the 11 CpG sites on the expression of their corresponding genes. (A) Box plots showing the differential methylation of 11 CpG sites between KEAP1-mutated and wild-type tumor samples. These 11 sites belong to the 9 genes included in the top 3 oxidative stress-related GO biological processes obtained by functional annotation analysis of the differentially-methylated genes (WT, wild-type; KEAP1.Mut, KEAP1-mutated). (B) Box plots showing the differential expression of the 9 differentially methylated genes between KEAP1-mutated and wild-type LUAD patient samples. Center lines show the medians; box limits indicate the 25th and 75th percentiles as determined by R software; whiskers extend 1.5 times the interquartile range from the 25th and 75th percentiles; outliers are represented by dots (n =100, 76, 16, 76, and 41 sample points). Boxplots were generated using BoxBlot R webtool. (C) Scatterplots showing the Spearman’s correlation between the methylation of the 11 CpG sites and the expression of their corresponding genes. A strong negative correlation can be seen between the methylation of all the CpG sites and the expression of their corresponding genes except for cg19378330 of the ABCC2 gene, which shows a strong positive correlation.
Validation of DNA methylation and gene expression changes associated with KEAP1 mutation in LUAD
To validate the DNA methylation alterations associated with KEAP1 mutations in LUAD, we subjected the validation data set to differential methylation analysis (β>|0.2|, p <0.05) with BH-FDR adjustment. Interestingly, we found 626 differentially-methylated CpG sites with 582 hypomethylated and 44 hypermethylated (Supplementary File 8). This finding confirmed our result from the discovery data set that KEAP1 mutation in LUAD was associated with DNA hypomethylation. Then, we specifically looked into the DNA methylation changes of these 11 candidates CpG sites. Consistent with our finding in the discovery data set, cg10880599, cg09643186, and cg26155983 that belonged to GPX2, as well as cg02731193, cg03331715, cg19648686, cg19648686, cg04909257, cg18484212, and cg04806177 that belonged to GCLC, TXNRD1, AKR1C1, AKR1C2, PGD, SRXN1, and MSRB1, respectively, showed hypomethylation (Table 2). Also, only cg19378330 of the ABCC2 gene showed hypermethylation. Next, we used the LinkedOmics database to validate the overexpression of these 9 candidate genes in KEAP1-mutated LUAD. We applied differential gene expression analysis to 83 KEAP1-mutated and 478 wild-type LUAD patient samples using the LinkedOmics database (Supplementary File 9). Of these 9 candidate genes, 8 were significantly overexpressed with log Fc>1.5 (GPX2, GCLC, TXNRD1, AKR1C1, AKR1C2, PGD, SRXN1, and ABCC2). MSRB1 was excluded from the KEAP1 mutation-based gene signature as we could not find expression values for MSRB1 in the LinkedOmics database. Therefore, the 8-gene represents a KEAP1 mutation-based DNA methylation and gene expression signature for LUAD.
Table 2. The differential methylation of 11 CpG sites and the differential gene expression of their corresponding 9 genes in both discovery and validation data sets.
| CpG Name | Gene symbol | Delta beta values in discovery group | Delta beta value in validation group | Log FC in discovery group | Log FC in validation group |
| cg10880599 | GPX2 | -0.379498 | -0.34886 | 5.51 | 5.189 |
| cg09643186 | GPX2 | -0.330261 | -0.28731 | 5.51 | 5.189 |
| cg26155983 | GPX2 | -0.321305 | -0.2569 | 5.51 | 5.189 |
| cg04909257 | PGD | -0.359443 | -0.22641 | 1.68 | 1.72 |
| cg04806177 | MSRB1 | -0.348812 | -0.24681 | 1 | - |
| cg03331715 | TXNRD1 | -0.343764 | -0.32573 | 2.9 | 2.15 |
| cg02731193 | GCLC | -0.340017 | -0.23975 | 1.81 | 2.02 |
| cg19648686 | AKR1C2 | -0.333994 | -0.20816 | 6.45 | 6.22 |
| cg19648686 | AKR1C1 | -0.333994 | -0.20816 | 5.31 | 5.27 |
| cg18484212 | SRXN1 | -0.310776 | -0.23541 | 2.37 | 2.35 |
| cg19378330 | ABCC2 | 0.201648 | 0.234805 | 3.94 | 3.46 |
The 8-gene signature is significantly associated with poor survival in LUAD patients
To evaluate the prognostic power of the 8-gene signature in patient survival, we first analyzed overall survival in the TCGA–LUAD cohort using the SurvExpress database. A total of 475 patient samples were divided into high-risk (n = 152) and low-risk groups (n = 323) based on their expression patterns (Figure 9A). The separation of risk groups was optimized using the ‘maximize risk group’ option provided in the SurvExpress database. The survival probability estimates in the two risk groups were visualized as Kaplan-Meier plots. Strikingly, overall survival analysis revealed that the patients in the high-risk group had poorer survival (HR = 2.25; CI = 60.38; p = 1.378×10⁻⁷) than the low-risk group (Figure 9B). Moreover, optimizing risk group separation of the Rousseaux (GSE30219) cohort (85 LUAD patient samples out of 264 lung cancer patient samples) showed that LUAD patients in the high-risk group (n=54) with increased expression of the 8-gene signature had poorer survival (HR = 2.15; CI = 53.48; p = 0.03426) than the low-risk group (n=31) (Figure 9C). In addition, we analyzed the overall survival in the Bild Nevins Lung (GSE3141) cohort available in the SurvExpress database. After optimized risk group separation, a total of 57 LUAD patient samples out of 255 lung cancer patient samples included in the cohort were divided into high-risk (n = 11) and low-risk groups (n = 46) based on their expression patterns (Figure 9D). The survival probability estimates in the two risk groups were represented as Kaplan-Meier plots. Similarly, overall survival analysis showed that the patients in the high-risk group had poorer survival (HR = 3.44; CI = 55.23; p = 0.002362) than the low-risk group.
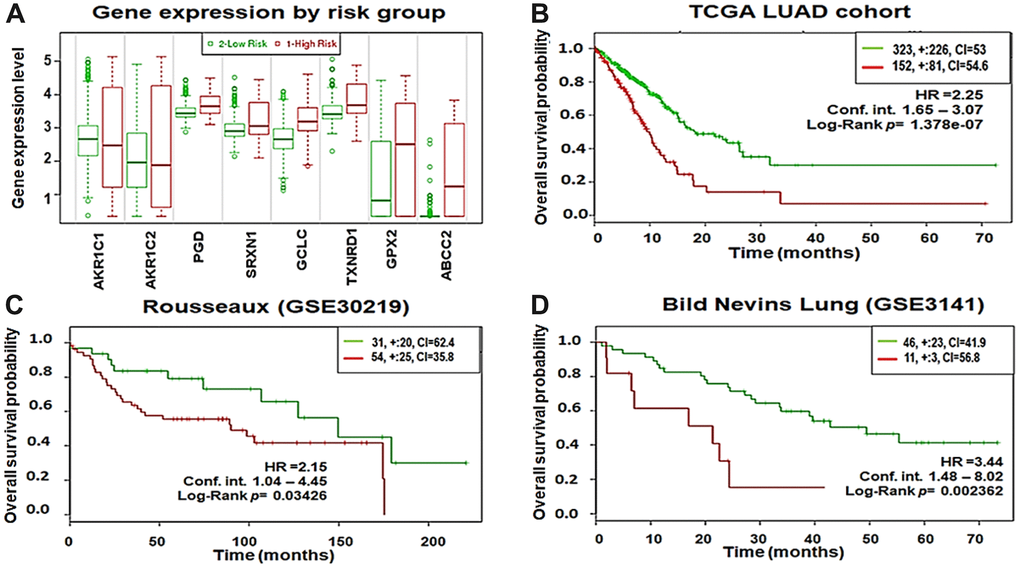
Figure 9. Eight-gene signature predicts poor survival in three independent cohorts. (A) Box plots showing the expression differences of the 8-gene signature in low (green) and high (red) risk groups of TCGA–LUAD patients (y-axis, gene expression value of each gene). (B) Kaplan-Meier survival plots showing that high expression of the 8-gene signature was associated with poor survival in TCGA–LUAD patients. (C) Rousseaux (GSE30219) cohort. (D) Bild Nevins Lung (GSE3141) cohort. Red, high-risk group; green, low-risk group; top right corner inset, numbers of high- and low-risk samples (+, numbers of censored samples) and concordance index (CI) of each risk group (x-axis, time (months); y-axis, overall survival probability; HR, hazard ratio; Conf.Int. confidence interval).
Discussion
To the best of our knowledge, this is the first study to demonstrate the DNA methylation changes associated with KEAP1 mutations and their effect on gene expression in LUAD patients. Mutations in the KEAP1_NRF2 pathway are known to be involved in malignant transformation in various cancer types [23]. It has been shown that KEAP1 gene mutations occur in ~20% of NSCLCs [23]. KEAP1 mutations lead to constitutively active NRF2, enhanced transcriptional induction of antioxidants, xenobiotic metabolism enzymes, drug efflux pumps, and the subsequent protection of cancer cells against chemotherapeutic drugs [24]. Here, we showed that 18% of the TCGA–LUAD patient samples had KEAP1 mutations. However, a recent study on tumor tissue from 1,391 NSCLC patients using next-generation sequencing, reported KEAP1 mutations in 157 patients (11.3%) and identified up to 134 different mutations [25]. Our analysis demonstrated that KEAP1 mutations affected the DNA methylation pattern in LUAD, most of which were hypomethylation (84.67%), and 44.7% of the hypomethylation events occurred at open sea CpG sites. Consistent with our results, Chen et al., reported that KEAP1 mutations in LUAD play a role in genome-wide open sea hypomethylation [26]. Somatic mutations of TP53, one of the well-studied tumor suppressors, are associated with DNA methylation changes. It has been reported that polymorphism at codon 72 rs1042522 of TP53, a polymorphism known to affect the somatic mutation rate in human carcinomas, is associated with higher DNA methylation [27]. Moreover, the DNA methylation landscape can be affected by mutations in epigenetic modifying enzymes such as SETD2, the H3K36me3 writer [28]. Furthermore, mutations in driver genes may perturb the transcriptional circuitry. Such perturbation can aberrantly activate or inactivate DNA-binding proteins causing DNA methylation changes near their binding sites [29, 30].
The locations of the differentially-methylated CpG sites between KEAP1-mutated and wild-type LUAD tumor samples varied among promoter, 5′UTR, 1st exon, and gene body. In agreement with the findings of Varley et. al., we found that the correlation between CpG methylation and gene expression depends on the genomic context [31]
This is evidenced by the recent finding that BRAF V600E and KRAS G13D mutations in colon adenocarcinoma upregulate the transcription factors MAFG and ZNF304, respectively, resulting in targeted promoter CGI hypermethylation near the MAFG and ZNF304 binding sites [32, 33]. Finally, several biological processes that alter DNA methylation at specific sites have been documented recently, and driver gene mutations that promote these DNA methylation-altering processes may change DNA methylation at affected sites. For example, cellular oxidative stress produces hypermethylation at the promoters of low-expression genes [34]; hypoxia reduces 5-methyl-cytosine hydroxylase activity, leading to hypermethylation at targeted sites [35]; hypoxia reduces TET activity, leading to hypermethylation at targeted sites [35]; and cell proliferation causes aberrant DNA methylation to accumulate in the promoters of polycomb group target CpG. In addition, O′Hagan et al. demonstrated that induced cellular oxidative stress recruits DNA methyltransferase 1 (DNMT1) to damaged chromatin. DNMT1 becomes part of a complex(es) containing DNMT3B and members of polycomb repressive complex 4 [34]. Promoters enriched in this complex have histone mark changes and DNA hypermethylation which lead eventually to transcriptional silencing. Paradoxically, this finding by O′Hagan et al. could give an explanation for the noted DNA hypomethylation associated with KEAP1 mutation in LUAD. As we noted earlier, KEAP1 mutations in LUAD result in higher activity of NRF2 and the consequent overexpression of its downstream genes that play a major role in reducing cellular oxidative stress, which ultimately may result in hypomethylation of the reported CpG sites. GO and KEGG pathway analysis of the differentially-methylated genes in KEAP1-mutated LUAD patient samples identified biological processes and pathways involved in reducing oxidative stress. Also, this may suggest the presence of a positive feedback loop between cellular oxidative status and methylation of these CpG sites as well as the expression of their corresponding genes.
Also, we identified a 8-gene expression signature based on DNA methylation alterations associated with KEAP1 mutations in LUAD patients. The 8 genes (GPX2, GCLC, TXNRD1, AKR1C1, AKR1C2, PGD, SRXN1, and ABCC2) showed methylation changes across one or more CpG sites. Further, we tested this signature in 3 independent clinical cohorts, including the TCGA–LUAD cohort. Kaplan-Meier survival plots generated for all 3 cohorts showed that higher expression of this gene signature is significantly correlated with poor survival outcomes.
Recently, it has been suggested that GPX2 might be an important predictor for the prognosis of esophageal squamous cell carcinoma and a potential target for the intervention and treatment of this disease [36]. In addition, it has been shown that a high GCLC level in tumor tissue is associated with a poor prognosis of hepatocellular carcinoma after curative resection [37]. Also, high mRNA expression of GCLC in cancer tissue has been suggested as a potential predictor of cisplatin resistance in lung adenocarcinoma patients [38]. Moreover, TXNRD1 overexpression has been reported in many human malignancies and functions as a prognostic factor for many tumors, such as oral squamous cell carcinomas, lung cancer, breast cancer, astrocytomas, and hepatocellular carcinoma [39]. Furthermore, Tian et al. indicated that AKR1C1 plays an important role in the development and progression of small-cell lung cancer and may represent an independent biomarker for assessment of the primary prognosis and therapy of small-cell lung cancer [40]. In addition, it has been suggested that AKR1C1 was related to drug resistance and targeting AKR1C1 might be an alternative therapy method for SCLC patients [41]. Moreover, it has been stated that lowering the expression of AKR1C1 may inhibit proliferation and migration leading to reduction of drug resistance; in particular, Silencing AKR1C1 could suppress tumor growth and invasion, and also decrease the resistance to regular chemotherapy and radiotherapy [40]. Additionally, AKR1C2 may be considered as one of the biomarkers that indicates cisplatin resistance and may be act as one of the effective molecular targets for rescuing cisplatin sensitivity [42]. In agreement with our finding, Namani et al, have identified a gene expression signature that includes TXNRD1, AKR1C1, AKR1C2, and SRXN1 along with other genes in head and neck squamous cell cancer and non small cell lung cancer [43, 44]. Interestingly, they found that higher expression of this gene signature is associated with poor survival and drug resistance. Moreover, it has been reported that SRXN1 promotes cell invasion, migration in cervical cancer via activating the Wnt/β-catenin signaling pathway, and could be a promising tool for the development of better therapeutic strategies for cancer prevention and treatment [45]. Recent work suggested that 6-phosphogluconate dehydrogenase (6PGD), the key enzyme of oxidative pentose phosphate pathway (PPP), could act as a potential therapeutic target to enhance chemosensitivity in cervical cancer [46]. In addition, Becard et al. identified PGD as a potentially important pro-metastatic driver gene in pancreatic ductal adenocarcinoma [47]. Several studies showed that single nucleotide polymorphisms (SNPs) of the ABCC2 gene are associated with altered distribution, metabolism and elimination of a plethora of drugs in several types of cancer [48–50]. Furthermore, Tumor characterized by overexpressing ABCC2 protein has shown regression in size upon antisense ABCC2 expression in combination with chemotherapy due to chemosensitization; for instance, Tumor size decreased when adenovirus expressing antisense ABCC2 has been directly injected into HepG2 tumors in nude mice [51]. Here, we identified for the first time a gene expression signature based on the DNA methylation alterations associated with KEAP1 mutations in LUAD.
Conclusions
In conclusion, we have described the changes in DNA methylation associated with KEAP1 mutation in LUAD. In addition, we have illustrated a potential synergistic role between DNA methylation alterations associated with KEAP1 mutations and the transcription factor NRF2 which eventually lead to the overexpression of some NRF2 target genes. This finding may provide a better understanding of the molecular mechanisms associated with lung cancer progression and drug resistance. Also, we have identified a signature based on DNA methylation aberration and gene expression for KEAP1-mutated LUAD (Figure 10). This signature may be used in the future as potential biomarker with clinical relevance for the diagnosis, prognosis, and response to therapy of LUAD.
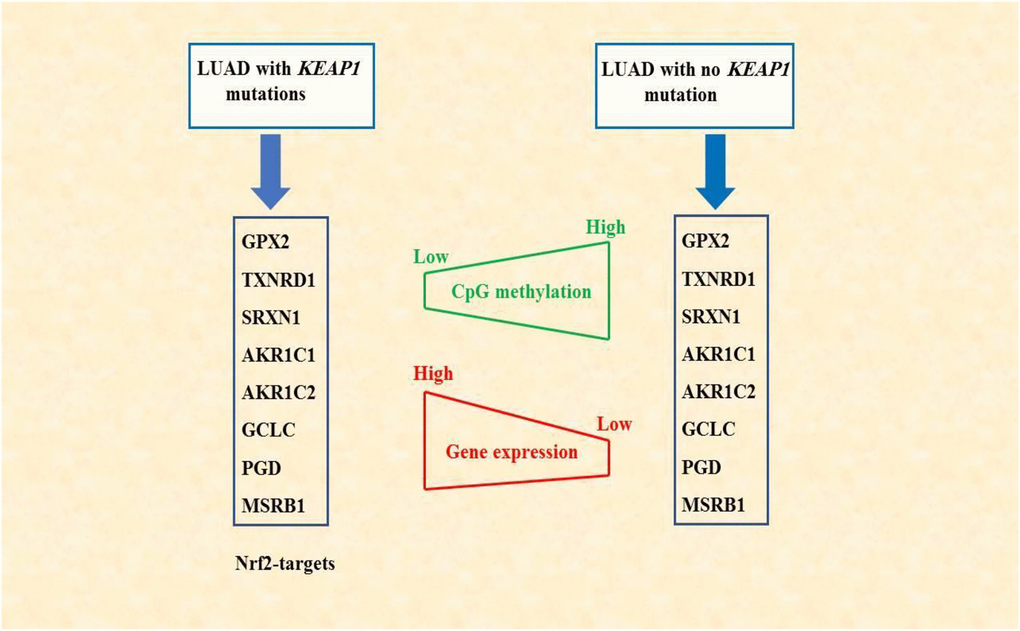
Figure 10. Schematic diagram summarizing the findings of this study. DNA methylation alterations associated with KEAP1 mutations may synergize with NRF2 in regulating gene expression. NRF2-targets, the 8-gene signature, showed low CpG methylation but elevated gene expression levels in LAUD patients with mutated KEAP1.
Materials and Methods
Overall database selection
The Cancer Genome Atlas (TCGA) human genome-wide DNA methylation Level 3 data (Illumina Infinium Human Methylation 450 K BeadChips Platform) for 460 LUAD along with 32 normal lung tissues as well as TCGA RNA-Seq gene expression version2 level 3 data (Illumina HiSeq platform) for 515 LUAD tissues were downloaded from the Broad GDAC (Global Data Assembly Centers) Firehose website (http://gdac.broadinstitute.org/). All the mutation data for KEAP1 used in the present study was obtained from the UCSC Xena Browser (https://xenabrowser.net/) [52]. We checked the TCGA–LUAD mutation data using the UCSC Xena browser and found that, out of 544 LUAD patients with mutation data, only 98 had KEAP1 mutations (18%). We also found that only 77 of these 98 KEAP1-mutant patients had both methylation and gene expression data (Supplementary File 1). Then, we segregated these patients into 3 datasets, the first had 185 LUAD patients [30 with KEAP1 mutations (16.2%) and 155 without KEAP1 mutations (wild-type)] and considered them to be the discovery dataset. The second dataset had 185 LUAD patients (30 with KEAP1 mutations (16.2%) and 155 wild-type patients) and we marked this dataset as a validation cohort. The third dataset had 62 individuals (30 patients with KEAP1 mutations from the discovery dataset and 32 normal individuals) (Supplementary File 2). The comparisons of either DNA methylation or gene expression were specifically held between KEAP1-mutated and wild-type (factors other than KEAP1 mutations) tumor samples.
DNA methylation analysis
We used TCGA–LUAD genome-wide methylation data (level 3) that were generated using the Illumina Infinium Human DNA Methylation 450 K array platform, which interrogates the methylation status of 480,000 CpG sites. DNA methylation levels were reported as β-values which represent the ratio of intensities between locus-specific methylated and unmethylated bead-bound probes. The β-value is a continuous variable, ranging from 0 (unmethylated) to 1 (fully methylated). The three data sets were analyzed in order to identify the differentially-methylated CpG sites between the different groups in each dataset. First, we filtered out probes containing single-nucleotide polymorphisms, repeat sequencing, and probes in the sex-chromosomes from all samples. Then we calculated the delta β-value for all the probes between the different groups. In order to identify differentially-methylated CpG sites, we applied Student’s t test with a p-value cutoff of < 0.05 and BH-FDR adjustment, and we also used a delta β-value cutoff of > |0.2|. Finally, in order to minimize false-positive results and crosscheck the DNA methylation changes associated with KEAP1 mutation, we integrated the differentially-methylated CpG sites between both KEAP1-mutated versus wild-type and KEAP1-mutated versus normal datasets using Venny 2.1 (http://bioinfogp.cnb.csic.es/tools/venny/index.html).
RNA-Seq data analysis
TCGA RNA-Seq gene expression version 2 level 3 data (Illumina Hiseq platform) for 515 LUAD tissues were used to subject the discovery dataset to differential gene expression analysis. Briefly, Level 3 transcriptomic data of the discovery dataset were normalized by the RSEM method [53]. All gene expression values were log-transformed to approximate the data to a normal distribution. The DEGs were identified by applying Student’s t-test with P < 0.05 (BH-FDR adjustment).
Integrative analysis of DNA methylation and gene expression
In order to identify the effect of DNA methylation alterations associated with KEAP1 mutations on gene expression, we performed an integrative analysis between genes that showed differential methylation owing to KEAP1 mutation with a delta β-value > |0.2| and P value < 0.05 with BH-FDR adjustment, as well as genes that showed differential expression between KEAP1-mutated and wild-type patient samples with P < 0.05 (BH-FDR adjustment). The integrative analysis was performed using the Venny 2.1 web-based tool (http://bioinfogp.cnb.csic.es/tools/venny/index.html).
Functional annotation and protein-protein interaction (PPI) network analysis
Functional annotation by GO and KEGG analyses of genes that shows differential methylation and differential expression simultaneously was performed using the updated version of the DAVID v6.8 web tool (https://david.ncifcrf.gov/) [54] and the enrichr database (http://amp.pharm.mssm.edu/Enrichr/) [55], respectively. In addition, PPI network analysis was performed using the STRING v10 database (https://string-db.org/) [56].
Methylation and gene expression correlation analysis
All data were quantile normalized before correlation testing. Overall, 185 patient samples (30 KEAP1-mutated and 155 wild-type) were used to detect significant correlations. The correlation test statistic was based on Pearson’s correlation coefficient between DNA methylation beta values and gene expression levels.
LinkedOmics database analysis
In order to validate the discovery dataset differential gene expression analysis, we carried out differential gene expression analysis between KEAP1-mutated and wild-type LUAD tumor samples using the LinkedOmics database (http://www.linkedomics.org/login.php) [57], an open access web-based resource that contains multi-omics data and clinical data for 32 types of cancer and a total of 11,158 patients from the TCGA project.
Survival analysis
Cox proportional hazard regression was performed using the online survival analysis and biomarker validation tool SurvExpress(http://bioinformatica.mty.itesm.mx:8080/Biomatec/SurvivaX.jsp) [58]. We considered the data from a total of 617 LUAD patients in 3 independent cohorts available in the SurvExpress database: the TCGA–LUAD cohort (n = 475) with another two cohorts–Rousseaux et al., (GSE30219) (n = 86) [59], and Bild et al., (GSE3141) (n = 57) [60] for survival analysis. In the case of microarray-based survival data, we considered the average values for genes whose expression was associated with multiple probe sets such as duplicates or alternatives. SurvExpress separates the patient samples into two groups, high- and low-risk, based on the average expression of the 8-gene signature values, and performed statistical analysis of survival probability of the two groups using the log-rank method. SurvExpress implements two methods to generate risk groups. The first method (default) generates the risk groups splitting the ordered prognostic index (PI) (higher values for higher risk) by the number of risk groups leaving equal number of samples in each group. For two risk groups, this is equivalent to split the PI by the median. The second method to produce risk groups uses an optimization algorithm from the ordered PI. Briefly, for two groups, a log-rank test is performed along all values of the arranged PI. Then, the algorithm chooses the split point where the p-value is minimum. SurvExpress uses the log-rank test to generate Kaplan-Meir plots based on the ‘Survival’ package of the R platform, which is integrated into its website. Log-rank test P < 0.05 was considered to be statistically significant.
Statistical analysis
Details of genome-wide analysis of methylation data are provided in the sections above.
P values for both differential CpG methylation and differential gene expression analyses were calculated using Student’s t-test. The P values were adjusted by the Benjamini-Hochberg procedure with an FDR< 0.05 (q values). Correlations between CpG methylation levels and the corresponding gene expression levels were calculated using Pearson’s correlation coefficient. All the statistical analyses were performed using the Python V3.7 programming language.
Supplementary Materials
Author Contributions
ME conducted the study. XT supervised the study. AI, AH, NA, and XJW assisted in data interpretation. ME and XT wrote the manuscript with assistance from all authors. All authors read and approved the manuscript.
Acknowledgments
The authors wish to thank Professor Haiyan Cen (College of Biosystems Engineering and Food Science, Zhejiang university, Hangzhou, PR China) for collaboration in data analysis.
Conflicts of Interest
The authors declare that they have no conflicts of interest.
Funding
This work was supported by the National Natural Science Foundation of China (31971188 and 31370772).
References
- 1. Toyooka S, Suzuki M, Maruyama R, Toyooka KO, Tsukuda K, Fukuyama Y, Iizasa T, Aoe M, Date H, Fujisawa T, Shimizu N, Gazdar AF. The relationship between aberrant methylation and survival in non-small-cell lung cancers. Br J Cancer. 2004; 91:771–74. https://doi.org/10.1038/sj.bjc.6602013 [PubMed]
- 2. Vizoso M, Puig M, Carmona FJ, Maqueda M, Velásquez A, Gómez A, Labernadie A, Lugo R, Gabasa M, Rigat-Brugarolas LG, Trepat X, Ramírez J, Moran S, et al. Aberrant DNA methylation in non-small cell lung cancer-associated fibroblasts. Carcinogenesis. 2015; 36:1453–63. https://doi.org/10.1093/carcin/bgv146 [PubMed]
- 3. Saghafinia S, Mina M, Riggi N, Hanahan D, Ciriello G. Pan-Cancer Landscape of Aberrant DNA Methylation across Human Tumors. Cell Rep. 2018; 25:1066–1080.e8. https://doi.org/10.1016/j.celrep.2018.09.082 [PubMed]
- 4. Bjaanæs MM, Fleischer T, Halvorsen AR, Daunay A, Busato F, Solberg S, Jørgensen L, Kure E, Edvardsen H, Børresen-Dale AL, Brustugun OT, Tost J, Kristensen V, Helland Å. Genome-wide DNA methylation analyses in lung adenocarcinomas: association with EGFR, KRAS and TP53 mutation status, gene expression and prognosis. Mol Oncol. 2016; 10:330–43. https://doi.org/10.1016/j.molonc.2015.10.021 [PubMed]
- 5. Pacini CE, Bradshaw CR, Garrett NJ, Koziol MJ. Characteristics and homogeneity of N6-methylation in human genomes. Sci Rep. 2019; 9:5185. https://doi.org/10.1038/s41598-019-41601-7 [PubMed]
- 6. Sandoval J, Mendez-Gonzalez J, Nadal E, Chen G, Carmona FJ, Sayols S, Moran S, Heyn H, Vizoso M, Gomez A, Sanchez-Cespedes M, Assenov Y, Müller F, et al. A prognostic DNA methylation signature for stage I non-small-cell lung cancer. J Clin Oncol. 2013; 31:4140–47. https://doi.org/10.1200/JCO.2012.48.5516 [PubMed]
- 7. Itoh K, Wakabayashi N, Katoh Y, Ishii T, Igarashi K, Engel JD, Yamamoto M. Keap1 represses nuclear activation of antioxidant responsive elements by Nrf2 through binding to the amino-terminal Neh2 domain. Genes Dev. 1999; 13:76–86. https://doi.org/10.1101/gad.13.1.76 [PubMed]
- 8. Hammad A, Namani A, Elshaer M, Wang XJ, Tang X. “NRF2 addiction” in lung cancer cells and its impact on cancer therapy. Cancer Lett. 2019; 467:40–49. https://doi.org/10.1016/j.canlet.2019.09.016 [PubMed]
- 9. Zhang DD, Lo SC, Cross JV, Templeton DJ, Hannink M. Keap1 is a redox-regulated substrate adaptor protein for a Cul3-dependent ubiquitin ligase complex. Mol Cell Biol. 2004; 24:10941–53. https://doi.org/10.1128/MCB.24.24.10941-10953.2004 [PubMed]
- 10. Wang H, Liu K, Geng M, Gao P, Wu X, Hai Y, Li Y, Li Y, Luo L, Hayes JD, Wang XJ, Tang X. RXRα inhibits the NRF2-ARE signaling pathway through a direct interaction with the Neh7 domain of NRF2. Cancer Res. 2013; 73:3097–108. https://doi.org/10.1158/0008-5472.CAN-12-3386 [PubMed]
- 11. McMahon M, Itoh K, Yamamoto M, Hayes JD. Keap1-dependent proteasomal degradation of transcription factor Nrf2 contributes to the negative regulation of antioxidant response element-driven gene expression. J Biol Chem. 2003; 278:21592–600. https://doi.org/10.1074/jbc.M300931200 [PubMed]
- 12. Tang X, Wang H, Fan L, Wu X, Xin A, Ren H, Wang XJ. Luteolin inhibits Nrf2 leading to negative regulation of the Nrf2/ARE pathway and sensitization of human lung carcinoma A549 cells to therapeutic drugs. Free Radic Biol Med. 2011; 50:1599–609. https://doi.org/10.1016/j.freeradbiomed.2011.03.008 [PubMed]
- 13. Namani A, Li Y, Wang XJ, Tang X. Modulation of NRF2 signaling pathway by nuclear receptors: implications for cancer. Biochim Biophys Acta. 2014; 1843:1875–85. https://doi.org/10.1016/j.bbamcr.2014.05.003 [PubMed]
- 14. Sporn MB, Liby KT. NRF2 and cancer: the good, the bad and the importance of context. Nat Rev Cancer. 2012; 12:564–71. https://doi.org/10.1038/nrc3278 [PubMed]
- 15. Kansanen E, Kuosmanen SM, Leinonen H, Levonen AL. The Keap1-Nrf2 pathway: mechanisms of activation and dysregulation in cancer. Redox Biol. 2013; 1:45–49. https://doi.org/10.1016/j.redox.2012.10.001 [PubMed]
- 16. Lignitto L, LeBoeuf SE, Homer H, Jiang S, Askenazi M, Karakousi TR, Pass HI, Bhutkar AJ, Tsirigos A, Ueberheide B, Sayin VI, Papagiannakopoulos T, Pagano M. Nrf2 Activation Promotes Lung Cancer Metastasis by Inhibiting the Degradation of Bach1. Cell. 2019; 178:316–329.e18. https://doi.org/10.1016/j.cell.2019.06.003 [PubMed]
- 17. Collisson EA, Campbell JD, Brooks AN, Berger AH, Lee W, Chmielecki J, Beer DG, Cope L, Creighton CJ, Danilova L, Ding L, Getz G, Hammerman PS, et al, and Cancer Genome Atlas Research Network. Comprehensive molecular profiling of lung adenocarcinoma. Nature. 2014; 511:543–50. https://doi.org/10.1038/nature13385 [PubMed]
- 18. Berman BP, Weisenberger DJ, Aman JF, Hinoue T, Ramjan Z, Liu Y, Noushmehr H, Lange CP, van Dijk CM, Tollenaar RA, Van Den Berg D, Laird PW. Regions of focal DNA hypermethylation and long-range hypomethylation in colorectal cancer coincide with nuclear lamina-associated domains. Nat Genet. 2011; 44:40–46. https://doi.org/10.1038/ng.969 [PubMed]
- 19. Selamat SA, Chung BS, Girard L, Zhang W, Zhang Y, Campan M, Siegmund KD, Koss MN, Hagen JA, Lam WL, Lam S, Gazdar AF, Laird-Offringa IA. Genome-scale analysis of DNA methylation in lung adenocarcinoma and integration with mRNA expression. Genome Res. 2012; 22:1197–211. https://doi.org/10.1101/gr.132662.111 [PubMed]
- 20. Karlsson A, Jönsson M, Lauss M, Brunnström H, Jönsson P, Borg Å, Jönsson G, Ringnér M, Planck M, Staaf J. Genome-wide DNA methylation analysis of lung carcinoma reveals one neuroendocrine and four adenocarcinoma epitypes associated with patient outcome. Clin Cancer Res. 2014; 20:6127–40. https://doi.org/10.1158/1078-0432.CCR-14-1087 [PubMed]
- 21. Tian Y, Liu Q, He X, Yuan X, Chen Y, Chu Q, Wu K. Emerging roles of Nrf2 signal in non-small cell lung cancer. J Hematol Oncol. 2016; 9:14. https://doi.org/10.1186/s13045-016-0246-5 [PubMed]
- 22. Lee C, Huang CH. LASAGNA-Search 2.0: integrated transcription factor binding site search and visualization in a browser. Bioinformatics. 2014; 30:1923–25. https://doi.org/10.1093/bioinformatics/btu115 [PubMed]
- 23. Singh A, Misra V, Thimmulappa RK, Lee H, Ames S, Hoque MO, Herman JG, Baylin SB, Sidransky D, Gabrielson E, Brock MV, Biswal S. Dysfunctional KEAP1-NRF2 interaction in non-small-cell lung cancer. PLoS Med. 2006; 3:e420. https://doi.org/10.1371/journal.pmed.0030420 [PubMed]
- 24. Li QK, Singh A, Biswal S, Askin F, Gabrielson E. KEAP1 gene mutations and NRF2 activation are common in pulmonary papillary adenocarcinoma. J Hum Genet. 2011; 56:230–34. https://doi.org/10.1038/jhg.2010.172 [PubMed]
- 25. Frank R, Scheffler M, Merkelbach-Bruse S, Ihle MA, Kron A, Rauer M, Ueckeroth F, König K, Michels S, Fischer R, Eisert A, Fassunke J, Heydt C, et al. Clinical and Pathological Characteristics of KEAP1- and NFE2L2-Mutated Non–Small Cell Lung Carcinoma (NSCLC). Clin Cancer Res. 2018; 24:3087. https://doi.org/10.1158/1078-0432.CCR-17-3416 [PubMed]
- 26. Chen YC, Gotea V, Margolin G, Elnitski L. Significant associations between driver gene mutations and DNA methylation alterations across many cancer types. PLoS Comput Biol. 2017; 13:e1005840. https://doi.org/10.1371/journal.pcbi.1005840 [PubMed]
- 27. Rebbani K, Marchio A, Ezzikouri S, Afifi R, Kandil M, Bahri O, Triki H, El Feydi AE, Dejean A, Benjelloun S, Pineau P. TP53 R72P polymorphism modulates DNA methylation in hepatocellular carcinoma. Mol Cancer. 2015; 14:74. https://doi.org/10.1186/s12943-015-0340-2 [PubMed]
- 28. Tiedemann RL, Hlady RA, Hanavan PD, Lake DF, Tibes R, Lee JH, Choi JH, Ho TH, Robertson KD. Dynamic reprogramming of DNA methylation in SETD2-deregulated renal cell carcinoma. Oncotarget. 2016; 7:1927–46. https://doi.org/10.18632/oncotarget.6481 [PubMed]
- 29. Struhl K. Is DNA methylation of tumour suppressor genes epigenetic? eLife. 2014; 3:e02475. https://doi.org/10.7554/eLife.02475 [PubMed]
- 30. Zhu H, Wang G, Qian J. Transcription factors as readers and effectors of DNA methylation. Nat Rev Genet. 2016; 17:551–65. https://doi.org/10.1038/nrg.2016.83 [PubMed]
- 31. Varley KE, Gertz J, Bowling KM, Parker SL, Reddy TE, Pauli-Behn F, Cross MK, Williams BA, Stamatoyannopoulos JA, Crawford GE, Absher DM, Wold BJ, Myers RM. Dynamic DNA methylation across diverse human cell lines and tissues. Genome Res. 2013; 23:555–67. https://doi.org/10.1101/gr.147942.112 [PubMed]
- 32. Fang M, Ou J, Hutchinson L, Green MR. The BRAF oncoprotein functions through the transcriptional repressor MAFG to mediate the CpG Island Methylator phenotype. Mol Cell. 2014; 55:904–15. https://doi.org/10.1016/j.molcel.2014.08.010 [PubMed]
- 33. Serra RW, Fang M, Park SM, Hutchinson L, Green MR. A KRAS-directed transcriptional silencing pathway that mediates the CpG island methylator phenotype. eLife. 2014; 3:e02313. https://doi.org/10.7554/eLife.02313 [PubMed]
- 34. O’Hagan HM, Wang W, Sen S, Destefano Shields C, Lee SS, Zhang YW, Clements EG, Cai Y, Van Neste L, Easwaran H, Casero RA, Sears CL, Baylin SB. Oxidative damage targets complexes containing DNA methyltransferases, SIRT1, and polycomb members to promoter CpG Islands. Cancer Cell. 2011; 20:606–19. https://doi.org/10.1016/j.ccr.2011.09.012 [PubMed]
- 35. Thienpont B, Steinbacher J, Zhao H, D’Anna F, Kuchnio A, Ploumakis A, Ghesquière B, Van Dyck L, Boeckx B, Schoonjans L, Hermans E, Amant F, Kristensen VN, et al. Tumour hypoxia causes DNA hypermethylation by reducing TET activity. Nature. 2016; 537:63–68. https://doi.org/10.1038/nature19081 [PubMed]
- 36. Lei Z, Tian D, Zhang C, Zhao S, Su M. Clinicopathological and prognostic significance of GPX2 protein expression in esophageal squamous cell carcinoma. BMC Cancer. 2016; 16:410–410. https://doi.org/10.1186/s12885-016-2462-3 [PubMed]
- 37. Sun J, Zhou C, Ma Q, Chen W, Atyah M, Yin Y, Fu P, Liu S, Hu B, Ren N, Zhou H. High GCLC level in tumor tissues is associated with poor prognosis of hepatocellular carcinoma after curative resection. J Cancer. 2019; 10:3333–43. https://doi.org/10.7150/jca.29769 [PubMed]
- 38. Hiyama N, Ando T, Maemura K, Sakatani T, Amano Y, Watanabe K, Kage H, Yatomi Y, Nagase T, Nakajima J, Takai D. Glutamate-cysteine ligase catalytic subunit is associated with cisplatin resistance in lung adenocarcinoma. Jpn J Clin Oncol. 2018; 48:303–07. https://doi.org/10.1093/jjco/hyy013 [PubMed]
- 39. Fu B, Meng W, Zeng X, Zhao H, Liu W, Zhang T. TXNRD1 Is an Unfavorable Prognostic Factor for Patients with Hepatocellular Carcinoma. Biomed Res Int. 2017; 2017:4698167–4698167. https://doi.org/10.1155/2017/4698167 [PubMed]
- 40. Tian H, Li X, Jiang W, Lv C, Sun W, Huang C, Chen R. High expression of AKR1C1 is associated with proliferation and migration of small-cell lung cancer cells. Lung Cancer (Auckl). 2016; 7:53–61. https://doi.org/10.2147/LCTT.S90694 [PubMed]
- 41. Wang HW, Lin CP, Chiu JH, Chow KC, Kuo KT, Lin CS, Wang LS. Reversal of inflammation-associated dihydrodiol dehydrogenases (AKR1C1 and AKR1C2) overexpression and drug resistance in nonsmall cell lung cancer cells by wogonin and chrysin. Int J Cancer. 2007; 120:2019–27. https://doi.org/10.1002/ijc.22402 [PubMed]
- 42. Shirato A, Kikugawa T, Miura N, Tanji N, Takemori N, Higashiyama S, Yokoyama M. Cisplatin resistance by induction of aldo-keto reductase family 1 member C2 in human bladder cancer cells. Oncol Lett. 2014; 7:674–78. https://doi.org/10.3892/ol.2013.1768 [PubMed]
- 43. Namani A, Matiur Rahaman M, Chen M, Tang X. Gene-expression signature regulated by the KEAP1-NRF2-CUL3 axis is associated with a poor prognosis in head and neck squamous cell cancer. BMC Cancer. 2018; 18:46. https://doi.org/10.1186/s12885-017-3907-z [PubMed]
- 44. Namani A, Cui QQ, Wu Y, Wang H, Wang XJ, Tang X. NRF2-regulated metabolic gene signature as a prognostic biomarker in non-small cell lung cancer. Oncotarget. 2017; 8:69847–62. https://doi.org/10.18632/oncotarget.19349 [PubMed]
- 45. Lan K, Zhao Y, Fan Y, Ma B, Yang S, Liu Q, Linghu H, Wang H. Sulfiredoxin May Promote Cervical Cancer Metastasis via Wnt/β-Catenin Signaling Pathway. Int J Mol Sci. 2017; 18:917. https://doi.org/10.3390/ijms18050917 [PubMed]
- 46. Guo H, Xiang Z, Zhang Y, Sun D. Inhibiting 6-phosphogluconate dehydrogenase enhances chemotherapy efficacy in cervical cancer via AMPK-independent inhibition of RhoA and Rac1. Clin Transl Oncol. 2019; 21:404–11. https://doi.org/10.1007/s12094-018-1937-x [PubMed]
- 47. Bechard ME, Word AE, Tran AV, Liu X, Locasale JW, McDonald OG. Pentose conversions support the tumorigenesis of pancreatic cancer distant metastases. Oncogene. 2018; 37:5248–56. https://doi.org/10.1038/s41388-018-0346-5 [PubMed]
- 48. Campa D, Müller P, Edler L, Knoefel L, Barale R, Heussel CP, Thomas M, Canzian F, Risch A. A comprehensive study of polymorphisms in ABCB1, ABCC2 and ABCG2 and lung cancer chemotherapy response and prognosis. Int J Cancer. 2012; 131:2920–28. https://doi.org/10.1002/ijc.27567 [PubMed]
- 49. Liu Y, Yin Y, Sheng Q, Lu X, Wang F, Lin Z, Tian H, Xu A, Zhang J. Association of ABCC2 -24C>T polymorphism with high-dose methotrexate plasma concentrations and toxicities in childhood acute lymphoblastic leukemia. PLoS One. 2014; 9:e82681. https://doi.org/10.1371/journal.pone.0082681 [PubMed]
- 50. Han JY, Lim HS, Yoo YK, Shin ES, Park YH, Lee SY, Lee JE, Lee DH, Kim HT, Lee JS. Associations of ABCB1, ABCC2, and ABCG2 polymorphisms with irinotecan-pharmacokinetics and clinical outcome in patients with advanced non-small cell lung cancer. Cancer. 2007; 110:138–47. https://doi.org/10.1002/cncr.22760 [PubMed]
- 51. Folmer Y, Schneider M, Blum HE, Hafkemeyer P. Reversal of drug resistance of hepatocellular carcinoma cells by adenoviral delivery of anti-ABCC2 antisense constructs. Cancer Gene Ther. 2007; 14:875–84. https://doi.org/10.1038/sj.cgt.7701082 [PubMed]
- 52. Goldman M, Craft B, Hastie M, Repečka K, Kamath A, McDade F, Rogers D, Brooks AN, Zhu J, Haussler D. The UCSC Xena platform for public and private cancer genomics data visualization and interpretation. bioRxiv. 2019. https://doi.org/10.1101/326470
- 53. Li B, Dewey CN. RSEM: accurate transcript quantification from RNA-Seq data with or without a reference genome. BMC Bioinformatics. 2011; 12:323. https://doi.org/10.1186/1471-2105-12-323 [PubMed]
- 54. Huang W, Sherman BT, Lempicki RA. Systematic and integrative analysis of large gene lists using DAVID bioinformatics resources. Nat Protoc. 2009; 4:44–57. https://doi.org/10.1038/nprot.2008.211 [PubMed]
- 55. Kuleshov MV, Jones MR, Rouillard AD, Fernandez NF, Duan Q, Wang Z, Koplev S, Jenkins SL, Jagodnik KM, Lachmann A, McDermott MG, Monteiro CD, Gundersen GW, Ma’ayan A. Enrichr: a comprehensive gene set enrichment analysis web server 2016 update. Nucleic Acids Res. 2016; 44:W90–7. https://doi.org/10.1093/nar/gkw377 [PubMed]
- 56. Szklarczyk D, Morris JH, Cook H, Kuhn M, Wyder S, Simonovic M, Santos A, Doncheva NT, Roth A, Bork P, Jensen LJ, von Mering C. The STRING database in 2017: quality-controlled protein-protein association networks, made broadly accessible. Nucleic Acids Res. 2017; 45:D362–68. https://doi.org/10.1093/nar/gkw937 [PubMed]
- 57. Vasaikar SV, Straub P, Wang J, Zhang B. LinkedOmics: analyzing multi-omics data within and across 32 cancer types. Nucleic Acids Res. 2018; 46:D956–63. https://doi.org/10.1093/nar/gkx1090 [PubMed]
- 58. Aguirre-Gamboa R, Gomez-Rueda H, Martínez-Ledesma E, Martínez-Torteya A, Chacolla-Huaringa R, Rodriguez-Barrientos A, Tamez-Peña JG, Treviño V. SurvExpress: an online biomarker validation tool and database for cancer gene expression data using survival analysis. PLoS One. 2013; 8:e74250–74250. https://doi.org/10.1371/journal.pone.0074250 [PubMed]
- 59. Rousseaux S, Debernardi A, Jacquiau B, Vitte AL, Vesin A, Nagy-Mignotte H, Moro-Sibilot D, Brichon PY, Lantuejoul S, Hainaut P, Laffaire J, de Reyniès A, Beer DG, et al. Ectopic activation of germline and placental genes identifies aggressive metastasis-prone lung cancers. Sci Transl Med. 2013; 5:186ra66. https://doi.org/10.1126/scitranslmed.3005723 [PubMed]
- 60. Bild AH, Yao G, Chang JT, Wang Q, Potti A, Chasse D, Joshi MB, Harpole D, Lancaster JM, Berchuck A, Olson JA
Jr , Marks JR, Dressman HK, et al. Oncogenic pathway signatures in human cancers as a guide to targeted therapies. Nature. 2006; 439:353–57. https://doi.org/10.1038/nature04296 [PubMed]