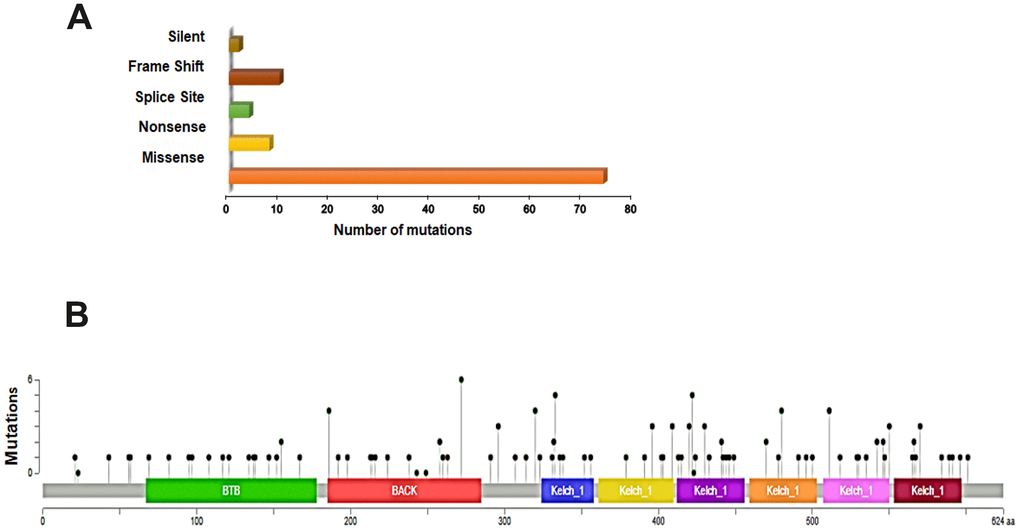
Figure 1.Overview of genetic changes in KEAP1 in TCGA–LUAD patients. (A) Bar chart showing the types and numbers of mutations of KEAP1. (B) OnkoKB-predicted mutation maps (lollipop plots) showing the locations of mutations in the functional domains of KEAP1 proteins. The lollipops show the locations of the mutations as identified by whole-exon sequencing.