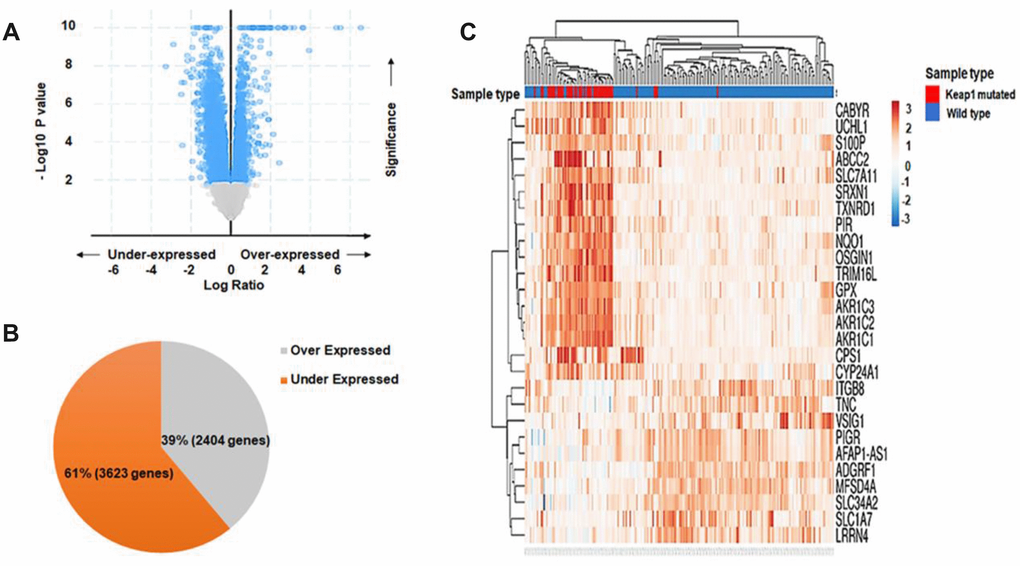
Figure 6.Differential gene expression analysis. (A) Volcano plot showing the distribution of DEGs between KEAP1-mutated and wild-type LUAD patient samples based on significance and fold change. (B) Pie chart showing the percentages of overexpressed and underexpressed genes. (C) Heatmap showing the top DEGs between KEAP1-mutated and wild-type LUAD patient samples with Log Fc>|2| and p <0.05.